Free Statistics

of Irreproducible Research!

Author's title

Author*Unverified author*
R Software Modulerwasp_autocorrelation.wasp
Title produced by software(Partial) Autocorrelation Function
Date of computationWed, 05 May 2010 21:21:25 +0000
Cite this page as followsStatistical Computations at FreeStatistics.org, Office for Research Development and Education, URL https://freestatistics.org/blog/index.php?v=date/2010/May/05/t1273094523xrcnhoza3as5k1u.htm/, Retrieved Sat, 27 Apr 2024 13:51:21 +0000
Statistical Computations at FreeStatistics.org, Office for Research Development and Education, URL https://freestatistics.org/blog/index.php?pk=75582, Retrieved Sat, 27 Apr 2024 13:51:21 +0000
QR Codes:

Original text written by user:
IsPrivate?No (this computation is public)
User-defined keywordsKDGP2W21
Estimated Impact153
Family? (F = Feedback message, R = changed R code, M = changed R Module, P = changed Parameters, D = changed Data)
-       [(Partial) Autocorrelation Function] [Jeroen Cornelisse...] [2010-05-05 21:21:25] [f3cdcbccc174fec74ce5399cef7e1772] [Current]
Feedback Forum

Post a new message
Dataseries X:
112
118
129
99
116
168
118
129
205
147
150
267
126
129
124
97
102
127
222
214
118
141
154
226
89
77
82
97
127
121
117
117
106
112
134
169
75
108
115
85
101
108
109
124
105
95
135
164
88
85
112
87
91
87
87
142
95
108
139
159
61
82
124
93
108
75
87
103
90
108
123
129
57
65
67
71
76
67
110
118
99
85
107
141
58
65
70
86
93
74
87
73
101
100
96
157
63
115
70
66
67
83
79
77
102
116
100
135
71
60
89
74
73
91
86
74
87
87
109
137
43
69
73
77
69
76
78
70
83
65
110
132
54
55
66
65
60
65
96
55
71
63
74
106
34
47
56
53
53
55
67
52
46
51
58
91
33
40
46
45
41
55
57
54
46
52
48
77
30
35
42
48
44
45


Summary of computational transaction
Raw Inputview raw input (R code)
Raw Outputview raw output of R engine
Computing time2 seconds
R Server'Gwilym Jenkins' @ 72.249.127.135

\begin{tabular}{lllllllll}
\hline
Summary of computational transaction \tabularnewline
Raw Input & view raw input (R code)  \tabularnewline
Raw Output & view raw output of R engine  \tabularnewline
Computing time & 2 seconds \tabularnewline
R Server & 'Gwilym Jenkins' @ 72.249.127.135 \tabularnewline
\hline
\end{tabular}
%Source: https://freestatistics.org/blog/index.php?pk=75582&T=0

[TABLE]
[ROW][C]Summary of computational transaction[/C][/ROW]
[ROW][C]Raw Input[/C][C]view raw input (R code) [/C][/ROW]
[ROW][C]Raw Output[/C][C]view raw output of R engine [/C][/ROW]
[ROW][C]Computing time[/C][C]2 seconds[/C][/ROW]
[ROW][C]R Server[/C][C]'Gwilym Jenkins' @ 72.249.127.135[/C][/ROW]
[/TABLE]
Source: https://freestatistics.org/blog/index.php?pk=75582&T=0

Globally Unique Identifier (entire table): ba.freestatistics.org/blog/index.php?pk=75582&T=0

As an alternative you can also use a QR Code:  

The GUIDs for individual cells are displayed in the table below:

Summary of computational transaction
Raw Inputview raw input (R code)
Raw Outputview raw output of R engine
Computing time2 seconds
R Server'Gwilym Jenkins' @ 72.249.127.135


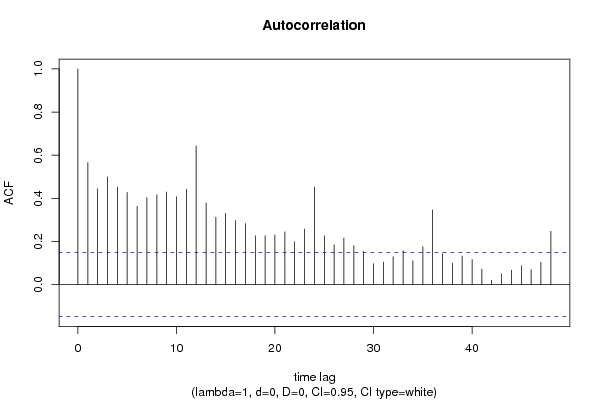
Autocorrelation Function
Time lag kACF(k)T-STATP-value
10.5659277.46510
20.4445095.86350
30.4995126.5890
40.4517215.95860
50.4272725.63610
60.3627754.78532e-06
70.4028875.31440
80.41625.49010
90.4293295.66320
100.4075845.37640
110.4423275.83470
120.6431138.48320
130.3787144.99561e-06
140.3124454.12142.9e-05
150.3305344.361.1e-05
160.2977763.92796.2e-05
170.2831923.73560.000127
180.2260532.98180.001638
190.2270332.99480.001574
200.2311843.04950.001325
210.2449823.23150.000736
220.19852.61840.004807
230.257763.40010.000418
240.4516675.95790
250.2264052.98650.001615
260.1846682.43590.007931
270.21592.84790.002465
280.1805442.38150.00916
290.153882.02980.021949
300.0969711.27910.101276
310.1046081.37990.084698
320.129611.70970.044555
330.1574782.07730.019622
340.1107231.46050.072973
350.1757412.31820.010801
360.346424.56965e-06
370.1433581.8910.030142
380.099221.30880.096165
390.1321651.74340.041517
400.116431.53580.063199
410.0714950.94310.173472
420.0199370.2630.396438
430.050270.66310.25407
440.0669670.88340.189132
450.0873231.15190.125478
460.0699450.92260.178735
470.1042421.3750.085442
480.2471953.26070.000669

\begin{tabular}{lllllllll}
\hline
Autocorrelation Function \tabularnewline
Time lag k & ACF(k) & T-STAT & P-value \tabularnewline
1 & 0.565927 & 7.4651 & 0 \tabularnewline
2 & 0.444509 & 5.8635 & 0 \tabularnewline
3 & 0.499512 & 6.589 & 0 \tabularnewline
4 & 0.451721 & 5.9586 & 0 \tabularnewline
5 & 0.427272 & 5.6361 & 0 \tabularnewline
6 & 0.362775 & 4.7853 & 2e-06 \tabularnewline
7 & 0.402887 & 5.3144 & 0 \tabularnewline
8 & 0.4162 & 5.4901 & 0 \tabularnewline
9 & 0.429329 & 5.6632 & 0 \tabularnewline
10 & 0.407584 & 5.3764 & 0 \tabularnewline
11 & 0.442327 & 5.8347 & 0 \tabularnewline
12 & 0.643113 & 8.4832 & 0 \tabularnewline
13 & 0.378714 & 4.9956 & 1e-06 \tabularnewline
14 & 0.312445 & 4.1214 & 2.9e-05 \tabularnewline
15 & 0.330534 & 4.36 & 1.1e-05 \tabularnewline
16 & 0.297776 & 3.9279 & 6.2e-05 \tabularnewline
17 & 0.283192 & 3.7356 & 0.000127 \tabularnewline
18 & 0.226053 & 2.9818 & 0.001638 \tabularnewline
19 & 0.227033 & 2.9948 & 0.001574 \tabularnewline
20 & 0.231184 & 3.0495 & 0.001325 \tabularnewline
21 & 0.244982 & 3.2315 & 0.000736 \tabularnewline
22 & 0.1985 & 2.6184 & 0.004807 \tabularnewline
23 & 0.25776 & 3.4001 & 0.000418 \tabularnewline
24 & 0.451667 & 5.9579 & 0 \tabularnewline
25 & 0.226405 & 2.9865 & 0.001615 \tabularnewline
26 & 0.184668 & 2.4359 & 0.007931 \tabularnewline
27 & 0.2159 & 2.8479 & 0.002465 \tabularnewline
28 & 0.180544 & 2.3815 & 0.00916 \tabularnewline
29 & 0.15388 & 2.0298 & 0.021949 \tabularnewline
30 & 0.096971 & 1.2791 & 0.101276 \tabularnewline
31 & 0.104608 & 1.3799 & 0.084698 \tabularnewline
32 & 0.12961 & 1.7097 & 0.044555 \tabularnewline
33 & 0.157478 & 2.0773 & 0.019622 \tabularnewline
34 & 0.110723 & 1.4605 & 0.072973 \tabularnewline
35 & 0.175741 & 2.3182 & 0.010801 \tabularnewline
36 & 0.34642 & 4.5696 & 5e-06 \tabularnewline
37 & 0.143358 & 1.891 & 0.030142 \tabularnewline
38 & 0.09922 & 1.3088 & 0.096165 \tabularnewline
39 & 0.132165 & 1.7434 & 0.041517 \tabularnewline
40 & 0.11643 & 1.5358 & 0.063199 \tabularnewline
41 & 0.071495 & 0.9431 & 0.173472 \tabularnewline
42 & 0.019937 & 0.263 & 0.396438 \tabularnewline
43 & 0.05027 & 0.6631 & 0.25407 \tabularnewline
44 & 0.066967 & 0.8834 & 0.189132 \tabularnewline
45 & 0.087323 & 1.1519 & 0.125478 \tabularnewline
46 & 0.069945 & 0.9226 & 0.178735 \tabularnewline
47 & 0.104242 & 1.375 & 0.085442 \tabularnewline
48 & 0.247195 & 3.2607 & 0.000669 \tabularnewline
\hline
\end{tabular}
%Source: https://freestatistics.org/blog/index.php?pk=75582&T=1

[TABLE]
[ROW][C]Autocorrelation Function[/C][/ROW]
[ROW][C]Time lag k[/C][C]ACF(k)[/C][C]T-STAT[/C][C]P-value[/C][/ROW]
[ROW][C]1[/C][C]0.565927[/C][C]7.4651[/C][C]0[/C][/ROW]
[ROW][C]2[/C][C]0.444509[/C][C]5.8635[/C][C]0[/C][/ROW]
[ROW][C]3[/C][C]0.499512[/C][C]6.589[/C][C]0[/C][/ROW]
[ROW][C]4[/C][C]0.451721[/C][C]5.9586[/C][C]0[/C][/ROW]
[ROW][C]5[/C][C]0.427272[/C][C]5.6361[/C][C]0[/C][/ROW]
[ROW][C]6[/C][C]0.362775[/C][C]4.7853[/C][C]2e-06[/C][/ROW]
[ROW][C]7[/C][C]0.402887[/C][C]5.3144[/C][C]0[/C][/ROW]
[ROW][C]8[/C][C]0.4162[/C][C]5.4901[/C][C]0[/C][/ROW]
[ROW][C]9[/C][C]0.429329[/C][C]5.6632[/C][C]0[/C][/ROW]
[ROW][C]10[/C][C]0.407584[/C][C]5.3764[/C][C]0[/C][/ROW]
[ROW][C]11[/C][C]0.442327[/C][C]5.8347[/C][C]0[/C][/ROW]
[ROW][C]12[/C][C]0.643113[/C][C]8.4832[/C][C]0[/C][/ROW]
[ROW][C]13[/C][C]0.378714[/C][C]4.9956[/C][C]1e-06[/C][/ROW]
[ROW][C]14[/C][C]0.312445[/C][C]4.1214[/C][C]2.9e-05[/C][/ROW]
[ROW][C]15[/C][C]0.330534[/C][C]4.36[/C][C]1.1e-05[/C][/ROW]
[ROW][C]16[/C][C]0.297776[/C][C]3.9279[/C][C]6.2e-05[/C][/ROW]
[ROW][C]17[/C][C]0.283192[/C][C]3.7356[/C][C]0.000127[/C][/ROW]
[ROW][C]18[/C][C]0.226053[/C][C]2.9818[/C][C]0.001638[/C][/ROW]
[ROW][C]19[/C][C]0.227033[/C][C]2.9948[/C][C]0.001574[/C][/ROW]
[ROW][C]20[/C][C]0.231184[/C][C]3.0495[/C][C]0.001325[/C][/ROW]
[ROW][C]21[/C][C]0.244982[/C][C]3.2315[/C][C]0.000736[/C][/ROW]
[ROW][C]22[/C][C]0.1985[/C][C]2.6184[/C][C]0.004807[/C][/ROW]
[ROW][C]23[/C][C]0.25776[/C][C]3.4001[/C][C]0.000418[/C][/ROW]
[ROW][C]24[/C][C]0.451667[/C][C]5.9579[/C][C]0[/C][/ROW]
[ROW][C]25[/C][C]0.226405[/C][C]2.9865[/C][C]0.001615[/C][/ROW]
[ROW][C]26[/C][C]0.184668[/C][C]2.4359[/C][C]0.007931[/C][/ROW]
[ROW][C]27[/C][C]0.2159[/C][C]2.8479[/C][C]0.002465[/C][/ROW]
[ROW][C]28[/C][C]0.180544[/C][C]2.3815[/C][C]0.00916[/C][/ROW]
[ROW][C]29[/C][C]0.15388[/C][C]2.0298[/C][C]0.021949[/C][/ROW]
[ROW][C]30[/C][C]0.096971[/C][C]1.2791[/C][C]0.101276[/C][/ROW]
[ROW][C]31[/C][C]0.104608[/C][C]1.3799[/C][C]0.084698[/C][/ROW]
[ROW][C]32[/C][C]0.12961[/C][C]1.7097[/C][C]0.044555[/C][/ROW]
[ROW][C]33[/C][C]0.157478[/C][C]2.0773[/C][C]0.019622[/C][/ROW]
[ROW][C]34[/C][C]0.110723[/C][C]1.4605[/C][C]0.072973[/C][/ROW]
[ROW][C]35[/C][C]0.175741[/C][C]2.3182[/C][C]0.010801[/C][/ROW]
[ROW][C]36[/C][C]0.34642[/C][C]4.5696[/C][C]5e-06[/C][/ROW]
[ROW][C]37[/C][C]0.143358[/C][C]1.891[/C][C]0.030142[/C][/ROW]
[ROW][C]38[/C][C]0.09922[/C][C]1.3088[/C][C]0.096165[/C][/ROW]
[ROW][C]39[/C][C]0.132165[/C][C]1.7434[/C][C]0.041517[/C][/ROW]
[ROW][C]40[/C][C]0.11643[/C][C]1.5358[/C][C]0.063199[/C][/ROW]
[ROW][C]41[/C][C]0.071495[/C][C]0.9431[/C][C]0.173472[/C][/ROW]
[ROW][C]42[/C][C]0.019937[/C][C]0.263[/C][C]0.396438[/C][/ROW]
[ROW][C]43[/C][C]0.05027[/C][C]0.6631[/C][C]0.25407[/C][/ROW]
[ROW][C]44[/C][C]0.066967[/C][C]0.8834[/C][C]0.189132[/C][/ROW]
[ROW][C]45[/C][C]0.087323[/C][C]1.1519[/C][C]0.125478[/C][/ROW]
[ROW][C]46[/C][C]0.069945[/C][C]0.9226[/C][C]0.178735[/C][/ROW]
[ROW][C]47[/C][C]0.104242[/C][C]1.375[/C][C]0.085442[/C][/ROW]
[ROW][C]48[/C][C]0.247195[/C][C]3.2607[/C][C]0.000669[/C][/ROW]
[/TABLE]
Source: https://freestatistics.org/blog/index.php?pk=75582&T=1

Globally Unique Identifier (entire table): ba.freestatistics.org/blog/index.php?pk=75582&T=1

As an alternative you can also use a QR Code:  

The GUIDs for individual cells are displayed in the table below:

Autocorrelation Function
Time lag kACF(k)T-STATP-value
10.5659277.46510
20.4445095.86350
30.4995126.5890
40.4517215.95860
50.4272725.63610
60.3627754.78532e-06
70.4028875.31440
80.41625.49010
90.4293295.66320
100.4075845.37640
110.4423275.83470
120.6431138.48320
130.3787144.99561e-06
140.3124454.12142.9e-05
150.3305344.361.1e-05
160.2977763.92796.2e-05
170.2831923.73560.000127
180.2260532.98180.001638
190.2270332.99480.001574
200.2311843.04950.001325
210.2449823.23150.000736
220.19852.61840.004807
230.257763.40010.000418
240.4516675.95790
250.2264052.98650.001615
260.1846682.43590.007931
270.21592.84790.002465
280.1805442.38150.00916
290.153882.02980.021949
300.0969711.27910.101276
310.1046081.37990.084698
320.129611.70970.044555
330.1574782.07730.019622
340.1107231.46050.072973
350.1757412.31820.010801
360.346424.56965e-06
370.1433581.8910.030142
380.099221.30880.096165
390.1321651.74340.041517
400.116431.53580.063199
410.0714950.94310.173472
420.0199370.2630.396438
430.050270.66310.25407
440.0669670.88340.189132
450.0873231.15190.125478
460.0699450.92260.178735
470.1042421.3750.085442
480.2471953.26070.000669


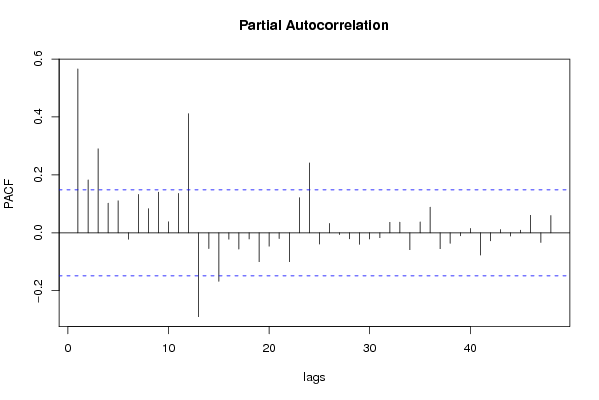
Partial Autocorrelation Function
Time lag kPACF(k)T-STATP-value
10.5659277.46510
20.1827732.41090.008476
30.2899373.82459.1e-05
40.1021121.34690.089875
50.1104151.45650.073532
6-0.021852-0.28820.386751
70.1325321.74820.041095
80.0833641.09970.136501
90.1403261.8510.03293
100.0381880.50370.307545
110.1359041.79270.03738
120.4114445.42730
13-0.289577-3.81989.3e-05
14-0.054329-0.71670.237274
15-0.167359-2.20760.014289
16-0.021983-0.290.38609
17-0.056037-0.73920.230397
18-0.021009-0.27710.391007
19-0.09985-1.31710.094767
20-0.046165-0.6090.271671
21-0.019961-0.26330.396313
22-0.099826-1.31680.094819
230.1211041.59750.055987
240.2411743.18130.000868
25-0.038753-0.51120.304935
260.032320.42630.335195
27-0.006275-0.08280.467066
28-0.020643-0.27230.392858
29-0.039658-0.52310.300777
30-0.021054-0.27770.39078
31-0.016995-0.22420.411439
320.0361630.4770.31697
330.0368530.48610.313744
34-0.058498-0.77160.220688
350.0374890.49450.310783
360.0886631.16950.121892
37-0.054956-0.72490.234736
38-0.036416-0.48040.315789
39-0.01055-0.13920.444739
400.0152360.2010.420478
41-0.076685-1.01150.156581
42-0.027673-0.3650.357767
430.0112140.14790.441285
44-0.011364-0.14990.440506
450.0090560.11950.452528
460.060480.79780.21304
47-0.03338-0.44030.330129
480.059390.78340.217228

\begin{tabular}{lllllllll}
\hline
Partial Autocorrelation Function \tabularnewline
Time lag k & PACF(k) & T-STAT & P-value \tabularnewline
1 & 0.565927 & 7.4651 & 0 \tabularnewline
2 & 0.182773 & 2.4109 & 0.008476 \tabularnewline
3 & 0.289937 & 3.8245 & 9.1e-05 \tabularnewline
4 & 0.102112 & 1.3469 & 0.089875 \tabularnewline
5 & 0.110415 & 1.4565 & 0.073532 \tabularnewline
6 & -0.021852 & -0.2882 & 0.386751 \tabularnewline
7 & 0.132532 & 1.7482 & 0.041095 \tabularnewline
8 & 0.083364 & 1.0997 & 0.136501 \tabularnewline
9 & 0.140326 & 1.851 & 0.03293 \tabularnewline
10 & 0.038188 & 0.5037 & 0.307545 \tabularnewline
11 & 0.135904 & 1.7927 & 0.03738 \tabularnewline
12 & 0.411444 & 5.4273 & 0 \tabularnewline
13 & -0.289577 & -3.8198 & 9.3e-05 \tabularnewline
14 & -0.054329 & -0.7167 & 0.237274 \tabularnewline
15 & -0.167359 & -2.2076 & 0.014289 \tabularnewline
16 & -0.021983 & -0.29 & 0.38609 \tabularnewline
17 & -0.056037 & -0.7392 & 0.230397 \tabularnewline
18 & -0.021009 & -0.2771 & 0.391007 \tabularnewline
19 & -0.09985 & -1.3171 & 0.094767 \tabularnewline
20 & -0.046165 & -0.609 & 0.271671 \tabularnewline
21 & -0.019961 & -0.2633 & 0.396313 \tabularnewline
22 & -0.099826 & -1.3168 & 0.094819 \tabularnewline
23 & 0.121104 & 1.5975 & 0.055987 \tabularnewline
24 & 0.241174 & 3.1813 & 0.000868 \tabularnewline
25 & -0.038753 & -0.5112 & 0.304935 \tabularnewline
26 & 0.03232 & 0.4263 & 0.335195 \tabularnewline
27 & -0.006275 & -0.0828 & 0.467066 \tabularnewline
28 & -0.020643 & -0.2723 & 0.392858 \tabularnewline
29 & -0.039658 & -0.5231 & 0.300777 \tabularnewline
30 & -0.021054 & -0.2777 & 0.39078 \tabularnewline
31 & -0.016995 & -0.2242 & 0.411439 \tabularnewline
32 & 0.036163 & 0.477 & 0.31697 \tabularnewline
33 & 0.036853 & 0.4861 & 0.313744 \tabularnewline
34 & -0.058498 & -0.7716 & 0.220688 \tabularnewline
35 & 0.037489 & 0.4945 & 0.310783 \tabularnewline
36 & 0.088663 & 1.1695 & 0.121892 \tabularnewline
37 & -0.054956 & -0.7249 & 0.234736 \tabularnewline
38 & -0.036416 & -0.4804 & 0.315789 \tabularnewline
39 & -0.01055 & -0.1392 & 0.444739 \tabularnewline
40 & 0.015236 & 0.201 & 0.420478 \tabularnewline
41 & -0.076685 & -1.0115 & 0.156581 \tabularnewline
42 & -0.027673 & -0.365 & 0.357767 \tabularnewline
43 & 0.011214 & 0.1479 & 0.441285 \tabularnewline
44 & -0.011364 & -0.1499 & 0.440506 \tabularnewline
45 & 0.009056 & 0.1195 & 0.452528 \tabularnewline
46 & 0.06048 & 0.7978 & 0.21304 \tabularnewline
47 & -0.03338 & -0.4403 & 0.330129 \tabularnewline
48 & 0.05939 & 0.7834 & 0.217228 \tabularnewline
\hline
\end{tabular}
%Source: https://freestatistics.org/blog/index.php?pk=75582&T=2

[TABLE]
[ROW][C]Partial Autocorrelation Function[/C][/ROW]
[ROW][C]Time lag k[/C][C]PACF(k)[/C][C]T-STAT[/C][C]P-value[/C][/ROW]
[ROW][C]1[/C][C]0.565927[/C][C]7.4651[/C][C]0[/C][/ROW]
[ROW][C]2[/C][C]0.182773[/C][C]2.4109[/C][C]0.008476[/C][/ROW]
[ROW][C]3[/C][C]0.289937[/C][C]3.8245[/C][C]9.1e-05[/C][/ROW]
[ROW][C]4[/C][C]0.102112[/C][C]1.3469[/C][C]0.089875[/C][/ROW]
[ROW][C]5[/C][C]0.110415[/C][C]1.4565[/C][C]0.073532[/C][/ROW]
[ROW][C]6[/C][C]-0.021852[/C][C]-0.2882[/C][C]0.386751[/C][/ROW]
[ROW][C]7[/C][C]0.132532[/C][C]1.7482[/C][C]0.041095[/C][/ROW]
[ROW][C]8[/C][C]0.083364[/C][C]1.0997[/C][C]0.136501[/C][/ROW]
[ROW][C]9[/C][C]0.140326[/C][C]1.851[/C][C]0.03293[/C][/ROW]
[ROW][C]10[/C][C]0.038188[/C][C]0.5037[/C][C]0.307545[/C][/ROW]
[ROW][C]11[/C][C]0.135904[/C][C]1.7927[/C][C]0.03738[/C][/ROW]
[ROW][C]12[/C][C]0.411444[/C][C]5.4273[/C][C]0[/C][/ROW]
[ROW][C]13[/C][C]-0.289577[/C][C]-3.8198[/C][C]9.3e-05[/C][/ROW]
[ROW][C]14[/C][C]-0.054329[/C][C]-0.7167[/C][C]0.237274[/C][/ROW]
[ROW][C]15[/C][C]-0.167359[/C][C]-2.2076[/C][C]0.014289[/C][/ROW]
[ROW][C]16[/C][C]-0.021983[/C][C]-0.29[/C][C]0.38609[/C][/ROW]
[ROW][C]17[/C][C]-0.056037[/C][C]-0.7392[/C][C]0.230397[/C][/ROW]
[ROW][C]18[/C][C]-0.021009[/C][C]-0.2771[/C][C]0.391007[/C][/ROW]
[ROW][C]19[/C][C]-0.09985[/C][C]-1.3171[/C][C]0.094767[/C][/ROW]
[ROW][C]20[/C][C]-0.046165[/C][C]-0.609[/C][C]0.271671[/C][/ROW]
[ROW][C]21[/C][C]-0.019961[/C][C]-0.2633[/C][C]0.396313[/C][/ROW]
[ROW][C]22[/C][C]-0.099826[/C][C]-1.3168[/C][C]0.094819[/C][/ROW]
[ROW][C]23[/C][C]0.121104[/C][C]1.5975[/C][C]0.055987[/C][/ROW]
[ROW][C]24[/C][C]0.241174[/C][C]3.1813[/C][C]0.000868[/C][/ROW]
[ROW][C]25[/C][C]-0.038753[/C][C]-0.5112[/C][C]0.304935[/C][/ROW]
[ROW][C]26[/C][C]0.03232[/C][C]0.4263[/C][C]0.335195[/C][/ROW]
[ROW][C]27[/C][C]-0.006275[/C][C]-0.0828[/C][C]0.467066[/C][/ROW]
[ROW][C]28[/C][C]-0.020643[/C][C]-0.2723[/C][C]0.392858[/C][/ROW]
[ROW][C]29[/C][C]-0.039658[/C][C]-0.5231[/C][C]0.300777[/C][/ROW]
[ROW][C]30[/C][C]-0.021054[/C][C]-0.2777[/C][C]0.39078[/C][/ROW]
[ROW][C]31[/C][C]-0.016995[/C][C]-0.2242[/C][C]0.411439[/C][/ROW]
[ROW][C]32[/C][C]0.036163[/C][C]0.477[/C][C]0.31697[/C][/ROW]
[ROW][C]33[/C][C]0.036853[/C][C]0.4861[/C][C]0.313744[/C][/ROW]
[ROW][C]34[/C][C]-0.058498[/C][C]-0.7716[/C][C]0.220688[/C][/ROW]
[ROW][C]35[/C][C]0.037489[/C][C]0.4945[/C][C]0.310783[/C][/ROW]
[ROW][C]36[/C][C]0.088663[/C][C]1.1695[/C][C]0.121892[/C][/ROW]
[ROW][C]37[/C][C]-0.054956[/C][C]-0.7249[/C][C]0.234736[/C][/ROW]
[ROW][C]38[/C][C]-0.036416[/C][C]-0.4804[/C][C]0.315789[/C][/ROW]
[ROW][C]39[/C][C]-0.01055[/C][C]-0.1392[/C][C]0.444739[/C][/ROW]
[ROW][C]40[/C][C]0.015236[/C][C]0.201[/C][C]0.420478[/C][/ROW]
[ROW][C]41[/C][C]-0.076685[/C][C]-1.0115[/C][C]0.156581[/C][/ROW]
[ROW][C]42[/C][C]-0.027673[/C][C]-0.365[/C][C]0.357767[/C][/ROW]
[ROW][C]43[/C][C]0.011214[/C][C]0.1479[/C][C]0.441285[/C][/ROW]
[ROW][C]44[/C][C]-0.011364[/C][C]-0.1499[/C][C]0.440506[/C][/ROW]
[ROW][C]45[/C][C]0.009056[/C][C]0.1195[/C][C]0.452528[/C][/ROW]
[ROW][C]46[/C][C]0.06048[/C][C]0.7978[/C][C]0.21304[/C][/ROW]
[ROW][C]47[/C][C]-0.03338[/C][C]-0.4403[/C][C]0.330129[/C][/ROW]
[ROW][C]48[/C][C]0.05939[/C][C]0.7834[/C][C]0.217228[/C][/ROW]
[/TABLE]
Source: https://freestatistics.org/blog/index.php?pk=75582&T=2

Globally Unique Identifier (entire table): ba.freestatistics.org/blog/index.php?pk=75582&T=2

As an alternative you can also use a QR Code:  

The GUIDs for individual cells are displayed in the table below:

Partial Autocorrelation Function
Time lag kPACF(k)T-STATP-value
10.5659277.46510
20.1827732.41090.008476
30.2899373.82459.1e-05
40.1021121.34690.089875
50.1104151.45650.073532
6-0.021852-0.28820.386751
70.1325321.74820.041095
80.0833641.09970.136501
90.1403261.8510.03293
100.0381880.50370.307545
110.1359041.79270.03738
120.4114445.42730
13-0.289577-3.81989.3e-05
14-0.054329-0.71670.237274
15-0.167359-2.20760.014289
16-0.021983-0.290.38609
17-0.056037-0.73920.230397
18-0.021009-0.27710.391007
19-0.09985-1.31710.094767
20-0.046165-0.6090.271671
21-0.019961-0.26330.396313
22-0.099826-1.31680.094819
230.1211041.59750.055987
240.2411743.18130.000868
25-0.038753-0.51120.304935
260.032320.42630.335195
27-0.006275-0.08280.467066
28-0.020643-0.27230.392858
29-0.039658-0.52310.300777
30-0.021054-0.27770.39078
31-0.016995-0.22420.411439
320.0361630.4770.31697
330.0368530.48610.313744
34-0.058498-0.77160.220688
350.0374890.49450.310783
360.0886631.16950.121892
37-0.054956-0.72490.234736
38-0.036416-0.48040.315789
39-0.01055-0.13920.444739
400.0152360.2010.420478
41-0.076685-1.01150.156581
42-0.027673-0.3650.357767
430.0112140.14790.441285
44-0.011364-0.14990.440506
450.0090560.11950.452528
460.060480.79780.21304
47-0.03338-0.44030.330129
480.059390.78340.217228


Parameters (Session):
par1 = 48 ; par2 = 1 ; par3 = 0 ; par4 = 0 ; par5 = 12 ; par6 = White Noise ; par7 = 0.95 ;
Parameters (R input):
par1 = 48 ; par2 = 1 ; par3 = 0 ; par4 = 0 ; par5 = 12 ; par6 = White Noise ; par7 = 0.95 ;
R code (references can be found in the software module):
if (par1 == 'Default') {
par1 = 10*log10(length(x))
} else {
par1 <- as.numeric(par1)
}
par2 <- as.numeric(par2)
par3 <- as.numeric(par3)
par4 <- as.numeric(par4)
par5 <- as.numeric(par5)
if (par6 == 'White Noise') par6 <- 'white' else par6 <- 'ma'
par7 <- as.numeric(par7)
if (par2 == 0) {
x <- log(x)
} else {
x <- (x ^ par2 - 1) / par2
}
if (par3 > 0) x <- diff(x,lag=1,difference=par3)
if (par4 > 0) x <- diff(x,lag=par5,difference=par4)
bitmap(file='pic1.png')
racf <- acf(x, par1, main='Autocorrelation', xlab='time lag', ylab='ACF', ci.type=par6, ci=par7, sub=paste('(lambda=',par2,', d=',par3,', D=',par4,', CI=', par7, ', CI type=',par6,')',sep=''))
dev.off()
bitmap(file='pic2.png')
rpacf <- pacf(x,par1,main='Partial Autocorrelation',xlab='lags',ylab='PACF')
dev.off()
(myacf <- c(racf$acf))
(mypacf <- c(rpacf$acf))
lengthx <- length(x)
sqrtn <- sqrt(lengthx)
load(file='createtable')
a<-table.start()
a<-table.row.start(a)
a<-table.element(a,'Autocorrelation Function',4,TRUE)
a<-table.row.end(a)
a<-table.row.start(a)
a<-table.element(a,'Time lag k',header=TRUE)
a<-table.element(a,hyperlink('basics.htm','ACF(k)','click here for more information about the Autocorrelation Function'),header=TRUE)
a<-table.element(a,'T-STAT',header=TRUE)
a<-table.element(a,'P-value',header=TRUE)
a<-table.row.end(a)
for (i in 2:(par1+1)) {
a<-table.row.start(a)
a<-table.element(a,i-1,header=TRUE)
a<-table.element(a,round(myacf[i],6))
mytstat <- myacf[i]*sqrtn
a<-table.element(a,round(mytstat,4))
a<-table.element(a,round(1-pt(abs(mytstat),lengthx),6))
a<-table.row.end(a)
}
a<-table.end(a)
table.save(a,file='mytable.tab')
a<-table.start()
a<-table.row.start(a)
a<-table.element(a,'Partial Autocorrelation Function',4,TRUE)
a<-table.row.end(a)
a<-table.row.start(a)
a<-table.element(a,'Time lag k',header=TRUE)
a<-table.element(a,hyperlink('basics.htm','PACF(k)','click here for more information about the Partial Autocorrelation Function'),header=TRUE)
a<-table.element(a,'T-STAT',header=TRUE)
a<-table.element(a,'P-value',header=TRUE)
a<-table.row.end(a)
for (i in 1:par1) {
a<-table.row.start(a)
a<-table.element(a,i,header=TRUE)
a<-table.element(a,round(mypacf[i],6))
mytstat <- mypacf[i]*sqrtn
a<-table.element(a,round(mytstat,4))
a<-table.element(a,round(1-pt(abs(mytstat),lengthx),6))
a<-table.row.end(a)
}
a<-table.end(a)
table.save(a,file='mytable1.tab')