Free Statistics

of Irreproducible Research!

Author's title

Author*Unverified author*
R Software Modulerwasp_autocorrelation.wasp
Title produced by software(Partial) Autocorrelation Function
Date of computationWed, 05 May 2010 21:43:40 +0000
Cite this page as followsStatistical Computations at FreeStatistics.org, Office for Research Development and Education, URL https://freestatistics.org/blog/index.php?v=date/2010/May/05/t1273095888gk7y5hb5481w7sq.htm/, Retrieved Sun, 28 Apr 2024 05:57:51 +0000
Statistical Computations at FreeStatistics.org, Office for Research Development and Education, URL https://freestatistics.org/blog/index.php?pk=75587, Retrieved Sun, 28 Apr 2024 05:57:51 +0000
QR Codes:

Original text written by user:Opgave6BIS eigen reeks: Goudkoers te brussel (2)
IsPrivate?No (this computation is public)
User-defined keywordsKDGP2W21
Estimated Impact127
Family? (F = Feedback message, R = changed R code, M = changed R Module, P = changed Parameters, D = changed Data)
-       [(Partial) Autocorrelation Function] [Opgave6BIS Goudko...] [2010-05-05 21:43:40] [52430d682409e27a0d0e07da361cea73] [Current]
Feedback Forum

Post a new message
Dataseries X:
23100
22650
22440
22910
22980
22535
22300
22780
22780
23300
23800
24510
24660
24730
25070
24690
24880
23920
23880
23990
24590
23610
23580
23360
23910
23940
23060
22800
23020
22890
22780
22530
22290
22820
22480
22110
22000
22230
22260
22590
22820
22420
22230
21600
21000
21360
21640
21450
21710
21620
21800
21490
21670
22130
22050
22050
22140
22390
22220
21790
21510
21670
21745
21850
22105
22050
21670
21680
21800
21920
21980
22270
21740
21950
22010
21890
21920
22110
22340
22210
22240
21960
22220
22060
22090
21960
21940
21790
21710
21690
21710
21670
21640
21500
21290
21250
21580
21670
21620
21510
21360
21420
21470
21370
21370
21340
21130
21130
20990
21240
21320
21430
21390
21530
21510
21630
21560
21610
21560
21310
21340
21410
21550
21380
21600
21530
21560
21670
21540
21540
21550
21590
21420
21420
21370
21380
21210
21505
21365
21385
21350
21360
21530
21380
21630
22145
22315
22340
22440
22135
21955
22060
22050
22035
22280
22315
22205
21970
22075
22115
22105
21885
21805
21910
21995
22245
22100
22130
22300
22915
23040
22880
23000
23160
23020
22770
22660
22740
22905
22720
22705
22735
22600
22510
22560
22575
22685
22980
23275
23845
23640
23640
23835
23625
24055
24005
24325
24445
24670
24615
24700
25065
25185
25220
25235
24975
25055
25520
25880
25960
25740
24965
25235
24895
24635
24835
24635
24695
25090
25220
24740
25005
24650
24460
24680
24840
24630
24490
24695


Summary of computational transaction
Raw Inputview raw input (R code)
Raw Outputview raw output of R engine
Computing time1 seconds
R Server'Gwilym Jenkins' @ 72.249.127.135

\begin{tabular}{lllllllll}
\hline
Summary of computational transaction \tabularnewline
Raw Input & view raw input (R code)  \tabularnewline
Raw Output & view raw output of R engine  \tabularnewline
Computing time & 1 seconds \tabularnewline
R Server & 'Gwilym Jenkins' @ 72.249.127.135 \tabularnewline
\hline
\end{tabular}
%Source: https://freestatistics.org/blog/index.php?pk=75587&T=0

[TABLE]
[ROW][C]Summary of computational transaction[/C][/ROW]
[ROW][C]Raw Input[/C][C]view raw input (R code) [/C][/ROW]
[ROW][C]Raw Output[/C][C]view raw output of R engine [/C][/ROW]
[ROW][C]Computing time[/C][C]1 seconds[/C][/ROW]
[ROW][C]R Server[/C][C]'Gwilym Jenkins' @ 72.249.127.135[/C][/ROW]
[/TABLE]
Source: https://freestatistics.org/blog/index.php?pk=75587&T=0

Globally Unique Identifier (entire table): ba.freestatistics.org/blog/index.php?pk=75587&T=0

As an alternative you can also use a QR Code:  

The GUIDs for individual cells are displayed in the table below:

Summary of computational transaction
Raw Inputview raw input (R code)
Raw Outputview raw output of R engine
Computing time1 seconds
R Server'Gwilym Jenkins' @ 72.249.127.135


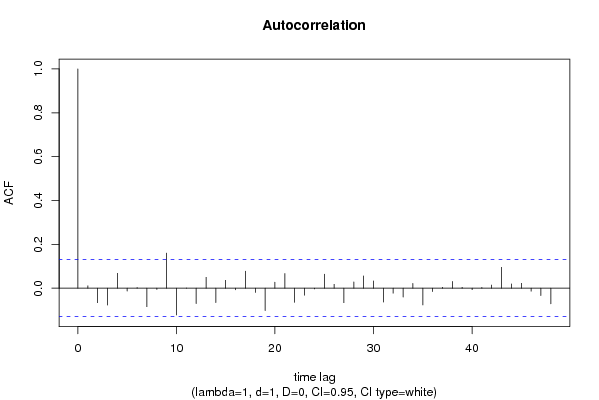
Autocorrelation Function
Time lag kACF(k)T-STATP-value
10.0109490.16530.434418
2-0.065927-0.99550.16028
3-0.077122-1.16450.122717
40.0680971.02820.152464
5-0.013165-0.19880.421306
60.0030130.04550.481877
7-0.08435-1.27370.102042
8-0.005597-0.08450.46636
90.1599672.41540.008252
10-0.121923-1.8410.03346
110.0006570.00990.496046
12-0.069961-1.05640.145954
130.0499350.7540.225815
14-0.065733-0.99250.160992
150.0358840.54180.294231
16-0.007657-0.11560.45403
170.0778121.17490.120623
18-0.019171-0.28950.386241
19-0.10206-1.54110.062342
200.0272230.41110.34071
210.0667041.00720.157452
22-0.064357-0.97180.166099
23-0.032077-0.48430.314303
24-0.003162-0.04770.480982
250.0637380.96240.168429
260.0175430.26490.395663
27-0.065825-0.99390.160654
280.0287950.43480.332061
290.0561640.84810.198647
300.0333440.50350.307555
31-0.063317-0.95610.170025
32-0.022978-0.3470.364469
33-0.040511-0.61170.27067
340.0216280.32660.372141
35-0.076143-1.14970.125728
36-0.015269-0.23060.408932
370.004120.06220.475223
380.0306970.46350.321716
390.004220.06370.474627
40-0.006619-0.09990.460236
410.0034320.05180.479358
420.014330.21640.414446
430.095291.43880.075784
440.0192610.29080.385722
450.0223970.33820.367769
46-0.0136-0.20530.418741
47-0.03348-0.50550.306835
48-0.071011-1.07220.142371

\begin{tabular}{lllllllll}
\hline
Autocorrelation Function \tabularnewline
Time lag k & ACF(k) & T-STAT & P-value \tabularnewline
1 & 0.010949 & 0.1653 & 0.434418 \tabularnewline
2 & -0.065927 & -0.9955 & 0.16028 \tabularnewline
3 & -0.077122 & -1.1645 & 0.122717 \tabularnewline
4 & 0.068097 & 1.0282 & 0.152464 \tabularnewline
5 & -0.013165 & -0.1988 & 0.421306 \tabularnewline
6 & 0.003013 & 0.0455 & 0.481877 \tabularnewline
7 & -0.08435 & -1.2737 & 0.102042 \tabularnewline
8 & -0.005597 & -0.0845 & 0.46636 \tabularnewline
9 & 0.159967 & 2.4154 & 0.008252 \tabularnewline
10 & -0.121923 & -1.841 & 0.03346 \tabularnewline
11 & 0.000657 & 0.0099 & 0.496046 \tabularnewline
12 & -0.069961 & -1.0564 & 0.145954 \tabularnewline
13 & 0.049935 & 0.754 & 0.225815 \tabularnewline
14 & -0.065733 & -0.9925 & 0.160992 \tabularnewline
15 & 0.035884 & 0.5418 & 0.294231 \tabularnewline
16 & -0.007657 & -0.1156 & 0.45403 \tabularnewline
17 & 0.077812 & 1.1749 & 0.120623 \tabularnewline
18 & -0.019171 & -0.2895 & 0.386241 \tabularnewline
19 & -0.10206 & -1.5411 & 0.062342 \tabularnewline
20 & 0.027223 & 0.4111 & 0.34071 \tabularnewline
21 & 0.066704 & 1.0072 & 0.157452 \tabularnewline
22 & -0.064357 & -0.9718 & 0.166099 \tabularnewline
23 & -0.032077 & -0.4843 & 0.314303 \tabularnewline
24 & -0.003162 & -0.0477 & 0.480982 \tabularnewline
25 & 0.063738 & 0.9624 & 0.168429 \tabularnewline
26 & 0.017543 & 0.2649 & 0.395663 \tabularnewline
27 & -0.065825 & -0.9939 & 0.160654 \tabularnewline
28 & 0.028795 & 0.4348 & 0.332061 \tabularnewline
29 & 0.056164 & 0.8481 & 0.198647 \tabularnewline
30 & 0.033344 & 0.5035 & 0.307555 \tabularnewline
31 & -0.063317 & -0.9561 & 0.170025 \tabularnewline
32 & -0.022978 & -0.347 & 0.364469 \tabularnewline
33 & -0.040511 & -0.6117 & 0.27067 \tabularnewline
34 & 0.021628 & 0.3266 & 0.372141 \tabularnewline
35 & -0.076143 & -1.1497 & 0.125728 \tabularnewline
36 & -0.015269 & -0.2306 & 0.408932 \tabularnewline
37 & 0.00412 & 0.0622 & 0.475223 \tabularnewline
38 & 0.030697 & 0.4635 & 0.321716 \tabularnewline
39 & 0.00422 & 0.0637 & 0.474627 \tabularnewline
40 & -0.006619 & -0.0999 & 0.460236 \tabularnewline
41 & 0.003432 & 0.0518 & 0.479358 \tabularnewline
42 & 0.01433 & 0.2164 & 0.414446 \tabularnewline
43 & 0.09529 & 1.4388 & 0.075784 \tabularnewline
44 & 0.019261 & 0.2908 & 0.385722 \tabularnewline
45 & 0.022397 & 0.3382 & 0.367769 \tabularnewline
46 & -0.0136 & -0.2053 & 0.418741 \tabularnewline
47 & -0.03348 & -0.5055 & 0.306835 \tabularnewline
48 & -0.071011 & -1.0722 & 0.142371 \tabularnewline
\hline
\end{tabular}
%Source: https://freestatistics.org/blog/index.php?pk=75587&T=1

[TABLE]
[ROW][C]Autocorrelation Function[/C][/ROW]
[ROW][C]Time lag k[/C][C]ACF(k)[/C][C]T-STAT[/C][C]P-value[/C][/ROW]
[ROW][C]1[/C][C]0.010949[/C][C]0.1653[/C][C]0.434418[/C][/ROW]
[ROW][C]2[/C][C]-0.065927[/C][C]-0.9955[/C][C]0.16028[/C][/ROW]
[ROW][C]3[/C][C]-0.077122[/C][C]-1.1645[/C][C]0.122717[/C][/ROW]
[ROW][C]4[/C][C]0.068097[/C][C]1.0282[/C][C]0.152464[/C][/ROW]
[ROW][C]5[/C][C]-0.013165[/C][C]-0.1988[/C][C]0.421306[/C][/ROW]
[ROW][C]6[/C][C]0.003013[/C][C]0.0455[/C][C]0.481877[/C][/ROW]
[ROW][C]7[/C][C]-0.08435[/C][C]-1.2737[/C][C]0.102042[/C][/ROW]
[ROW][C]8[/C][C]-0.005597[/C][C]-0.0845[/C][C]0.46636[/C][/ROW]
[ROW][C]9[/C][C]0.159967[/C][C]2.4154[/C][C]0.008252[/C][/ROW]
[ROW][C]10[/C][C]-0.121923[/C][C]-1.841[/C][C]0.03346[/C][/ROW]
[ROW][C]11[/C][C]0.000657[/C][C]0.0099[/C][C]0.496046[/C][/ROW]
[ROW][C]12[/C][C]-0.069961[/C][C]-1.0564[/C][C]0.145954[/C][/ROW]
[ROW][C]13[/C][C]0.049935[/C][C]0.754[/C][C]0.225815[/C][/ROW]
[ROW][C]14[/C][C]-0.065733[/C][C]-0.9925[/C][C]0.160992[/C][/ROW]
[ROW][C]15[/C][C]0.035884[/C][C]0.5418[/C][C]0.294231[/C][/ROW]
[ROW][C]16[/C][C]-0.007657[/C][C]-0.1156[/C][C]0.45403[/C][/ROW]
[ROW][C]17[/C][C]0.077812[/C][C]1.1749[/C][C]0.120623[/C][/ROW]
[ROW][C]18[/C][C]-0.019171[/C][C]-0.2895[/C][C]0.386241[/C][/ROW]
[ROW][C]19[/C][C]-0.10206[/C][C]-1.5411[/C][C]0.062342[/C][/ROW]
[ROW][C]20[/C][C]0.027223[/C][C]0.4111[/C][C]0.34071[/C][/ROW]
[ROW][C]21[/C][C]0.066704[/C][C]1.0072[/C][C]0.157452[/C][/ROW]
[ROW][C]22[/C][C]-0.064357[/C][C]-0.9718[/C][C]0.166099[/C][/ROW]
[ROW][C]23[/C][C]-0.032077[/C][C]-0.4843[/C][C]0.314303[/C][/ROW]
[ROW][C]24[/C][C]-0.003162[/C][C]-0.0477[/C][C]0.480982[/C][/ROW]
[ROW][C]25[/C][C]0.063738[/C][C]0.9624[/C][C]0.168429[/C][/ROW]
[ROW][C]26[/C][C]0.017543[/C][C]0.2649[/C][C]0.395663[/C][/ROW]
[ROW][C]27[/C][C]-0.065825[/C][C]-0.9939[/C][C]0.160654[/C][/ROW]
[ROW][C]28[/C][C]0.028795[/C][C]0.4348[/C][C]0.332061[/C][/ROW]
[ROW][C]29[/C][C]0.056164[/C][C]0.8481[/C][C]0.198647[/C][/ROW]
[ROW][C]30[/C][C]0.033344[/C][C]0.5035[/C][C]0.307555[/C][/ROW]
[ROW][C]31[/C][C]-0.063317[/C][C]-0.9561[/C][C]0.170025[/C][/ROW]
[ROW][C]32[/C][C]-0.022978[/C][C]-0.347[/C][C]0.364469[/C][/ROW]
[ROW][C]33[/C][C]-0.040511[/C][C]-0.6117[/C][C]0.27067[/C][/ROW]
[ROW][C]34[/C][C]0.021628[/C][C]0.3266[/C][C]0.372141[/C][/ROW]
[ROW][C]35[/C][C]-0.076143[/C][C]-1.1497[/C][C]0.125728[/C][/ROW]
[ROW][C]36[/C][C]-0.015269[/C][C]-0.2306[/C][C]0.408932[/C][/ROW]
[ROW][C]37[/C][C]0.00412[/C][C]0.0622[/C][C]0.475223[/C][/ROW]
[ROW][C]38[/C][C]0.030697[/C][C]0.4635[/C][C]0.321716[/C][/ROW]
[ROW][C]39[/C][C]0.00422[/C][C]0.0637[/C][C]0.474627[/C][/ROW]
[ROW][C]40[/C][C]-0.006619[/C][C]-0.0999[/C][C]0.460236[/C][/ROW]
[ROW][C]41[/C][C]0.003432[/C][C]0.0518[/C][C]0.479358[/C][/ROW]
[ROW][C]42[/C][C]0.01433[/C][C]0.2164[/C][C]0.414446[/C][/ROW]
[ROW][C]43[/C][C]0.09529[/C][C]1.4388[/C][C]0.075784[/C][/ROW]
[ROW][C]44[/C][C]0.019261[/C][C]0.2908[/C][C]0.385722[/C][/ROW]
[ROW][C]45[/C][C]0.022397[/C][C]0.3382[/C][C]0.367769[/C][/ROW]
[ROW][C]46[/C][C]-0.0136[/C][C]-0.2053[/C][C]0.418741[/C][/ROW]
[ROW][C]47[/C][C]-0.03348[/C][C]-0.5055[/C][C]0.306835[/C][/ROW]
[ROW][C]48[/C][C]-0.071011[/C][C]-1.0722[/C][C]0.142371[/C][/ROW]
[/TABLE]
Source: https://freestatistics.org/blog/index.php?pk=75587&T=1

Globally Unique Identifier (entire table): ba.freestatistics.org/blog/index.php?pk=75587&T=1

As an alternative you can also use a QR Code:  

The GUIDs for individual cells are displayed in the table below:

Autocorrelation Function
Time lag kACF(k)T-STATP-value
10.0109490.16530.434418
2-0.065927-0.99550.16028
3-0.077122-1.16450.122717
40.0680971.02820.152464
5-0.013165-0.19880.421306
60.0030130.04550.481877
7-0.08435-1.27370.102042
8-0.005597-0.08450.46636
90.1599672.41540.008252
10-0.121923-1.8410.03346
110.0006570.00990.496046
12-0.069961-1.05640.145954
130.0499350.7540.225815
14-0.065733-0.99250.160992
150.0358840.54180.294231
16-0.007657-0.11560.45403
170.0778121.17490.120623
18-0.019171-0.28950.386241
19-0.10206-1.54110.062342
200.0272230.41110.34071
210.0667041.00720.157452
22-0.064357-0.97180.166099
23-0.032077-0.48430.314303
24-0.003162-0.04770.480982
250.0637380.96240.168429
260.0175430.26490.395663
27-0.065825-0.99390.160654
280.0287950.43480.332061
290.0561640.84810.198647
300.0333440.50350.307555
31-0.063317-0.95610.170025
32-0.022978-0.3470.364469
33-0.040511-0.61170.27067
340.0216280.32660.372141
35-0.076143-1.14970.125728
36-0.015269-0.23060.408932
370.004120.06220.475223
380.0306970.46350.321716
390.004220.06370.474627
40-0.006619-0.09990.460236
410.0034320.05180.479358
420.014330.21640.414446
430.095291.43880.075784
440.0192610.29080.385722
450.0223970.33820.367769
46-0.0136-0.20530.418741
47-0.03348-0.50550.306835
48-0.071011-1.07220.142371


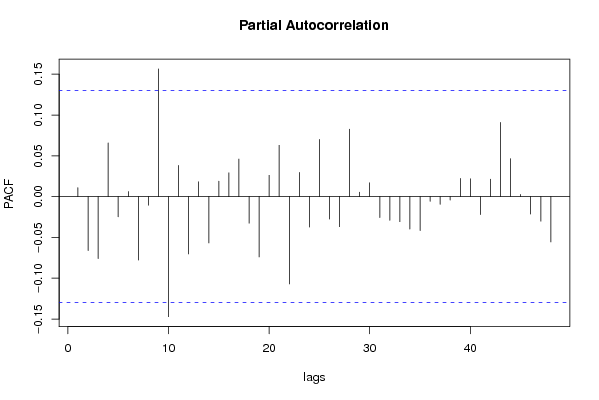
Partial Autocorrelation Function
Time lag kPACF(k)T-STATP-value
10.0109490.16530.434418
2-0.066055-0.99740.159813
3-0.075969-1.14710.126269
40.0658180.99380.160678
5-0.024771-0.3740.354365
60.0061760.09330.46289
7-0.077705-1.17330.120947
8-0.010487-0.15830.437162
90.1564812.36280.009489
10-0.147114-2.22140.013654
110.0381750.57640.282448
12-0.070257-1.06090.144939
130.0181490.2740.39215
14-0.056746-0.85690.196214
150.0189930.28680.38727
160.0292590.44180.329528
170.0460430.69520.243806
18-0.032558-0.49160.311735
19-0.073938-1.11640.132706
200.0261130.39430.346866
210.0629070.94990.171592
22-0.106968-1.61520.053827
230.0296590.44780.327345
24-0.037369-0.56430.286567
250.0701591.05940.145274
26-0.02752-0.41550.339069
27-0.036932-0.55770.288812
280.0826641.24820.106618
290.0054980.0830.466955
300.0169760.25630.398964
31-0.025705-0.38810.349137
32-0.029011-0.4380.330882
33-0.030802-0.46510.321154
34-0.039708-0.59960.27469
35-0.041674-0.62930.264904
36-0.005695-0.0860.465771
37-0.009411-0.14210.443561
38-0.004148-0.06260.475059
390.0223450.33740.368062
400.0218290.32960.370999
41-0.022012-0.33240.369959
420.0213440.32230.373764
430.0908751.37220.085677
440.0464470.70130.241906
450.0027430.04140.483497
46-0.021373-0.32270.373602
47-0.030174-0.45560.324547
48-0.055572-0.83910.201139

\begin{tabular}{lllllllll}
\hline
Partial Autocorrelation Function \tabularnewline
Time lag k & PACF(k) & T-STAT & P-value \tabularnewline
1 & 0.010949 & 0.1653 & 0.434418 \tabularnewline
2 & -0.066055 & -0.9974 & 0.159813 \tabularnewline
3 & -0.075969 & -1.1471 & 0.126269 \tabularnewline
4 & 0.065818 & 0.9938 & 0.160678 \tabularnewline
5 & -0.024771 & -0.374 & 0.354365 \tabularnewline
6 & 0.006176 & 0.0933 & 0.46289 \tabularnewline
7 & -0.077705 & -1.1733 & 0.120947 \tabularnewline
8 & -0.010487 & -0.1583 & 0.437162 \tabularnewline
9 & 0.156481 & 2.3628 & 0.009489 \tabularnewline
10 & -0.147114 & -2.2214 & 0.013654 \tabularnewline
11 & 0.038175 & 0.5764 & 0.282448 \tabularnewline
12 & -0.070257 & -1.0609 & 0.144939 \tabularnewline
13 & 0.018149 & 0.274 & 0.39215 \tabularnewline
14 & -0.056746 & -0.8569 & 0.196214 \tabularnewline
15 & 0.018993 & 0.2868 & 0.38727 \tabularnewline
16 & 0.029259 & 0.4418 & 0.329528 \tabularnewline
17 & 0.046043 & 0.6952 & 0.243806 \tabularnewline
18 & -0.032558 & -0.4916 & 0.311735 \tabularnewline
19 & -0.073938 & -1.1164 & 0.132706 \tabularnewline
20 & 0.026113 & 0.3943 & 0.346866 \tabularnewline
21 & 0.062907 & 0.9499 & 0.171592 \tabularnewline
22 & -0.106968 & -1.6152 & 0.053827 \tabularnewline
23 & 0.029659 & 0.4478 & 0.327345 \tabularnewline
24 & -0.037369 & -0.5643 & 0.286567 \tabularnewline
25 & 0.070159 & 1.0594 & 0.145274 \tabularnewline
26 & -0.02752 & -0.4155 & 0.339069 \tabularnewline
27 & -0.036932 & -0.5577 & 0.288812 \tabularnewline
28 & 0.082664 & 1.2482 & 0.106618 \tabularnewline
29 & 0.005498 & 0.083 & 0.466955 \tabularnewline
30 & 0.016976 & 0.2563 & 0.398964 \tabularnewline
31 & -0.025705 & -0.3881 & 0.349137 \tabularnewline
32 & -0.029011 & -0.438 & 0.330882 \tabularnewline
33 & -0.030802 & -0.4651 & 0.321154 \tabularnewline
34 & -0.039708 & -0.5996 & 0.27469 \tabularnewline
35 & -0.041674 & -0.6293 & 0.264904 \tabularnewline
36 & -0.005695 & -0.086 & 0.465771 \tabularnewline
37 & -0.009411 & -0.1421 & 0.443561 \tabularnewline
38 & -0.004148 & -0.0626 & 0.475059 \tabularnewline
39 & 0.022345 & 0.3374 & 0.368062 \tabularnewline
40 & 0.021829 & 0.3296 & 0.370999 \tabularnewline
41 & -0.022012 & -0.3324 & 0.369959 \tabularnewline
42 & 0.021344 & 0.3223 & 0.373764 \tabularnewline
43 & 0.090875 & 1.3722 & 0.085677 \tabularnewline
44 & 0.046447 & 0.7013 & 0.241906 \tabularnewline
45 & 0.002743 & 0.0414 & 0.483497 \tabularnewline
46 & -0.021373 & -0.3227 & 0.373602 \tabularnewline
47 & -0.030174 & -0.4556 & 0.324547 \tabularnewline
48 & -0.055572 & -0.8391 & 0.201139 \tabularnewline
\hline
\end{tabular}
%Source: https://freestatistics.org/blog/index.php?pk=75587&T=2

[TABLE]
[ROW][C]Partial Autocorrelation Function[/C][/ROW]
[ROW][C]Time lag k[/C][C]PACF(k)[/C][C]T-STAT[/C][C]P-value[/C][/ROW]
[ROW][C]1[/C][C]0.010949[/C][C]0.1653[/C][C]0.434418[/C][/ROW]
[ROW][C]2[/C][C]-0.066055[/C][C]-0.9974[/C][C]0.159813[/C][/ROW]
[ROW][C]3[/C][C]-0.075969[/C][C]-1.1471[/C][C]0.126269[/C][/ROW]
[ROW][C]4[/C][C]0.065818[/C][C]0.9938[/C][C]0.160678[/C][/ROW]
[ROW][C]5[/C][C]-0.024771[/C][C]-0.374[/C][C]0.354365[/C][/ROW]
[ROW][C]6[/C][C]0.006176[/C][C]0.0933[/C][C]0.46289[/C][/ROW]
[ROW][C]7[/C][C]-0.077705[/C][C]-1.1733[/C][C]0.120947[/C][/ROW]
[ROW][C]8[/C][C]-0.010487[/C][C]-0.1583[/C][C]0.437162[/C][/ROW]
[ROW][C]9[/C][C]0.156481[/C][C]2.3628[/C][C]0.009489[/C][/ROW]
[ROW][C]10[/C][C]-0.147114[/C][C]-2.2214[/C][C]0.013654[/C][/ROW]
[ROW][C]11[/C][C]0.038175[/C][C]0.5764[/C][C]0.282448[/C][/ROW]
[ROW][C]12[/C][C]-0.070257[/C][C]-1.0609[/C][C]0.144939[/C][/ROW]
[ROW][C]13[/C][C]0.018149[/C][C]0.274[/C][C]0.39215[/C][/ROW]
[ROW][C]14[/C][C]-0.056746[/C][C]-0.8569[/C][C]0.196214[/C][/ROW]
[ROW][C]15[/C][C]0.018993[/C][C]0.2868[/C][C]0.38727[/C][/ROW]
[ROW][C]16[/C][C]0.029259[/C][C]0.4418[/C][C]0.329528[/C][/ROW]
[ROW][C]17[/C][C]0.046043[/C][C]0.6952[/C][C]0.243806[/C][/ROW]
[ROW][C]18[/C][C]-0.032558[/C][C]-0.4916[/C][C]0.311735[/C][/ROW]
[ROW][C]19[/C][C]-0.073938[/C][C]-1.1164[/C][C]0.132706[/C][/ROW]
[ROW][C]20[/C][C]0.026113[/C][C]0.3943[/C][C]0.346866[/C][/ROW]
[ROW][C]21[/C][C]0.062907[/C][C]0.9499[/C][C]0.171592[/C][/ROW]
[ROW][C]22[/C][C]-0.106968[/C][C]-1.6152[/C][C]0.053827[/C][/ROW]
[ROW][C]23[/C][C]0.029659[/C][C]0.4478[/C][C]0.327345[/C][/ROW]
[ROW][C]24[/C][C]-0.037369[/C][C]-0.5643[/C][C]0.286567[/C][/ROW]
[ROW][C]25[/C][C]0.070159[/C][C]1.0594[/C][C]0.145274[/C][/ROW]
[ROW][C]26[/C][C]-0.02752[/C][C]-0.4155[/C][C]0.339069[/C][/ROW]
[ROW][C]27[/C][C]-0.036932[/C][C]-0.5577[/C][C]0.288812[/C][/ROW]
[ROW][C]28[/C][C]0.082664[/C][C]1.2482[/C][C]0.106618[/C][/ROW]
[ROW][C]29[/C][C]0.005498[/C][C]0.083[/C][C]0.466955[/C][/ROW]
[ROW][C]30[/C][C]0.016976[/C][C]0.2563[/C][C]0.398964[/C][/ROW]
[ROW][C]31[/C][C]-0.025705[/C][C]-0.3881[/C][C]0.349137[/C][/ROW]
[ROW][C]32[/C][C]-0.029011[/C][C]-0.438[/C][C]0.330882[/C][/ROW]
[ROW][C]33[/C][C]-0.030802[/C][C]-0.4651[/C][C]0.321154[/C][/ROW]
[ROW][C]34[/C][C]-0.039708[/C][C]-0.5996[/C][C]0.27469[/C][/ROW]
[ROW][C]35[/C][C]-0.041674[/C][C]-0.6293[/C][C]0.264904[/C][/ROW]
[ROW][C]36[/C][C]-0.005695[/C][C]-0.086[/C][C]0.465771[/C][/ROW]
[ROW][C]37[/C][C]-0.009411[/C][C]-0.1421[/C][C]0.443561[/C][/ROW]
[ROW][C]38[/C][C]-0.004148[/C][C]-0.0626[/C][C]0.475059[/C][/ROW]
[ROW][C]39[/C][C]0.022345[/C][C]0.3374[/C][C]0.368062[/C][/ROW]
[ROW][C]40[/C][C]0.021829[/C][C]0.3296[/C][C]0.370999[/C][/ROW]
[ROW][C]41[/C][C]-0.022012[/C][C]-0.3324[/C][C]0.369959[/C][/ROW]
[ROW][C]42[/C][C]0.021344[/C][C]0.3223[/C][C]0.373764[/C][/ROW]
[ROW][C]43[/C][C]0.090875[/C][C]1.3722[/C][C]0.085677[/C][/ROW]
[ROW][C]44[/C][C]0.046447[/C][C]0.7013[/C][C]0.241906[/C][/ROW]
[ROW][C]45[/C][C]0.002743[/C][C]0.0414[/C][C]0.483497[/C][/ROW]
[ROW][C]46[/C][C]-0.021373[/C][C]-0.3227[/C][C]0.373602[/C][/ROW]
[ROW][C]47[/C][C]-0.030174[/C][C]-0.4556[/C][C]0.324547[/C][/ROW]
[ROW][C]48[/C][C]-0.055572[/C][C]-0.8391[/C][C]0.201139[/C][/ROW]
[/TABLE]
Source: https://freestatistics.org/blog/index.php?pk=75587&T=2

Globally Unique Identifier (entire table): ba.freestatistics.org/blog/index.php?pk=75587&T=2

As an alternative you can also use a QR Code:  

The GUIDs for individual cells are displayed in the table below:

Partial Autocorrelation Function
Time lag kPACF(k)T-STATP-value
10.0109490.16530.434418
2-0.066055-0.99740.159813
3-0.075969-1.14710.126269
40.0658180.99380.160678
5-0.024771-0.3740.354365
60.0061760.09330.46289
7-0.077705-1.17330.120947
8-0.010487-0.15830.437162
90.1564812.36280.009489
10-0.147114-2.22140.013654
110.0381750.57640.282448
12-0.070257-1.06090.144939
130.0181490.2740.39215
14-0.056746-0.85690.196214
150.0189930.28680.38727
160.0292590.44180.329528
170.0460430.69520.243806
18-0.032558-0.49160.311735
19-0.073938-1.11640.132706
200.0261130.39430.346866
210.0629070.94990.171592
22-0.106968-1.61520.053827
230.0296590.44780.327345
24-0.037369-0.56430.286567
250.0701591.05940.145274
26-0.02752-0.41550.339069
27-0.036932-0.55770.288812
280.0826641.24820.106618
290.0054980.0830.466955
300.0169760.25630.398964
31-0.025705-0.38810.349137
32-0.029011-0.4380.330882
33-0.030802-0.46510.321154
34-0.039708-0.59960.27469
35-0.041674-0.62930.264904
36-0.005695-0.0860.465771
37-0.009411-0.14210.443561
38-0.004148-0.06260.475059
390.0223450.33740.368062
400.0218290.32960.370999
41-0.022012-0.33240.369959
420.0213440.32230.373764
430.0908751.37220.085677
440.0464470.70130.241906
450.0027430.04140.483497
46-0.021373-0.32270.373602
47-0.030174-0.45560.324547
48-0.055572-0.83910.201139


Parameters (Session):
par1 = 48 ; par2 = 1 ; par3 = 1 ; par4 = 0 ; par5 = 12 ; par6 = White Noise ; par7 = 0.95 ;
Parameters (R input):
par1 = 48 ; par2 = 1 ; par3 = 1 ; par4 = 0 ; par5 = 12 ; par6 = White Noise ; par7 = 0.95 ;
R code (references can be found in the software module):
if (par1 == 'Default') {
par1 = 10*log10(length(x))
} else {
par1 <- as.numeric(par1)
}
par2 <- as.numeric(par2)
par3 <- as.numeric(par3)
par4 <- as.numeric(par4)
par5 <- as.numeric(par5)
if (par6 == 'White Noise') par6 <- 'white' else par6 <- 'ma'
par7 <- as.numeric(par7)
if (par2 == 0) {
x <- log(x)
} else {
x <- (x ^ par2 - 1) / par2
}
if (par3 > 0) x <- diff(x,lag=1,difference=par3)
if (par4 > 0) x <- diff(x,lag=par5,difference=par4)
bitmap(file='pic1.png')
racf <- acf(x, par1, main='Autocorrelation', xlab='time lag', ylab='ACF', ci.type=par6, ci=par7, sub=paste('(lambda=',par2,', d=',par3,', D=',par4,', CI=', par7, ', CI type=',par6,')',sep=''))
dev.off()
bitmap(file='pic2.png')
rpacf <- pacf(x,par1,main='Partial Autocorrelation',xlab='lags',ylab='PACF')
dev.off()
(myacf <- c(racf$acf))
(mypacf <- c(rpacf$acf))
lengthx <- length(x)
sqrtn <- sqrt(lengthx)
load(file='createtable')
a<-table.start()
a<-table.row.start(a)
a<-table.element(a,'Autocorrelation Function',4,TRUE)
a<-table.row.end(a)
a<-table.row.start(a)
a<-table.element(a,'Time lag k',header=TRUE)
a<-table.element(a,hyperlink('basics.htm','ACF(k)','click here for more information about the Autocorrelation Function'),header=TRUE)
a<-table.element(a,'T-STAT',header=TRUE)
a<-table.element(a,'P-value',header=TRUE)
a<-table.row.end(a)
for (i in 2:(par1+1)) {
a<-table.row.start(a)
a<-table.element(a,i-1,header=TRUE)
a<-table.element(a,round(myacf[i],6))
mytstat <- myacf[i]*sqrtn
a<-table.element(a,round(mytstat,4))
a<-table.element(a,round(1-pt(abs(mytstat),lengthx),6))
a<-table.row.end(a)
}
a<-table.end(a)
table.save(a,file='mytable.tab')
a<-table.start()
a<-table.row.start(a)
a<-table.element(a,'Partial Autocorrelation Function',4,TRUE)
a<-table.row.end(a)
a<-table.row.start(a)
a<-table.element(a,'Time lag k',header=TRUE)
a<-table.element(a,hyperlink('basics.htm','PACF(k)','click here for more information about the Partial Autocorrelation Function'),header=TRUE)
a<-table.element(a,'T-STAT',header=TRUE)
a<-table.element(a,'P-value',header=TRUE)
a<-table.row.end(a)
for (i in 1:par1) {
a<-table.row.start(a)
a<-table.element(a,i,header=TRUE)
a<-table.element(a,round(mypacf[i],6))
mytstat <- mypacf[i]*sqrtn
a<-table.element(a,round(mytstat,4))
a<-table.element(a,round(1-pt(abs(mytstat),lengthx),6))
a<-table.row.end(a)
}
a<-table.end(a)
table.save(a,file='mytable1.tab')