Free Statistics

of Irreproducible Research!

Author's title

Author*Unverified author*
R Software Modulerwasp_autocorrelation.wasp
Title produced by software(Partial) Autocorrelation Function
Date of computationWed, 05 May 2010 21:57:04 +0000
Cite this page as followsStatistical Computations at FreeStatistics.org, Office for Research Development and Education, URL https://freestatistics.org/blog/index.php?v=date/2010/May/05/t1273096732v34x4ynv6wpwor8.htm/, Retrieved Sun, 28 Apr 2024 12:40:59 +0000
Statistical Computations at FreeStatistics.org, Office for Research Development and Education, URL https://freestatistics.org/blog/index.php?pk=75590, Retrieved Sun, 28 Apr 2024 12:40:59 +0000
QR Codes:

Original text written by user:
IsPrivate?No (this computation is public)
User-defined keywordsKDGP2W21
Estimated Impact114
Family? (F = Feedback message, R = changed R code, M = changed R Module, P = changed Parameters, D = changed Data)
-       [(Partial) Autocorrelation Function] [Opgave 6 Bis oef2...] [2010-05-05 21:57:04] [0291ee60c135beb64d296f3dc8feb2dc] [Current]
Feedback Forum

Post a new message
Dataseries X:
93.2  
96
 95.2   
 77.1
 70.9
 64.8
 70.1
 77.3
 79.5
100.6
100.7
107.1
 95.9
 82.8
 83.3
80
 80.4
 67.5
 75.7
 71.1
 89.3
101.1
105.2
114.1
 96.3
 84.4
 91.2
 81.9
 80.5
 70.4
 74.8
 75.9
 86.3
 98.7
100.9
113.8
 89.8
 84.4
 87.2
 85.6
72
 69.2
 77.5
 78.1
 94.3
 97.7
100.2
116.4
 97.1
93
96
 80.5
 76.1
 69.9
 73.6
 92.6
 94.2
 93.5
108.5
109.4
105.1
 92.5
 97.1
 81.4
 79.1
 72.1
 78.7
 87.1
 91.4
109.9
116.3
113
100
 84.8
 94.3
 87.1
 90.3
 72.4
 84.9
 92.7
 92.2
114.9
112.5
118.3
106
 91.2
 96.6
 96.3
 88.2
 70.2
 86.5
 88.2
102.8
119.1
119.2
125.1


Summary of computational transaction
Raw Inputview raw input (R code)
Raw Outputview raw output of R engine
Computing time1 seconds
R Server'Gwilym Jenkins' @ 72.249.127.135

\begin{tabular}{lllllllll}
\hline
Summary of computational transaction \tabularnewline
Raw Input & view raw input (R code)  \tabularnewline
Raw Output & view raw output of R engine  \tabularnewline
Computing time & 1 seconds \tabularnewline
R Server & 'Gwilym Jenkins' @ 72.249.127.135 \tabularnewline
\hline
\end{tabular}
%Source: https://freestatistics.org/blog/index.php?pk=75590&T=0

[TABLE]
[ROW][C]Summary of computational transaction[/C][/ROW]
[ROW][C]Raw Input[/C][C]view raw input (R code) [/C][/ROW]
[ROW][C]Raw Output[/C][C]view raw output of R engine [/C][/ROW]
[ROW][C]Computing time[/C][C]1 seconds[/C][/ROW]
[ROW][C]R Server[/C][C]'Gwilym Jenkins' @ 72.249.127.135[/C][/ROW]
[/TABLE]
Source: https://freestatistics.org/blog/index.php?pk=75590&T=0

Globally Unique Identifier (entire table): ba.freestatistics.org/blog/index.php?pk=75590&T=0

As an alternative you can also use a QR Code:  

The GUIDs for individual cells are displayed in the table below:

Summary of computational transaction
Raw Inputview raw input (R code)
Raw Outputview raw output of R engine
Computing time1 seconds
R Server'Gwilym Jenkins' @ 72.249.127.135


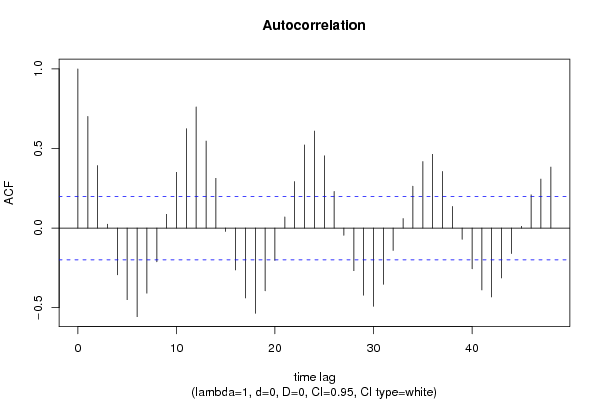
Autocorrelation Function
Time lag kACF(k)T-STATP-value
10.7019096.87730
20.3927923.84860.000107
30.024510.24010.405365
4-0.293312-2.87390.002496
5-0.450222-4.41131.3e-05
6-0.556502-5.45260
7-0.409232-4.00966e-05
8-0.212241-2.07950.020117
90.0863310.84590.199866
100.3506213.43540.000438
110.6245736.11950
120.7616357.46250
130.5468345.35790
140.3127813.06460.001415
15-0.020785-0.20360.419531
16-0.262753-2.57440.005784
17-0.439293-4.30422e-05
18-0.535359-5.24540
19-0.394257-3.86290.000102
20-0.203033-1.98930.024756
210.0703240.6890.246233
220.2920232.86120.00259
230.5228445.12281e-06
240.6099715.97650
250.4542594.45081.2e-05
260.2302772.25620.013162
27-0.045673-0.44750.327759
28-0.267776-2.62370.00506
29-0.421768-4.13253.8e-05
30-0.491654-4.81723e-06
31-0.353293-3.46150.000402
32-0.14008-1.37250.086553
330.060270.59050.278115
340.263392.58070.005687
350.4179014.09464.4e-05
360.4640064.54638e-06
370.3561973.490.000366
380.1362051.33450.092593
39-0.07048-0.69060.245753
40-0.256187-2.51010.006871
41-0.38829-3.80440.000125
42-0.432278-4.23542.6e-05
43-0.312962-3.06640.001407
44-0.159897-1.56670.060241
450.0108780.10660.457671
460.2089962.04770.021659
470.3082743.02050.001617
480.383733.75980.000146

\begin{tabular}{lllllllll}
\hline
Autocorrelation Function \tabularnewline
Time lag k & ACF(k) & T-STAT & P-value \tabularnewline
1 & 0.701909 & 6.8773 & 0 \tabularnewline
2 & 0.392792 & 3.8486 & 0.000107 \tabularnewline
3 & 0.02451 & 0.2401 & 0.405365 \tabularnewline
4 & -0.293312 & -2.8739 & 0.002496 \tabularnewline
5 & -0.450222 & -4.4113 & 1.3e-05 \tabularnewline
6 & -0.556502 & -5.4526 & 0 \tabularnewline
7 & -0.409232 & -4.0096 & 6e-05 \tabularnewline
8 & -0.212241 & -2.0795 & 0.020117 \tabularnewline
9 & 0.086331 & 0.8459 & 0.199866 \tabularnewline
10 & 0.350621 & 3.4354 & 0.000438 \tabularnewline
11 & 0.624573 & 6.1195 & 0 \tabularnewline
12 & 0.761635 & 7.4625 & 0 \tabularnewline
13 & 0.546834 & 5.3579 & 0 \tabularnewline
14 & 0.312781 & 3.0646 & 0.001415 \tabularnewline
15 & -0.020785 & -0.2036 & 0.419531 \tabularnewline
16 & -0.262753 & -2.5744 & 0.005784 \tabularnewline
17 & -0.439293 & -4.3042 & 2e-05 \tabularnewline
18 & -0.535359 & -5.2454 & 0 \tabularnewline
19 & -0.394257 & -3.8629 & 0.000102 \tabularnewline
20 & -0.203033 & -1.9893 & 0.024756 \tabularnewline
21 & 0.070324 & 0.689 & 0.246233 \tabularnewline
22 & 0.292023 & 2.8612 & 0.00259 \tabularnewline
23 & 0.522844 & 5.1228 & 1e-06 \tabularnewline
24 & 0.609971 & 5.9765 & 0 \tabularnewline
25 & 0.454259 & 4.4508 & 1.2e-05 \tabularnewline
26 & 0.230277 & 2.2562 & 0.013162 \tabularnewline
27 & -0.045673 & -0.4475 & 0.327759 \tabularnewline
28 & -0.267776 & -2.6237 & 0.00506 \tabularnewline
29 & -0.421768 & -4.1325 & 3.8e-05 \tabularnewline
30 & -0.491654 & -4.8172 & 3e-06 \tabularnewline
31 & -0.353293 & -3.4615 & 0.000402 \tabularnewline
32 & -0.14008 & -1.3725 & 0.086553 \tabularnewline
33 & 0.06027 & 0.5905 & 0.278115 \tabularnewline
34 & 0.26339 & 2.5807 & 0.005687 \tabularnewline
35 & 0.417901 & 4.0946 & 4.4e-05 \tabularnewline
36 & 0.464006 & 4.5463 & 8e-06 \tabularnewline
37 & 0.356197 & 3.49 & 0.000366 \tabularnewline
38 & 0.136205 & 1.3345 & 0.092593 \tabularnewline
39 & -0.07048 & -0.6906 & 0.245753 \tabularnewline
40 & -0.256187 & -2.5101 & 0.006871 \tabularnewline
41 & -0.38829 & -3.8044 & 0.000125 \tabularnewline
42 & -0.432278 & -4.2354 & 2.6e-05 \tabularnewline
43 & -0.312962 & -3.0664 & 0.001407 \tabularnewline
44 & -0.159897 & -1.5667 & 0.060241 \tabularnewline
45 & 0.010878 & 0.1066 & 0.457671 \tabularnewline
46 & 0.208996 & 2.0477 & 0.021659 \tabularnewline
47 & 0.308274 & 3.0205 & 0.001617 \tabularnewline
48 & 0.38373 & 3.7598 & 0.000146 \tabularnewline
\hline
\end{tabular}
%Source: https://freestatistics.org/blog/index.php?pk=75590&T=1

[TABLE]
[ROW][C]Autocorrelation Function[/C][/ROW]
[ROW][C]Time lag k[/C][C]ACF(k)[/C][C]T-STAT[/C][C]P-value[/C][/ROW]
[ROW][C]1[/C][C]0.701909[/C][C]6.8773[/C][C]0[/C][/ROW]
[ROW][C]2[/C][C]0.392792[/C][C]3.8486[/C][C]0.000107[/C][/ROW]
[ROW][C]3[/C][C]0.02451[/C][C]0.2401[/C][C]0.405365[/C][/ROW]
[ROW][C]4[/C][C]-0.293312[/C][C]-2.8739[/C][C]0.002496[/C][/ROW]
[ROW][C]5[/C][C]-0.450222[/C][C]-4.4113[/C][C]1.3e-05[/C][/ROW]
[ROW][C]6[/C][C]-0.556502[/C][C]-5.4526[/C][C]0[/C][/ROW]
[ROW][C]7[/C][C]-0.409232[/C][C]-4.0096[/C][C]6e-05[/C][/ROW]
[ROW][C]8[/C][C]-0.212241[/C][C]-2.0795[/C][C]0.020117[/C][/ROW]
[ROW][C]9[/C][C]0.086331[/C][C]0.8459[/C][C]0.199866[/C][/ROW]
[ROW][C]10[/C][C]0.350621[/C][C]3.4354[/C][C]0.000438[/C][/ROW]
[ROW][C]11[/C][C]0.624573[/C][C]6.1195[/C][C]0[/C][/ROW]
[ROW][C]12[/C][C]0.761635[/C][C]7.4625[/C][C]0[/C][/ROW]
[ROW][C]13[/C][C]0.546834[/C][C]5.3579[/C][C]0[/C][/ROW]
[ROW][C]14[/C][C]0.312781[/C][C]3.0646[/C][C]0.001415[/C][/ROW]
[ROW][C]15[/C][C]-0.020785[/C][C]-0.2036[/C][C]0.419531[/C][/ROW]
[ROW][C]16[/C][C]-0.262753[/C][C]-2.5744[/C][C]0.005784[/C][/ROW]
[ROW][C]17[/C][C]-0.439293[/C][C]-4.3042[/C][C]2e-05[/C][/ROW]
[ROW][C]18[/C][C]-0.535359[/C][C]-5.2454[/C][C]0[/C][/ROW]
[ROW][C]19[/C][C]-0.394257[/C][C]-3.8629[/C][C]0.000102[/C][/ROW]
[ROW][C]20[/C][C]-0.203033[/C][C]-1.9893[/C][C]0.024756[/C][/ROW]
[ROW][C]21[/C][C]0.070324[/C][C]0.689[/C][C]0.246233[/C][/ROW]
[ROW][C]22[/C][C]0.292023[/C][C]2.8612[/C][C]0.00259[/C][/ROW]
[ROW][C]23[/C][C]0.522844[/C][C]5.1228[/C][C]1e-06[/C][/ROW]
[ROW][C]24[/C][C]0.609971[/C][C]5.9765[/C][C]0[/C][/ROW]
[ROW][C]25[/C][C]0.454259[/C][C]4.4508[/C][C]1.2e-05[/C][/ROW]
[ROW][C]26[/C][C]0.230277[/C][C]2.2562[/C][C]0.013162[/C][/ROW]
[ROW][C]27[/C][C]-0.045673[/C][C]-0.4475[/C][C]0.327759[/C][/ROW]
[ROW][C]28[/C][C]-0.267776[/C][C]-2.6237[/C][C]0.00506[/C][/ROW]
[ROW][C]29[/C][C]-0.421768[/C][C]-4.1325[/C][C]3.8e-05[/C][/ROW]
[ROW][C]30[/C][C]-0.491654[/C][C]-4.8172[/C][C]3e-06[/C][/ROW]
[ROW][C]31[/C][C]-0.353293[/C][C]-3.4615[/C][C]0.000402[/C][/ROW]
[ROW][C]32[/C][C]-0.14008[/C][C]-1.3725[/C][C]0.086553[/C][/ROW]
[ROW][C]33[/C][C]0.06027[/C][C]0.5905[/C][C]0.278115[/C][/ROW]
[ROW][C]34[/C][C]0.26339[/C][C]2.5807[/C][C]0.005687[/C][/ROW]
[ROW][C]35[/C][C]0.417901[/C][C]4.0946[/C][C]4.4e-05[/C][/ROW]
[ROW][C]36[/C][C]0.464006[/C][C]4.5463[/C][C]8e-06[/C][/ROW]
[ROW][C]37[/C][C]0.356197[/C][C]3.49[/C][C]0.000366[/C][/ROW]
[ROW][C]38[/C][C]0.136205[/C][C]1.3345[/C][C]0.092593[/C][/ROW]
[ROW][C]39[/C][C]-0.07048[/C][C]-0.6906[/C][C]0.245753[/C][/ROW]
[ROW][C]40[/C][C]-0.256187[/C][C]-2.5101[/C][C]0.006871[/C][/ROW]
[ROW][C]41[/C][C]-0.38829[/C][C]-3.8044[/C][C]0.000125[/C][/ROW]
[ROW][C]42[/C][C]-0.432278[/C][C]-4.2354[/C][C]2.6e-05[/C][/ROW]
[ROW][C]43[/C][C]-0.312962[/C][C]-3.0664[/C][C]0.001407[/C][/ROW]
[ROW][C]44[/C][C]-0.159897[/C][C]-1.5667[/C][C]0.060241[/C][/ROW]
[ROW][C]45[/C][C]0.010878[/C][C]0.1066[/C][C]0.457671[/C][/ROW]
[ROW][C]46[/C][C]0.208996[/C][C]2.0477[/C][C]0.021659[/C][/ROW]
[ROW][C]47[/C][C]0.308274[/C][C]3.0205[/C][C]0.001617[/C][/ROW]
[ROW][C]48[/C][C]0.38373[/C][C]3.7598[/C][C]0.000146[/C][/ROW]
[/TABLE]
Source: https://freestatistics.org/blog/index.php?pk=75590&T=1

Globally Unique Identifier (entire table): ba.freestatistics.org/blog/index.php?pk=75590&T=1

As an alternative you can also use a QR Code:  

The GUIDs for individual cells are displayed in the table below:

Autocorrelation Function
Time lag kACF(k)T-STATP-value
10.7019096.87730
20.3927923.84860.000107
30.024510.24010.405365
4-0.293312-2.87390.002496
5-0.450222-4.41131.3e-05
6-0.556502-5.45260
7-0.409232-4.00966e-05
8-0.212241-2.07950.020117
90.0863310.84590.199866
100.3506213.43540.000438
110.6245736.11950
120.7616357.46250
130.5468345.35790
140.3127813.06460.001415
15-0.020785-0.20360.419531
16-0.262753-2.57440.005784
17-0.439293-4.30422e-05
18-0.535359-5.24540
19-0.394257-3.86290.000102
20-0.203033-1.98930.024756
210.0703240.6890.246233
220.2920232.86120.00259
230.5228445.12281e-06
240.6099715.97650
250.4542594.45081.2e-05
260.2302772.25620.013162
27-0.045673-0.44750.327759
28-0.267776-2.62370.00506
29-0.421768-4.13253.8e-05
30-0.491654-4.81723e-06
31-0.353293-3.46150.000402
32-0.14008-1.37250.086553
330.060270.59050.278115
340.263392.58070.005687
350.4179014.09464.4e-05
360.4640064.54638e-06
370.3561973.490.000366
380.1362051.33450.092593
39-0.07048-0.69060.245753
40-0.256187-2.51010.006871
41-0.38829-3.80440.000125
42-0.432278-4.23542.6e-05
43-0.312962-3.06640.001407
44-0.159897-1.56670.060241
450.0108780.10660.457671
460.2089962.04770.021659
470.3082743.02050.001617
480.383733.75980.000146


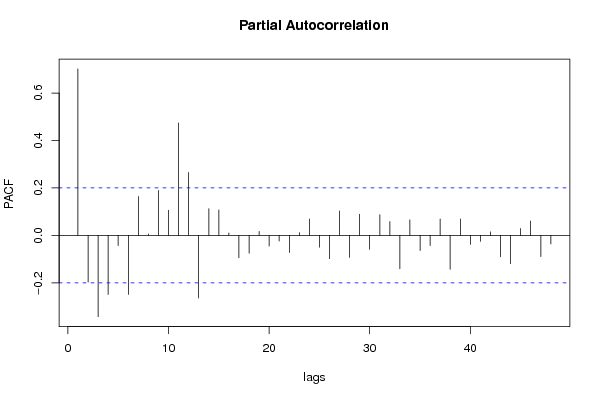
Partial Autocorrelation Function
Time lag kPACF(k)T-STATP-value
10.7019096.87730
2-0.196884-1.92910.028338
3-0.34303-3.3610.000558
4-0.249451-2.44410.008173
5-0.043072-0.4220.336977
6-0.249092-2.44060.008248
70.1640511.60740.05563
80.0057420.05630.477626
90.189331.8550.03333
100.106171.04030.150418
110.4742624.64685e-06
120.2652252.59870.005417
13-0.263873-2.58540.005615
140.1124451.10170.136667
150.10741.05230.147652
160.0100170.09810.461012
17-0.094041-0.92140.179573
18-0.075167-0.73650.231617
190.0163440.16010.436555
20-0.045406-0.44490.328703
21-0.024292-0.2380.406188
22-0.072469-0.710.239698
230.0111020.10880.456803
240.0688330.67440.25083
25-0.050031-0.49020.312556
26-0.098327-0.96340.168883
270.1029931.00910.157726
28-0.093361-0.91470.181307
290.0893850.87580.191664
30-0.059093-0.5790.281977
310.0873070.85540.197222
320.0579910.56820.285614
33-0.141353-1.3850.084636
340.0652690.63950.26201
35-0.064265-0.62970.265204
36-0.043252-0.42380.336336
370.0693290.67930.249295
38-0.143175-1.40280.081947
390.0694270.68020.248993
40-0.038603-0.37820.353047
41-0.025299-0.24790.402379
420.0146380.14340.44313
43-0.090639-0.88810.18836
44-0.11942-1.17010.122434
450.0291160.28530.388024
460.0601420.58930.278533
47-0.089721-0.87910.190776
48-0.036342-0.35610.361282

\begin{tabular}{lllllllll}
\hline
Partial Autocorrelation Function \tabularnewline
Time lag k & PACF(k) & T-STAT & P-value \tabularnewline
1 & 0.701909 & 6.8773 & 0 \tabularnewline
2 & -0.196884 & -1.9291 & 0.028338 \tabularnewline
3 & -0.34303 & -3.361 & 0.000558 \tabularnewline
4 & -0.249451 & -2.4441 & 0.008173 \tabularnewline
5 & -0.043072 & -0.422 & 0.336977 \tabularnewline
6 & -0.249092 & -2.4406 & 0.008248 \tabularnewline
7 & 0.164051 & 1.6074 & 0.05563 \tabularnewline
8 & 0.005742 & 0.0563 & 0.477626 \tabularnewline
9 & 0.18933 & 1.855 & 0.03333 \tabularnewline
10 & 0.10617 & 1.0403 & 0.150418 \tabularnewline
11 & 0.474262 & 4.6468 & 5e-06 \tabularnewline
12 & 0.265225 & 2.5987 & 0.005417 \tabularnewline
13 & -0.263873 & -2.5854 & 0.005615 \tabularnewline
14 & 0.112445 & 1.1017 & 0.136667 \tabularnewline
15 & 0.1074 & 1.0523 & 0.147652 \tabularnewline
16 & 0.010017 & 0.0981 & 0.461012 \tabularnewline
17 & -0.094041 & -0.9214 & 0.179573 \tabularnewline
18 & -0.075167 & -0.7365 & 0.231617 \tabularnewline
19 & 0.016344 & 0.1601 & 0.436555 \tabularnewline
20 & -0.045406 & -0.4449 & 0.328703 \tabularnewline
21 & -0.024292 & -0.238 & 0.406188 \tabularnewline
22 & -0.072469 & -0.71 & 0.239698 \tabularnewline
23 & 0.011102 & 0.1088 & 0.456803 \tabularnewline
24 & 0.068833 & 0.6744 & 0.25083 \tabularnewline
25 & -0.050031 & -0.4902 & 0.312556 \tabularnewline
26 & -0.098327 & -0.9634 & 0.168883 \tabularnewline
27 & 0.102993 & 1.0091 & 0.157726 \tabularnewline
28 & -0.093361 & -0.9147 & 0.181307 \tabularnewline
29 & 0.089385 & 0.8758 & 0.191664 \tabularnewline
30 & -0.059093 & -0.579 & 0.281977 \tabularnewline
31 & 0.087307 & 0.8554 & 0.197222 \tabularnewline
32 & 0.057991 & 0.5682 & 0.285614 \tabularnewline
33 & -0.141353 & -1.385 & 0.084636 \tabularnewline
34 & 0.065269 & 0.6395 & 0.26201 \tabularnewline
35 & -0.064265 & -0.6297 & 0.265204 \tabularnewline
36 & -0.043252 & -0.4238 & 0.336336 \tabularnewline
37 & 0.069329 & 0.6793 & 0.249295 \tabularnewline
38 & -0.143175 & -1.4028 & 0.081947 \tabularnewline
39 & 0.069427 & 0.6802 & 0.248993 \tabularnewline
40 & -0.038603 & -0.3782 & 0.353047 \tabularnewline
41 & -0.025299 & -0.2479 & 0.402379 \tabularnewline
42 & 0.014638 & 0.1434 & 0.44313 \tabularnewline
43 & -0.090639 & -0.8881 & 0.18836 \tabularnewline
44 & -0.11942 & -1.1701 & 0.122434 \tabularnewline
45 & 0.029116 & 0.2853 & 0.388024 \tabularnewline
46 & 0.060142 & 0.5893 & 0.278533 \tabularnewline
47 & -0.089721 & -0.8791 & 0.190776 \tabularnewline
48 & -0.036342 & -0.3561 & 0.361282 \tabularnewline
\hline
\end{tabular}
%Source: https://freestatistics.org/blog/index.php?pk=75590&T=2

[TABLE]
[ROW][C]Partial Autocorrelation Function[/C][/ROW]
[ROW][C]Time lag k[/C][C]PACF(k)[/C][C]T-STAT[/C][C]P-value[/C][/ROW]
[ROW][C]1[/C][C]0.701909[/C][C]6.8773[/C][C]0[/C][/ROW]
[ROW][C]2[/C][C]-0.196884[/C][C]-1.9291[/C][C]0.028338[/C][/ROW]
[ROW][C]3[/C][C]-0.34303[/C][C]-3.361[/C][C]0.000558[/C][/ROW]
[ROW][C]4[/C][C]-0.249451[/C][C]-2.4441[/C][C]0.008173[/C][/ROW]
[ROW][C]5[/C][C]-0.043072[/C][C]-0.422[/C][C]0.336977[/C][/ROW]
[ROW][C]6[/C][C]-0.249092[/C][C]-2.4406[/C][C]0.008248[/C][/ROW]
[ROW][C]7[/C][C]0.164051[/C][C]1.6074[/C][C]0.05563[/C][/ROW]
[ROW][C]8[/C][C]0.005742[/C][C]0.0563[/C][C]0.477626[/C][/ROW]
[ROW][C]9[/C][C]0.18933[/C][C]1.855[/C][C]0.03333[/C][/ROW]
[ROW][C]10[/C][C]0.10617[/C][C]1.0403[/C][C]0.150418[/C][/ROW]
[ROW][C]11[/C][C]0.474262[/C][C]4.6468[/C][C]5e-06[/C][/ROW]
[ROW][C]12[/C][C]0.265225[/C][C]2.5987[/C][C]0.005417[/C][/ROW]
[ROW][C]13[/C][C]-0.263873[/C][C]-2.5854[/C][C]0.005615[/C][/ROW]
[ROW][C]14[/C][C]0.112445[/C][C]1.1017[/C][C]0.136667[/C][/ROW]
[ROW][C]15[/C][C]0.1074[/C][C]1.0523[/C][C]0.147652[/C][/ROW]
[ROW][C]16[/C][C]0.010017[/C][C]0.0981[/C][C]0.461012[/C][/ROW]
[ROW][C]17[/C][C]-0.094041[/C][C]-0.9214[/C][C]0.179573[/C][/ROW]
[ROW][C]18[/C][C]-0.075167[/C][C]-0.7365[/C][C]0.231617[/C][/ROW]
[ROW][C]19[/C][C]0.016344[/C][C]0.1601[/C][C]0.436555[/C][/ROW]
[ROW][C]20[/C][C]-0.045406[/C][C]-0.4449[/C][C]0.328703[/C][/ROW]
[ROW][C]21[/C][C]-0.024292[/C][C]-0.238[/C][C]0.406188[/C][/ROW]
[ROW][C]22[/C][C]-0.072469[/C][C]-0.71[/C][C]0.239698[/C][/ROW]
[ROW][C]23[/C][C]0.011102[/C][C]0.1088[/C][C]0.456803[/C][/ROW]
[ROW][C]24[/C][C]0.068833[/C][C]0.6744[/C][C]0.25083[/C][/ROW]
[ROW][C]25[/C][C]-0.050031[/C][C]-0.4902[/C][C]0.312556[/C][/ROW]
[ROW][C]26[/C][C]-0.098327[/C][C]-0.9634[/C][C]0.168883[/C][/ROW]
[ROW][C]27[/C][C]0.102993[/C][C]1.0091[/C][C]0.157726[/C][/ROW]
[ROW][C]28[/C][C]-0.093361[/C][C]-0.9147[/C][C]0.181307[/C][/ROW]
[ROW][C]29[/C][C]0.089385[/C][C]0.8758[/C][C]0.191664[/C][/ROW]
[ROW][C]30[/C][C]-0.059093[/C][C]-0.579[/C][C]0.281977[/C][/ROW]
[ROW][C]31[/C][C]0.087307[/C][C]0.8554[/C][C]0.197222[/C][/ROW]
[ROW][C]32[/C][C]0.057991[/C][C]0.5682[/C][C]0.285614[/C][/ROW]
[ROW][C]33[/C][C]-0.141353[/C][C]-1.385[/C][C]0.084636[/C][/ROW]
[ROW][C]34[/C][C]0.065269[/C][C]0.6395[/C][C]0.26201[/C][/ROW]
[ROW][C]35[/C][C]-0.064265[/C][C]-0.6297[/C][C]0.265204[/C][/ROW]
[ROW][C]36[/C][C]-0.043252[/C][C]-0.4238[/C][C]0.336336[/C][/ROW]
[ROW][C]37[/C][C]0.069329[/C][C]0.6793[/C][C]0.249295[/C][/ROW]
[ROW][C]38[/C][C]-0.143175[/C][C]-1.4028[/C][C]0.081947[/C][/ROW]
[ROW][C]39[/C][C]0.069427[/C][C]0.6802[/C][C]0.248993[/C][/ROW]
[ROW][C]40[/C][C]-0.038603[/C][C]-0.3782[/C][C]0.353047[/C][/ROW]
[ROW][C]41[/C][C]-0.025299[/C][C]-0.2479[/C][C]0.402379[/C][/ROW]
[ROW][C]42[/C][C]0.014638[/C][C]0.1434[/C][C]0.44313[/C][/ROW]
[ROW][C]43[/C][C]-0.090639[/C][C]-0.8881[/C][C]0.18836[/C][/ROW]
[ROW][C]44[/C][C]-0.11942[/C][C]-1.1701[/C][C]0.122434[/C][/ROW]
[ROW][C]45[/C][C]0.029116[/C][C]0.2853[/C][C]0.388024[/C][/ROW]
[ROW][C]46[/C][C]0.060142[/C][C]0.5893[/C][C]0.278533[/C][/ROW]
[ROW][C]47[/C][C]-0.089721[/C][C]-0.8791[/C][C]0.190776[/C][/ROW]
[ROW][C]48[/C][C]-0.036342[/C][C]-0.3561[/C][C]0.361282[/C][/ROW]
[/TABLE]
Source: https://freestatistics.org/blog/index.php?pk=75590&T=2

Globally Unique Identifier (entire table): ba.freestatistics.org/blog/index.php?pk=75590&T=2

As an alternative you can also use a QR Code:  

The GUIDs for individual cells are displayed in the table below:

Partial Autocorrelation Function
Time lag kPACF(k)T-STATP-value
10.7019096.87730
2-0.196884-1.92910.028338
3-0.34303-3.3610.000558
4-0.249451-2.44410.008173
5-0.043072-0.4220.336977
6-0.249092-2.44060.008248
70.1640511.60740.05563
80.0057420.05630.477626
90.189331.8550.03333
100.106171.04030.150418
110.4742624.64685e-06
120.2652252.59870.005417
13-0.263873-2.58540.005615
140.1124451.10170.136667
150.10741.05230.147652
160.0100170.09810.461012
17-0.094041-0.92140.179573
18-0.075167-0.73650.231617
190.0163440.16010.436555
20-0.045406-0.44490.328703
21-0.024292-0.2380.406188
22-0.072469-0.710.239698
230.0111020.10880.456803
240.0688330.67440.25083
25-0.050031-0.49020.312556
26-0.098327-0.96340.168883
270.1029931.00910.157726
28-0.093361-0.91470.181307
290.0893850.87580.191664
30-0.059093-0.5790.281977
310.0873070.85540.197222
320.0579910.56820.285614
33-0.141353-1.3850.084636
340.0652690.63950.26201
35-0.064265-0.62970.265204
36-0.043252-0.42380.336336
370.0693290.67930.249295
38-0.143175-1.40280.081947
390.0694270.68020.248993
40-0.038603-0.37820.353047
41-0.025299-0.24790.402379
420.0146380.14340.44313
43-0.090639-0.88810.18836
44-0.11942-1.17010.122434
450.0291160.28530.388024
460.0601420.58930.278533
47-0.089721-0.87910.190776
48-0.036342-0.35610.361282


Parameters (Session):
par1 = 48 ; par2 = 1 ; par3 = 0 ; par4 = 0 ; par5 = 12 ; par6 = White Noise ; par7 = 0.95 ;
Parameters (R input):
par1 = 48 ; par2 = 1 ; par3 = 0 ; par4 = 0 ; par5 = 12 ; par6 = White Noise ; par7 = 0.95 ;
R code (references can be found in the software module):
if (par1 == 'Default') {
par1 = 10*log10(length(x))
} else {
par1 <- as.numeric(par1)
}
par2 <- as.numeric(par2)
par3 <- as.numeric(par3)
par4 <- as.numeric(par4)
par5 <- as.numeric(par5)
if (par6 == 'White Noise') par6 <- 'white' else par6 <- 'ma'
par7 <- as.numeric(par7)
if (par2 == 0) {
x <- log(x)
} else {
x <- (x ^ par2 - 1) / par2
}
if (par3 > 0) x <- diff(x,lag=1,difference=par3)
if (par4 > 0) x <- diff(x,lag=par5,difference=par4)
bitmap(file='pic1.png')
racf <- acf(x, par1, main='Autocorrelation', xlab='time lag', ylab='ACF', ci.type=par6, ci=par7, sub=paste('(lambda=',par2,', d=',par3,', D=',par4,', CI=', par7, ', CI type=',par6,')',sep=''))
dev.off()
bitmap(file='pic2.png')
rpacf <- pacf(x,par1,main='Partial Autocorrelation',xlab='lags',ylab='PACF')
dev.off()
(myacf <- c(racf$acf))
(mypacf <- c(rpacf$acf))
lengthx <- length(x)
sqrtn <- sqrt(lengthx)
load(file='createtable')
a<-table.start()
a<-table.row.start(a)
a<-table.element(a,'Autocorrelation Function',4,TRUE)
a<-table.row.end(a)
a<-table.row.start(a)
a<-table.element(a,'Time lag k',header=TRUE)
a<-table.element(a,hyperlink('basics.htm','ACF(k)','click here for more information about the Autocorrelation Function'),header=TRUE)
a<-table.element(a,'T-STAT',header=TRUE)
a<-table.element(a,'P-value',header=TRUE)
a<-table.row.end(a)
for (i in 2:(par1+1)) {
a<-table.row.start(a)
a<-table.element(a,i-1,header=TRUE)
a<-table.element(a,round(myacf[i],6))
mytstat <- myacf[i]*sqrtn
a<-table.element(a,round(mytstat,4))
a<-table.element(a,round(1-pt(abs(mytstat),lengthx),6))
a<-table.row.end(a)
}
a<-table.end(a)
table.save(a,file='mytable.tab')
a<-table.start()
a<-table.row.start(a)
a<-table.element(a,'Partial Autocorrelation Function',4,TRUE)
a<-table.row.end(a)
a<-table.row.start(a)
a<-table.element(a,'Time lag k',header=TRUE)
a<-table.element(a,hyperlink('basics.htm','PACF(k)','click here for more information about the Partial Autocorrelation Function'),header=TRUE)
a<-table.element(a,'T-STAT',header=TRUE)
a<-table.element(a,'P-value',header=TRUE)
a<-table.row.end(a)
for (i in 1:par1) {
a<-table.row.start(a)
a<-table.element(a,i,header=TRUE)
a<-table.element(a,round(mypacf[i],6))
mytstat <- mypacf[i]*sqrtn
a<-table.element(a,round(mytstat,4))
a<-table.element(a,round(1-pt(abs(mytstat),lengthx),6))
a<-table.row.end(a)
}
a<-table.end(a)
table.save(a,file='mytable1.tab')