Free Statistics

of Irreproducible Research!

Author's title

Author*Unverified author*
R Software Modulerwasp_smp.wasp
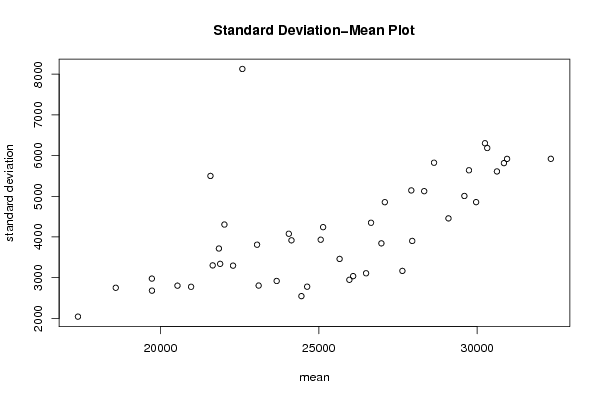
Title produced by softwareStandard Deviation-Mean Plot
Date of computationMon, 10 May 2010 16:16:39 +0000
Cite this page as followsStatistical Computations at FreeStatistics.org, Office for Research Development and Education, URL https://freestatistics.org/blog/index.php?v=date/2010/May/10/t1273508224aex5a05i6k1miej.htm/, Retrieved Mon, 29 Apr 2024 12:26:14 +0000
Statistical Computations at FreeStatistics.org, Office for Research Development and Education, URL https://freestatistics.org/blog/index.php?pk=75744, Retrieved Mon, 29 Apr 2024 12:26:14 +0000
QR Codes:

Original text written by user:
IsPrivate?No (this computation is public)
User-defined keywordsKDGP2W83
Estimated Impact129
Family? (F = Feedback message, R = changed R code, M = changed R Module, P = changed Parameters, D = changed Data)
-       [Standard Deviation-Mean Plot] [] [2010-05-10 16:16:39] [3c5691dd66ab5929cdba3f011b504b86] [Current]
Feedback Forum

Post a new message
Dataseries X:
15136
16733
20016
17708
18019
19227
22893
23739
21133
22591
26786
29740
15028
17977
20008
21354
19498
22125
25817
28779
20960
22254
27392
29945
16933
17892
20533
23569
22417
22084
26580
27454
24081
23451
28991
31386
16896
20045
23471
21747
25621
23859
25500
30998
24475
23145
29701
34365
17556
22077
25702
22214
26886
23191
27831
35406
23195
25110
30009
36242
18450
21845
26488
22394
28057
25451
24872
33424
24052
28449
33533
37351
19969
21701
26249
24493
24603
26485
30723
34569
26689
26157
32064
38870
21337
19419
23166
28286
24570
24001
33151
24878
26804
28967
33311
40226
20504
23060
23562
27562
23940
24584
34303
25517
23494
29095
32903
34379
16991
21109
23740
25552
21752
20294
29009
25500
24166
26960
31222
38641
14672
17543
25453
32683
22449
22316
27595
25451
25421
25288
32568
35110
16052
22146
21198
19543
22084
23816
29961
26773
26635
26972
30207
38687
16974
21697
24179
23757
25013
24019
30345
24488
25156
25650
30923
37240
17466
19463
24352
26805
25236
24735
29356
31234
22724
28496
32857
37198
13652
22784
23565
26323
23779
27549
29660
23356


Summary of computational transaction
Raw Inputview raw input (R code)
Raw Outputview raw output of R engine
Computing time1 seconds
R Server'Gwilym Jenkins' @ 72.249.127.135

\begin{tabular}{lllllllll}
\hline
Summary of computational transaction \tabularnewline
Raw Input & view raw input (R code)  \tabularnewline
Raw Output & view raw output of R engine  \tabularnewline
Computing time & 1 seconds \tabularnewline
R Server & 'Gwilym Jenkins' @ 72.249.127.135 \tabularnewline
\hline
\end{tabular}
%Source: https://freestatistics.org/blog/index.php?pk=75744&T=0

[TABLE]
[ROW][C]Summary of computational transaction[/C][/ROW]
[ROW][C]Raw Input[/C][C]view raw input (R code) [/C][/ROW]
[ROW][C]Raw Output[/C][C]view raw output of R engine [/C][/ROW]
[ROW][C]Computing time[/C][C]1 seconds[/C][/ROW]
[ROW][C]R Server[/C][C]'Gwilym Jenkins' @ 72.249.127.135[/C][/ROW]
[/TABLE]
Source: https://freestatistics.org/blog/index.php?pk=75744&T=0

Globally Unique Identifier (entire table): ba.freestatistics.org/blog/index.php?pk=75744&T=0

As an alternative you can also use a QR Code:  

The GUIDs for individual cells are displayed in the table below:

Summary of computational transaction
Raw Inputview raw input (R code)
Raw Outputview raw output of R engine
Computing time1 seconds
R Server'Gwilym Jenkins' @ 72.249.127.135


Standard Deviation-Mean Plot
SectionMeanStandard DeviationRange
117398.252041.96741322354880
220969.52775.592369206985720
325062.53932.714965516828607
418591.752751.606848734036326
524054.754078.887460652319281
625137.754241.104602577028985
719731.752976.808735878076636
824633.752778.303124210895370
926977.253843.391243420327935
1020539.752803.056114909826575
1126494.53108.022147068247139
1227921.55143.8839735489111220
1321887.253339.401880077738146
1428328.55125.5316797382112215
15286395824.4738245899413047
1622294.253295.328650782308038
17279513902.785586389978552
1830846.255814.8957786590413299
19231032805.766443119126280
20290954457.399241710359966
21309455918.7911491001812713
22230523809.972265865818867
23266504349.198623501429150
24323275920.4612995948213422
25236722918.616567256947058
26270864854.6942917826110363
2729967.754856.1284562224410885
28218483716.443192085688561
2924138.753917.950771768328715
3030247.256303.24759548614475
3122587.758128.8033303391818011
3224452.752546.301419052095279
3329596.755007.543201677519822
3419734.752680.462817624356094
3525658.53460.514075490337877
3630625.255610.5578079783412052
3721651.753301.639125747497205
3825966.252947.266685705026326
3929742.255638.871776930812084
4022021.54305.485067523369339
4127640.253166.477156610066499
4230318.756185.1822595080714474
43215815499.6687779053312671
44260863038.036317535836304

\begin{tabular}{lllllllll}
\hline
Standard Deviation-Mean Plot \tabularnewline
Section & Mean & Standard Deviation & Range \tabularnewline
1 & 17398.25 & 2041.9674132235 & 4880 \tabularnewline
2 & 20969.5 & 2775.59236920698 & 5720 \tabularnewline
3 & 25062.5 & 3932.71496551682 & 8607 \tabularnewline
4 & 18591.75 & 2751.60684873403 & 6326 \tabularnewline
5 & 24054.75 & 4078.88746065231 & 9281 \tabularnewline
6 & 25137.75 & 4241.10460257702 & 8985 \tabularnewline
7 & 19731.75 & 2976.80873587807 & 6636 \tabularnewline
8 & 24633.75 & 2778.30312421089 & 5370 \tabularnewline
9 & 26977.25 & 3843.39124342032 & 7935 \tabularnewline
10 & 20539.75 & 2803.05611490982 & 6575 \tabularnewline
11 & 26494.5 & 3108.02214706824 & 7139 \tabularnewline
12 & 27921.5 & 5143.88397354891 & 11220 \tabularnewline
13 & 21887.25 & 3339.40188007773 & 8146 \tabularnewline
14 & 28328.5 & 5125.53167973821 & 12215 \tabularnewline
15 & 28639 & 5824.47382458994 & 13047 \tabularnewline
16 & 22294.25 & 3295.32865078230 & 8038 \tabularnewline
17 & 27951 & 3902.78558638997 & 8552 \tabularnewline
18 & 30846.25 & 5814.89577865904 & 13299 \tabularnewline
19 & 23103 & 2805.76644311912 & 6280 \tabularnewline
20 & 29095 & 4457.39924171035 & 9966 \tabularnewline
21 & 30945 & 5918.79114910018 & 12713 \tabularnewline
22 & 23052 & 3809.97226586581 & 8867 \tabularnewline
23 & 26650 & 4349.19862350142 & 9150 \tabularnewline
24 & 32327 & 5920.46129959482 & 13422 \tabularnewline
25 & 23672 & 2918.61656725694 & 7058 \tabularnewline
26 & 27086 & 4854.69429178261 & 10363 \tabularnewline
27 & 29967.75 & 4856.12845622244 & 10885 \tabularnewline
28 & 21848 & 3716.44319208568 & 8561 \tabularnewline
29 & 24138.75 & 3917.95077176832 & 8715 \tabularnewline
30 & 30247.25 & 6303.247595486 & 14475 \tabularnewline
31 & 22587.75 & 8128.80333033918 & 18011 \tabularnewline
32 & 24452.75 & 2546.30141905209 & 5279 \tabularnewline
33 & 29596.75 & 5007.54320167751 & 9822 \tabularnewline
34 & 19734.75 & 2680.46281762435 & 6094 \tabularnewline
35 & 25658.5 & 3460.51407549033 & 7877 \tabularnewline
36 & 30625.25 & 5610.55780797834 & 12052 \tabularnewline
37 & 21651.75 & 3301.63912574749 & 7205 \tabularnewline
38 & 25966.25 & 2947.26668570502 & 6326 \tabularnewline
39 & 29742.25 & 5638.8717769308 & 12084 \tabularnewline
40 & 22021.5 & 4305.48506752336 & 9339 \tabularnewline
41 & 27640.25 & 3166.47715661006 & 6499 \tabularnewline
42 & 30318.75 & 6185.18225950807 & 14474 \tabularnewline
43 & 21581 & 5499.66877790533 & 12671 \tabularnewline
44 & 26086 & 3038.03631753583 & 6304 \tabularnewline
\hline
\end{tabular}
%Source: https://freestatistics.org/blog/index.php?pk=75744&T=1

[TABLE]
[ROW][C]Standard Deviation-Mean Plot[/C][/ROW]
[ROW][C]Section[/C][C]Mean[/C][C]Standard Deviation[/C][C]Range[/C][/ROW]
[ROW][C]1[/C][C]17398.25[/C][C]2041.9674132235[/C][C]4880[/C][/ROW]
[ROW][C]2[/C][C]20969.5[/C][C]2775.59236920698[/C][C]5720[/C][/ROW]
[ROW][C]3[/C][C]25062.5[/C][C]3932.71496551682[/C][C]8607[/C][/ROW]
[ROW][C]4[/C][C]18591.75[/C][C]2751.60684873403[/C][C]6326[/C][/ROW]
[ROW][C]5[/C][C]24054.75[/C][C]4078.88746065231[/C][C]9281[/C][/ROW]
[ROW][C]6[/C][C]25137.75[/C][C]4241.10460257702[/C][C]8985[/C][/ROW]
[ROW][C]7[/C][C]19731.75[/C][C]2976.80873587807[/C][C]6636[/C][/ROW]
[ROW][C]8[/C][C]24633.75[/C][C]2778.30312421089[/C][C]5370[/C][/ROW]
[ROW][C]9[/C][C]26977.25[/C][C]3843.39124342032[/C][C]7935[/C][/ROW]
[ROW][C]10[/C][C]20539.75[/C][C]2803.05611490982[/C][C]6575[/C][/ROW]
[ROW][C]11[/C][C]26494.5[/C][C]3108.02214706824[/C][C]7139[/C][/ROW]
[ROW][C]12[/C][C]27921.5[/C][C]5143.88397354891[/C][C]11220[/C][/ROW]
[ROW][C]13[/C][C]21887.25[/C][C]3339.40188007773[/C][C]8146[/C][/ROW]
[ROW][C]14[/C][C]28328.5[/C][C]5125.53167973821[/C][C]12215[/C][/ROW]
[ROW][C]15[/C][C]28639[/C][C]5824.47382458994[/C][C]13047[/C][/ROW]
[ROW][C]16[/C][C]22294.25[/C][C]3295.32865078230[/C][C]8038[/C][/ROW]
[ROW][C]17[/C][C]27951[/C][C]3902.78558638997[/C][C]8552[/C][/ROW]
[ROW][C]18[/C][C]30846.25[/C][C]5814.89577865904[/C][C]13299[/C][/ROW]
[ROW][C]19[/C][C]23103[/C][C]2805.76644311912[/C][C]6280[/C][/ROW]
[ROW][C]20[/C][C]29095[/C][C]4457.39924171035[/C][C]9966[/C][/ROW]
[ROW][C]21[/C][C]30945[/C][C]5918.79114910018[/C][C]12713[/C][/ROW]
[ROW][C]22[/C][C]23052[/C][C]3809.97226586581[/C][C]8867[/C][/ROW]
[ROW][C]23[/C][C]26650[/C][C]4349.19862350142[/C][C]9150[/C][/ROW]
[ROW][C]24[/C][C]32327[/C][C]5920.46129959482[/C][C]13422[/C][/ROW]
[ROW][C]25[/C][C]23672[/C][C]2918.61656725694[/C][C]7058[/C][/ROW]
[ROW][C]26[/C][C]27086[/C][C]4854.69429178261[/C][C]10363[/C][/ROW]
[ROW][C]27[/C][C]29967.75[/C][C]4856.12845622244[/C][C]10885[/C][/ROW]
[ROW][C]28[/C][C]21848[/C][C]3716.44319208568[/C][C]8561[/C][/ROW]
[ROW][C]29[/C][C]24138.75[/C][C]3917.95077176832[/C][C]8715[/C][/ROW]
[ROW][C]30[/C][C]30247.25[/C][C]6303.247595486[/C][C]14475[/C][/ROW]
[ROW][C]31[/C][C]22587.75[/C][C]8128.80333033918[/C][C]18011[/C][/ROW]
[ROW][C]32[/C][C]24452.75[/C][C]2546.30141905209[/C][C]5279[/C][/ROW]
[ROW][C]33[/C][C]29596.75[/C][C]5007.54320167751[/C][C]9822[/C][/ROW]
[ROW][C]34[/C][C]19734.75[/C][C]2680.46281762435[/C][C]6094[/C][/ROW]
[ROW][C]35[/C][C]25658.5[/C][C]3460.51407549033[/C][C]7877[/C][/ROW]
[ROW][C]36[/C][C]30625.25[/C][C]5610.55780797834[/C][C]12052[/C][/ROW]
[ROW][C]37[/C][C]21651.75[/C][C]3301.63912574749[/C][C]7205[/C][/ROW]
[ROW][C]38[/C][C]25966.25[/C][C]2947.26668570502[/C][C]6326[/C][/ROW]
[ROW][C]39[/C][C]29742.25[/C][C]5638.8717769308[/C][C]12084[/C][/ROW]
[ROW][C]40[/C][C]22021.5[/C][C]4305.48506752336[/C][C]9339[/C][/ROW]
[ROW][C]41[/C][C]27640.25[/C][C]3166.47715661006[/C][C]6499[/C][/ROW]
[ROW][C]42[/C][C]30318.75[/C][C]6185.18225950807[/C][C]14474[/C][/ROW]
[ROW][C]43[/C][C]21581[/C][C]5499.66877790533[/C][C]12671[/C][/ROW]
[ROW][C]44[/C][C]26086[/C][C]3038.03631753583[/C][C]6304[/C][/ROW]
[/TABLE]
Source: https://freestatistics.org/blog/index.php?pk=75744&T=1

Globally Unique Identifier (entire table): ba.freestatistics.org/blog/index.php?pk=75744&T=1

As an alternative you can also use a QR Code:  

The GUIDs for individual cells are displayed in the table below:

Standard Deviation-Mean Plot
SectionMeanStandard DeviationRange
117398.252041.96741322354880
220969.52775.592369206985720
325062.53932.714965516828607
418591.752751.606848734036326
524054.754078.887460652319281
625137.754241.104602577028985
719731.752976.808735878076636
824633.752778.303124210895370
926977.253843.391243420327935
1020539.752803.056114909826575
1126494.53108.022147068247139
1227921.55143.8839735489111220
1321887.253339.401880077738146
1428328.55125.5316797382112215
15286395824.4738245899413047
1622294.253295.328650782308038
17279513902.785586389978552
1830846.255814.8957786590413299
19231032805.766443119126280
20290954457.399241710359966
21309455918.7911491001812713
22230523809.972265865818867
23266504349.198623501429150
24323275920.4612995948213422
25236722918.616567256947058
26270864854.6942917826110363
2729967.754856.1284562224410885
28218483716.443192085688561
2924138.753917.950771768328715
3030247.256303.24759548614475
3122587.758128.8033303391818011
3224452.752546.301419052095279
3329596.755007.543201677519822
3419734.752680.462817624356094
3525658.53460.514075490337877
3630625.255610.5578079783412052
3721651.753301.639125747497205
3825966.252947.266685705026326
3929742.255638.871776930812084
4022021.54305.485067523369339
4127640.253166.477156610066499
4230318.756185.1822595080714474
43215815499.6687779053312671
44260863038.036317535836304


Regression: S.E.(k) = alpha + beta * Mean(k)
alpha-1419.06648402853
beta0.219790711439122
S.D.0.041964086545167
T-STAT5.2375907480449
p-value4.90668774041361e-06

\begin{tabular}{lllllllll}
\hline
Regression: S.E.(k) = alpha + beta * Mean(k) \tabularnewline
alpha & -1419.06648402853 \tabularnewline
beta & 0.219790711439122 \tabularnewline
S.D. & 0.041964086545167 \tabularnewline
T-STAT & 5.2375907480449 \tabularnewline
p-value & 4.90668774041361e-06 \tabularnewline
\hline
\end{tabular}
%Source: https://freestatistics.org/blog/index.php?pk=75744&T=2

[TABLE]
[ROW][C]Regression: S.E.(k) = alpha + beta * Mean(k)[/C][/ROW]
[ROW][C]alpha[/C][C]-1419.06648402853[/C][/ROW]
[ROW][C]beta[/C][C]0.219790711439122[/C][/ROW]
[ROW][C]S.D.[/C][C]0.041964086545167[/C][/ROW]
[ROW][C]T-STAT[/C][C]5.2375907480449[/C][/ROW]
[ROW][C]p-value[/C][C]4.90668774041361e-06[/C][/ROW]
[/TABLE]
Source: https://freestatistics.org/blog/index.php?pk=75744&T=2

Globally Unique Identifier (entire table): ba.freestatistics.org/blog/index.php?pk=75744&T=2

As an alternative you can also use a QR Code:  

The GUIDs for individual cells are displayed in the table below:

Regression: S.E.(k) = alpha + beta * Mean(k)
alpha-1419.06648402853
beta0.219790711439122
S.D.0.041964086545167
T-STAT5.2375907480449
p-value4.90668774041361e-06


Regression: ln S.E.(k) = alpha + beta * ln Mean(k)
alpha-5.56541890162681
beta1.36722762152273
S.D.0.231824281189568
T-STAT5.89768946767365
p-value5.57384172493935e-07
Lambda-0.367227621522732

\begin{tabular}{lllllllll}
\hline
Regression: ln S.E.(k) = alpha + beta * ln Mean(k) \tabularnewline
alpha & -5.56541890162681 \tabularnewline
beta & 1.36722762152273 \tabularnewline
S.D. & 0.231824281189568 \tabularnewline
T-STAT & 5.89768946767365 \tabularnewline
p-value & 5.57384172493935e-07 \tabularnewline
Lambda & -0.367227621522732 \tabularnewline
\hline
\end{tabular}
%Source: https://freestatistics.org/blog/index.php?pk=75744&T=3

[TABLE]
[ROW][C]Regression: ln S.E.(k) = alpha + beta * ln Mean(k)[/C][/ROW]
[ROW][C]alpha[/C][C]-5.56541890162681[/C][/ROW]
[ROW][C]beta[/C][C]1.36722762152273[/C][/ROW]
[ROW][C]S.D.[/C][C]0.231824281189568[/C][/ROW]
[ROW][C]T-STAT[/C][C]5.89768946767365[/C][/ROW]
[ROW][C]p-value[/C][C]5.57384172493935e-07[/C][/ROW]
[ROW][C]Lambda[/C][C]-0.367227621522732[/C][/ROW]
[/TABLE]
Source: https://freestatistics.org/blog/index.php?pk=75744&T=3

Globally Unique Identifier (entire table): ba.freestatistics.org/blog/index.php?pk=75744&T=3

As an alternative you can also use a QR Code:  

The GUIDs for individual cells are displayed in the table below:

Regression: ln S.E.(k) = alpha + beta * ln Mean(k)
alpha-5.56541890162681
beta1.36722762152273
S.D.0.231824281189568
T-STAT5.89768946767365
p-value5.57384172493935e-07
Lambda-0.367227621522732


Parameters (Session):
par1 = 4 ;
Parameters (R input):
par1 = 4 ;
R code (references can be found in the software module):
par1 <- as.numeric(par1)
(n <- length(x))
(np <- floor(n / par1))
arr <- array(NA,dim=c(par1,np))
j <- 0
k <- 1
for (i in 1:(np*par1))
{
j = j + 1
arr[j,k] <- x[i]
if (j == par1) {
j = 0
k=k+1
}
}
arr
arr.mean <- array(NA,dim=np)
arr.sd <- array(NA,dim=np)
arr.range <- array(NA,dim=np)
for (j in 1:np)
{
arr.mean[j] <- mean(arr[,j],na.rm=TRUE)
arr.sd[j] <- sd(arr[,j],na.rm=TRUE)
arr.range[j] <- max(arr[,j],na.rm=TRUE) - min(arr[,j],na.rm=TRUE)
}
arr.mean
arr.sd
arr.range
(lm1 <- lm(arr.sd~arr.mean))
(lnlm1 <- lm(log(arr.sd)~log(arr.mean)))
(lm2 <- lm(arr.range~arr.mean))
bitmap(file='test1.png')
plot(arr.mean,arr.sd,main='Standard Deviation-Mean Plot',xlab='mean',ylab='standard deviation')
dev.off()
bitmap(file='test2.png')
plot(arr.mean,arr.range,main='Range-Mean Plot',xlab='mean',ylab='range')
dev.off()
load(file='createtable')
a<-table.start()
a<-table.row.start(a)
a<-table.element(a,'Standard Deviation-Mean Plot',4,TRUE)
a<-table.row.end(a)
a<-table.row.start(a)
a<-table.element(a,'Section',header=TRUE)
a<-table.element(a,'Mean',header=TRUE)
a<-table.element(a,'Standard Deviation',header=TRUE)
a<-table.element(a,'Range',header=TRUE)
a<-table.row.end(a)
for (j in 1:np) {
a<-table.row.start(a)
a<-table.element(a,j,header=TRUE)
a<-table.element(a,arr.mean[j])
a<-table.element(a,arr.sd[j] )
a<-table.element(a,arr.range[j] )
a<-table.row.end(a)
}
a<-table.end(a)
table.save(a,file='mytable.tab')
a<-table.start()
a<-table.row.start(a)
a<-table.element(a,'Regression: S.E.(k) = alpha + beta * Mean(k)',2,TRUE)
a<-table.row.end(a)
a<-table.row.start(a)
a<-table.element(a,'alpha',header=TRUE)
a<-table.element(a,lm1$coefficients[[1]])
a<-table.row.end(a)
a<-table.row.start(a)
a<-table.element(a,'beta',header=TRUE)
a<-table.element(a,lm1$coefficients[[2]])
a<-table.row.end(a)
a<-table.row.start(a)
a<-table.element(a,'S.D.',header=TRUE)
a<-table.element(a,summary(lm1)$coefficients[2,2])
a<-table.row.end(a)
a<-table.row.start(a)
a<-table.element(a,'T-STAT',header=TRUE)
a<-table.element(a,summary(lm1)$coefficients[2,3])
a<-table.row.end(a)
a<-table.row.start(a)
a<-table.element(a,'p-value',header=TRUE)
a<-table.element(a,summary(lm1)$coefficients[2,4])
a<-table.row.end(a)
a<-table.end(a)
table.save(a,file='mytable1.tab')
a<-table.start()
a<-table.row.start(a)
a<-table.element(a,'Regression: ln S.E.(k) = alpha + beta * ln Mean(k)',2,TRUE)
a<-table.row.end(a)
a<-table.row.start(a)
a<-table.element(a,'alpha',header=TRUE)
a<-table.element(a,lnlm1$coefficients[[1]])
a<-table.row.end(a)
a<-table.row.start(a)
a<-table.element(a,'beta',header=TRUE)
a<-table.element(a,lnlm1$coefficients[[2]])
a<-table.row.end(a)
a<-table.row.start(a)
a<-table.element(a,'S.D.',header=TRUE)
a<-table.element(a,summary(lnlm1)$coefficients[2,2])
a<-table.row.end(a)
a<-table.row.start(a)
a<-table.element(a,'T-STAT',header=TRUE)
a<-table.element(a,summary(lnlm1)$coefficients[2,3])
a<-table.row.end(a)
a<-table.row.start(a)
a<-table.element(a,'p-value',header=TRUE)
a<-table.element(a,summary(lnlm1)$coefficients[2,4])
a<-table.row.end(a)
a<-table.row.start(a)
a<-table.element(a,'Lambda',header=TRUE)
a<-table.element(a,1-lnlm1$coefficients[[2]])
a<-table.row.end(a)
a<-table.end(a)
table.save(a,file='mytable2.tab')