Free Statistics

of Irreproducible Research!

Author's title

Author*Unverified author*
R Software ModulePatrick.Wessarwasp_demand_forecasting_croston.wasp
Title produced by softwareCroston Forecasting
Date of computationThu, 13 May 2010 12:10:42 +0000
Cite this page as followsStatistical Computations at FreeStatistics.org, Office for Research Development and Education, URL https://freestatistics.org/blog/index.php?v=date/2010/May/13/t1273752685m1u77qlii4i0esj.htm/, Retrieved Mon, 06 May 2024 07:04:18 +0000
Statistical Computations at FreeStatistics.org, Office for Research Development and Education, URL https://freestatistics.org/blog/index.php?pk=75891, Retrieved Mon, 06 May 2024 07:04:18 +0000
QR Codes:

Original text written by user:
IsPrivate?No (this computation is public)
User-defined keywordsB580,steven,coomans,thesis,Arima
Estimated Impact173
Family? (F = Feedback message, R = changed R code, M = changed R Module, P = changed Parameters, D = changed Data)
-       [Croston Forecasting] [B580,steven,cooma...] [2010-05-13 12:10:42] [d41d8cd98f00b204e9800998ecf8427e] [Current]
Feedback Forum

Post a new message
Dataseries X:
209
175
247.5
177
188.775
194.825
182.275
145.25
286.3
257.75
335
234.15
276.275
327.052
375.325
199.75
215.875
225
228.1
128.5
242.5
327.275
346.8
221.175
245.275
230.725
335.3
97.25
254.5
71.25
273.575
98.325
184.55
203.025
121.655
135
98.75
69.1
256.525
97.775
202.7
81.9
165.25
75.825
300
238.5
194.5
140.75
211.75
274.8


Summary of computational transaction
Raw Inputview raw input (R code)
Raw Outputview raw output of R engine
Computing time4 seconds
R Serverwessa.org @ wessa.org

\begin{tabular}{lllllllll}
\hline
Summary of computational transaction \tabularnewline
Raw Input & view raw input (R code)  \tabularnewline
Raw Output & view raw output of R engine  \tabularnewline
Computing time & 4 seconds \tabularnewline
R Server & wessa.org @ wessa.org \tabularnewline
\hline
\end{tabular}
%Source: https://freestatistics.org/blog/index.php?pk=75891&T=0

[TABLE]
[ROW][C]Summary of computational transaction[/C][/ROW]
[ROW][C]Raw Input[/C][C]view raw input (R code) [/C][/ROW]
[ROW][C]Raw Output[/C][C]view raw output of R engine [/C][/ROW]
[ROW][C]Computing time[/C][C]4 seconds[/C][/ROW]
[ROW][C]R Server[/C][C]wessa.org @ wessa.org[/C][/ROW]
[/TABLE]
Source: https://freestatistics.org/blog/index.php?pk=75891&T=0

Globally Unique Identifier (entire table): ba.freestatistics.org/blog/index.php?pk=75891&T=0

As an alternative you can also use a QR Code:  

The GUIDs for individual cells are displayed in the table below:

Summary of computational transaction
Raw Inputview raw input (R code)
Raw Outputview raw output of R engine
Computing time4 seconds
R Serverwessa.org @ wessa.org


Demand Forecast
PointForecast95% LB80% LB80% UB95% UB
51290.092600011906164.711430125015208.110259608816372.074940414995415.473769898796
52250.182660915376118.321277649685163.963136734334336.402185096417382.044044181066
53256.128240351882118.090524378032165.870229283377346.386251420387394.165956325732
54254.748706073570110.799417552184160.625325481500348.87208666564398.697994594956
55227.42122570565377.793740595633129.585071927426325.257379483880377.048710815672
56221.55969187880366.461752063714120.146600030886322.972783726721376.657631693893
57344.337146831027183.955235228063239.469051538935449.205242123119504.719058433992
58320.349189950263154.851926516825212.136345877905428.562034022621485.846453383702
59321.405086669725150.945910212448209.947822060074432.862351279375491.864263127001
60261.40161936920686.1209376373154146.791741914777376.011496823635436.682301101096
61325.611364128963145.929840264083208.123930673641443.098797584284505.292887993842
62365.487347271551181.250797659097245.021542568622485.95315197448549.723896884005
63320.74858836512798.7753658236304175.608099508750465.889077221504542.721810906624
64320.74858836512788.6462658592474168.985037034488472.512139695766552.850910871007
65320.74858836512778.9410932377222162.639165750575478.858010979679562.556083492532
66320.74858836512769.6106953920504156.53834652094484.958830209314571.886481338204
67320.74858836512760.614742289452150.656208954567490.840967775687580.882434440802
68320.74858836512751.9196567723955144.970798128234496.526378602021589.577519957859
69320.74858836512743.4971302112408139.463604023939502.033572706315598.000046519013
70320.74858836512735.3230330348051134.118849163133507.378327567121606.174143695449
71320.74858836512727.3765988658068128.922955141557512.574221588698614.120577864447
72320.74858836512719.6398026913181123.864136036754517.6330406935621.857374038936
73320.74858836512712.0968794809507118.932083649426522.565093080829629.400297249304
74320.7485883651274.73394632414676114.117720432279527.379456297975636.763230406108

\begin{tabular}{lllllllll}
\hline
Demand Forecast \tabularnewline
Point & Forecast & 95% LB & 80% LB & 80% UB & 95% UB \tabularnewline
51 & 290.092600011906 & 164.711430125015 & 208.110259608816 & 372.074940414995 & 415.473769898796 \tabularnewline
52 & 250.182660915376 & 118.321277649685 & 163.963136734334 & 336.402185096417 & 382.044044181066 \tabularnewline
53 & 256.128240351882 & 118.090524378032 & 165.870229283377 & 346.386251420387 & 394.165956325732 \tabularnewline
54 & 254.748706073570 & 110.799417552184 & 160.625325481500 & 348.87208666564 & 398.697994594956 \tabularnewline
55 & 227.421225705653 & 77.793740595633 & 129.585071927426 & 325.257379483880 & 377.048710815672 \tabularnewline
56 & 221.559691878803 & 66.461752063714 & 120.146600030886 & 322.972783726721 & 376.657631693893 \tabularnewline
57 & 344.337146831027 & 183.955235228063 & 239.469051538935 & 449.205242123119 & 504.719058433992 \tabularnewline
58 & 320.349189950263 & 154.851926516825 & 212.136345877905 & 428.562034022621 & 485.846453383702 \tabularnewline
59 & 321.405086669725 & 150.945910212448 & 209.947822060074 & 432.862351279375 & 491.864263127001 \tabularnewline
60 & 261.401619369206 & 86.1209376373154 & 146.791741914777 & 376.011496823635 & 436.682301101096 \tabularnewline
61 & 325.611364128963 & 145.929840264083 & 208.123930673641 & 443.098797584284 & 505.292887993842 \tabularnewline
62 & 365.487347271551 & 181.250797659097 & 245.021542568622 & 485.95315197448 & 549.723896884005 \tabularnewline
63 & 320.748588365127 & 98.7753658236304 & 175.608099508750 & 465.889077221504 & 542.721810906624 \tabularnewline
64 & 320.748588365127 & 88.6462658592474 & 168.985037034488 & 472.512139695766 & 552.850910871007 \tabularnewline
65 & 320.748588365127 & 78.9410932377222 & 162.639165750575 & 478.858010979679 & 562.556083492532 \tabularnewline
66 & 320.748588365127 & 69.6106953920504 & 156.53834652094 & 484.958830209314 & 571.886481338204 \tabularnewline
67 & 320.748588365127 & 60.614742289452 & 150.656208954567 & 490.840967775687 & 580.882434440802 \tabularnewline
68 & 320.748588365127 & 51.9196567723955 & 144.970798128234 & 496.526378602021 & 589.577519957859 \tabularnewline
69 & 320.748588365127 & 43.4971302112408 & 139.463604023939 & 502.033572706315 & 598.000046519013 \tabularnewline
70 & 320.748588365127 & 35.3230330348051 & 134.118849163133 & 507.378327567121 & 606.174143695449 \tabularnewline
71 & 320.748588365127 & 27.3765988658068 & 128.922955141557 & 512.574221588698 & 614.120577864447 \tabularnewline
72 & 320.748588365127 & 19.6398026913181 & 123.864136036754 & 517.6330406935 & 621.857374038936 \tabularnewline
73 & 320.748588365127 & 12.0968794809507 & 118.932083649426 & 522.565093080829 & 629.400297249304 \tabularnewline
74 & 320.748588365127 & 4.73394632414676 & 114.117720432279 & 527.379456297975 & 636.763230406108 \tabularnewline
\hline
\end{tabular}
%Source: https://freestatistics.org/blog/index.php?pk=75891&T=1

[TABLE]
[ROW][C]Demand Forecast[/C][/ROW]
[ROW][C]Point[/C][C]Forecast[/C][C]95% LB[/C][C]80% LB[/C][C]80% UB[/C][C]95% UB[/C][/ROW]
[ROW][C]51[/C][C]290.092600011906[/C][C]164.711430125015[/C][C]208.110259608816[/C][C]372.074940414995[/C][C]415.473769898796[/C][/ROW]
[ROW][C]52[/C][C]250.182660915376[/C][C]118.321277649685[/C][C]163.963136734334[/C][C]336.402185096417[/C][C]382.044044181066[/C][/ROW]
[ROW][C]53[/C][C]256.128240351882[/C][C]118.090524378032[/C][C]165.870229283377[/C][C]346.386251420387[/C][C]394.165956325732[/C][/ROW]
[ROW][C]54[/C][C]254.748706073570[/C][C]110.799417552184[/C][C]160.625325481500[/C][C]348.87208666564[/C][C]398.697994594956[/C][/ROW]
[ROW][C]55[/C][C]227.421225705653[/C][C]77.793740595633[/C][C]129.585071927426[/C][C]325.257379483880[/C][C]377.048710815672[/C][/ROW]
[ROW][C]56[/C][C]221.559691878803[/C][C]66.461752063714[/C][C]120.146600030886[/C][C]322.972783726721[/C][C]376.657631693893[/C][/ROW]
[ROW][C]57[/C][C]344.337146831027[/C][C]183.955235228063[/C][C]239.469051538935[/C][C]449.205242123119[/C][C]504.719058433992[/C][/ROW]
[ROW][C]58[/C][C]320.349189950263[/C][C]154.851926516825[/C][C]212.136345877905[/C][C]428.562034022621[/C][C]485.846453383702[/C][/ROW]
[ROW][C]59[/C][C]321.405086669725[/C][C]150.945910212448[/C][C]209.947822060074[/C][C]432.862351279375[/C][C]491.864263127001[/C][/ROW]
[ROW][C]60[/C][C]261.401619369206[/C][C]86.1209376373154[/C][C]146.791741914777[/C][C]376.011496823635[/C][C]436.682301101096[/C][/ROW]
[ROW][C]61[/C][C]325.611364128963[/C][C]145.929840264083[/C][C]208.123930673641[/C][C]443.098797584284[/C][C]505.292887993842[/C][/ROW]
[ROW][C]62[/C][C]365.487347271551[/C][C]181.250797659097[/C][C]245.021542568622[/C][C]485.95315197448[/C][C]549.723896884005[/C][/ROW]
[ROW][C]63[/C][C]320.748588365127[/C][C]98.7753658236304[/C][C]175.608099508750[/C][C]465.889077221504[/C][C]542.721810906624[/C][/ROW]
[ROW][C]64[/C][C]320.748588365127[/C][C]88.6462658592474[/C][C]168.985037034488[/C][C]472.512139695766[/C][C]552.850910871007[/C][/ROW]
[ROW][C]65[/C][C]320.748588365127[/C][C]78.9410932377222[/C][C]162.639165750575[/C][C]478.858010979679[/C][C]562.556083492532[/C][/ROW]
[ROW][C]66[/C][C]320.748588365127[/C][C]69.6106953920504[/C][C]156.53834652094[/C][C]484.958830209314[/C][C]571.886481338204[/C][/ROW]
[ROW][C]67[/C][C]320.748588365127[/C][C]60.614742289452[/C][C]150.656208954567[/C][C]490.840967775687[/C][C]580.882434440802[/C][/ROW]
[ROW][C]68[/C][C]320.748588365127[/C][C]51.9196567723955[/C][C]144.970798128234[/C][C]496.526378602021[/C][C]589.577519957859[/C][/ROW]
[ROW][C]69[/C][C]320.748588365127[/C][C]43.4971302112408[/C][C]139.463604023939[/C][C]502.033572706315[/C][C]598.000046519013[/C][/ROW]
[ROW][C]70[/C][C]320.748588365127[/C][C]35.3230330348051[/C][C]134.118849163133[/C][C]507.378327567121[/C][C]606.174143695449[/C][/ROW]
[ROW][C]71[/C][C]320.748588365127[/C][C]27.3765988658068[/C][C]128.922955141557[/C][C]512.574221588698[/C][C]614.120577864447[/C][/ROW]
[ROW][C]72[/C][C]320.748588365127[/C][C]19.6398026913181[/C][C]123.864136036754[/C][C]517.6330406935[/C][C]621.857374038936[/C][/ROW]
[ROW][C]73[/C][C]320.748588365127[/C][C]12.0968794809507[/C][C]118.932083649426[/C][C]522.565093080829[/C][C]629.400297249304[/C][/ROW]
[ROW][C]74[/C][C]320.748588365127[/C][C]4.73394632414676[/C][C]114.117720432279[/C][C]527.379456297975[/C][C]636.763230406108[/C][/ROW]
[/TABLE]
Source: https://freestatistics.org/blog/index.php?pk=75891&T=1

Globally Unique Identifier (entire table): ba.freestatistics.org/blog/index.php?pk=75891&T=1

As an alternative you can also use a QR Code:  

The GUIDs for individual cells are displayed in the table below:

Demand Forecast
PointForecast95% LB80% LB80% UB95% UB
51290.092600011906164.711430125015208.110259608816372.074940414995415.473769898796
52250.182660915376118.321277649685163.963136734334336.402185096417382.044044181066
53256.128240351882118.090524378032165.870229283377346.386251420387394.165956325732
54254.748706073570110.799417552184160.625325481500348.87208666564398.697994594956
55227.42122570565377.793740595633129.585071927426325.257379483880377.048710815672
56221.55969187880366.461752063714120.146600030886322.972783726721376.657631693893
57344.337146831027183.955235228063239.469051538935449.205242123119504.719058433992
58320.349189950263154.851926516825212.136345877905428.562034022621485.846453383702
59321.405086669725150.945910212448209.947822060074432.862351279375491.864263127001
60261.40161936920686.1209376373154146.791741914777376.011496823635436.682301101096
61325.611364128963145.929840264083208.123930673641443.098797584284505.292887993842
62365.487347271551181.250797659097245.021542568622485.95315197448549.723896884005
63320.74858836512798.7753658236304175.608099508750465.889077221504542.721810906624
64320.74858836512788.6462658592474168.985037034488472.512139695766552.850910871007
65320.74858836512778.9410932377222162.639165750575478.858010979679562.556083492532
66320.74858836512769.6106953920504156.53834652094484.958830209314571.886481338204
67320.74858836512760.614742289452150.656208954567490.840967775687580.882434440802
68320.74858836512751.9196567723955144.970798128234496.526378602021589.577519957859
69320.74858836512743.4971302112408139.463604023939502.033572706315598.000046519013
70320.74858836512735.3230330348051134.118849163133507.378327567121606.174143695449
71320.74858836512727.3765988658068128.922955141557512.574221588698614.120577864447
72320.74858836512719.6398026913181123.864136036754517.6330406935621.857374038936
73320.74858836512712.0968794809507118.932083649426522.565093080829629.400297249304
74320.7485883651274.73394632414676114.117720432279527.379456297975636.763230406108


Actuals and Interpolation
TimeActualForecast
1209208.791000220112
2175198.426779339075
3247.5203.378258089298
4177206.916502799148
5188.775198.493885113137
6194.825196.263512901256
7182.275193.640749579656
8145.25183.618255052768
9286.3194.973766357325
10257.75219.947196737977
11335245.338121076719
12234.15257.514432415318
13276.275258.505048267576
14327.052255.53357353954
15375.325315.322448001021
16199.75293.272867505843
17215.875268.44574756024
18225254.391240106182
19228.1239.544311419872
20128.5213.489073070484
21242.5254.053084952268
22327.275243.25421812959
23346.8305.330568389782
24221.175267.255114086196
25245.275270.024693610743
26230.725298.681762847649
27335.3287.508494249009
2897.25214.89352137417
29254.5186.707631098946
3071.25207.601739355676
31273.575173.554668621071
3298.325154.336231589396
33184.55166.278743842984
34203.025228.807116636272
35121.655209.003839800871
36135135.659535200178
3798.75139.943125963237
3869.192.208844377748
39256.525147.122521391435
4097.77584.4553816480669
41202.7184.750081665235
4281.971.8893513924464
43165.25199.790371621642
4475.825107.963672206709
45300136.157711472038
46238.5164.294723220295
47194.5142.880720140488
48140.75196.613502921185
49211.75152.099346335145
50274.8175.013624568627

\begin{tabular}{lllllllll}
\hline
Actuals and Interpolation \tabularnewline
Time & Actual & Forecast \tabularnewline
1 & 209 & 208.791000220112 \tabularnewline
2 & 175 & 198.426779339075 \tabularnewline
3 & 247.5 & 203.378258089298 \tabularnewline
4 & 177 & 206.916502799148 \tabularnewline
5 & 188.775 & 198.493885113137 \tabularnewline
6 & 194.825 & 196.263512901256 \tabularnewline
7 & 182.275 & 193.640749579656 \tabularnewline
8 & 145.25 & 183.618255052768 \tabularnewline
9 & 286.3 & 194.973766357325 \tabularnewline
10 & 257.75 & 219.947196737977 \tabularnewline
11 & 335 & 245.338121076719 \tabularnewline
12 & 234.15 & 257.514432415318 \tabularnewline
13 & 276.275 & 258.505048267576 \tabularnewline
14 & 327.052 & 255.53357353954 \tabularnewline
15 & 375.325 & 315.322448001021 \tabularnewline
16 & 199.75 & 293.272867505843 \tabularnewline
17 & 215.875 & 268.44574756024 \tabularnewline
18 & 225 & 254.391240106182 \tabularnewline
19 & 228.1 & 239.544311419872 \tabularnewline
20 & 128.5 & 213.489073070484 \tabularnewline
21 & 242.5 & 254.053084952268 \tabularnewline
22 & 327.275 & 243.25421812959 \tabularnewline
23 & 346.8 & 305.330568389782 \tabularnewline
24 & 221.175 & 267.255114086196 \tabularnewline
25 & 245.275 & 270.024693610743 \tabularnewline
26 & 230.725 & 298.681762847649 \tabularnewline
27 & 335.3 & 287.508494249009 \tabularnewline
28 & 97.25 & 214.89352137417 \tabularnewline
29 & 254.5 & 186.707631098946 \tabularnewline
30 & 71.25 & 207.601739355676 \tabularnewline
31 & 273.575 & 173.554668621071 \tabularnewline
32 & 98.325 & 154.336231589396 \tabularnewline
33 & 184.55 & 166.278743842984 \tabularnewline
34 & 203.025 & 228.807116636272 \tabularnewline
35 & 121.655 & 209.003839800871 \tabularnewline
36 & 135 & 135.659535200178 \tabularnewline
37 & 98.75 & 139.943125963237 \tabularnewline
38 & 69.1 & 92.208844377748 \tabularnewline
39 & 256.525 & 147.122521391435 \tabularnewline
40 & 97.775 & 84.4553816480669 \tabularnewline
41 & 202.7 & 184.750081665235 \tabularnewline
42 & 81.9 & 71.8893513924464 \tabularnewline
43 & 165.25 & 199.790371621642 \tabularnewline
44 & 75.825 & 107.963672206709 \tabularnewline
45 & 300 & 136.157711472038 \tabularnewline
46 & 238.5 & 164.294723220295 \tabularnewline
47 & 194.5 & 142.880720140488 \tabularnewline
48 & 140.75 & 196.613502921185 \tabularnewline
49 & 211.75 & 152.099346335145 \tabularnewline
50 & 274.8 & 175.013624568627 \tabularnewline
\hline
\end{tabular}
%Source: https://freestatistics.org/blog/index.php?pk=75891&T=2

[TABLE]
[ROW][C]Actuals and Interpolation[/C][/ROW]
[ROW][C]Time[/C][C]Actual[/C][C]Forecast[/C][/ROW]
[ROW][C]1[/C][C]209[/C][C]208.791000220112[/C][/ROW]
[ROW][C]2[/C][C]175[/C][C]198.426779339075[/C][/ROW]
[ROW][C]3[/C][C]247.5[/C][C]203.378258089298[/C][/ROW]
[ROW][C]4[/C][C]177[/C][C]206.916502799148[/C][/ROW]
[ROW][C]5[/C][C]188.775[/C][C]198.493885113137[/C][/ROW]
[ROW][C]6[/C][C]194.825[/C][C]196.263512901256[/C][/ROW]
[ROW][C]7[/C][C]182.275[/C][C]193.640749579656[/C][/ROW]
[ROW][C]8[/C][C]145.25[/C][C]183.618255052768[/C][/ROW]
[ROW][C]9[/C][C]286.3[/C][C]194.973766357325[/C][/ROW]
[ROW][C]10[/C][C]257.75[/C][C]219.947196737977[/C][/ROW]
[ROW][C]11[/C][C]335[/C][C]245.338121076719[/C][/ROW]
[ROW][C]12[/C][C]234.15[/C][C]257.514432415318[/C][/ROW]
[ROW][C]13[/C][C]276.275[/C][C]258.505048267576[/C][/ROW]
[ROW][C]14[/C][C]327.052[/C][C]255.53357353954[/C][/ROW]
[ROW][C]15[/C][C]375.325[/C][C]315.322448001021[/C][/ROW]
[ROW][C]16[/C][C]199.75[/C][C]293.272867505843[/C][/ROW]
[ROW][C]17[/C][C]215.875[/C][C]268.44574756024[/C][/ROW]
[ROW][C]18[/C][C]225[/C][C]254.391240106182[/C][/ROW]
[ROW][C]19[/C][C]228.1[/C][C]239.544311419872[/C][/ROW]
[ROW][C]20[/C][C]128.5[/C][C]213.489073070484[/C][/ROW]
[ROW][C]21[/C][C]242.5[/C][C]254.053084952268[/C][/ROW]
[ROW][C]22[/C][C]327.275[/C][C]243.25421812959[/C][/ROW]
[ROW][C]23[/C][C]346.8[/C][C]305.330568389782[/C][/ROW]
[ROW][C]24[/C][C]221.175[/C][C]267.255114086196[/C][/ROW]
[ROW][C]25[/C][C]245.275[/C][C]270.024693610743[/C][/ROW]
[ROW][C]26[/C][C]230.725[/C][C]298.681762847649[/C][/ROW]
[ROW][C]27[/C][C]335.3[/C][C]287.508494249009[/C][/ROW]
[ROW][C]28[/C][C]97.25[/C][C]214.89352137417[/C][/ROW]
[ROW][C]29[/C][C]254.5[/C][C]186.707631098946[/C][/ROW]
[ROW][C]30[/C][C]71.25[/C][C]207.601739355676[/C][/ROW]
[ROW][C]31[/C][C]273.575[/C][C]173.554668621071[/C][/ROW]
[ROW][C]32[/C][C]98.325[/C][C]154.336231589396[/C][/ROW]
[ROW][C]33[/C][C]184.55[/C][C]166.278743842984[/C][/ROW]
[ROW][C]34[/C][C]203.025[/C][C]228.807116636272[/C][/ROW]
[ROW][C]35[/C][C]121.655[/C][C]209.003839800871[/C][/ROW]
[ROW][C]36[/C][C]135[/C][C]135.659535200178[/C][/ROW]
[ROW][C]37[/C][C]98.75[/C][C]139.943125963237[/C][/ROW]
[ROW][C]38[/C][C]69.1[/C][C]92.208844377748[/C][/ROW]
[ROW][C]39[/C][C]256.525[/C][C]147.122521391435[/C][/ROW]
[ROW][C]40[/C][C]97.775[/C][C]84.4553816480669[/C][/ROW]
[ROW][C]41[/C][C]202.7[/C][C]184.750081665235[/C][/ROW]
[ROW][C]42[/C][C]81.9[/C][C]71.8893513924464[/C][/ROW]
[ROW][C]43[/C][C]165.25[/C][C]199.790371621642[/C][/ROW]
[ROW][C]44[/C][C]75.825[/C][C]107.963672206709[/C][/ROW]
[ROW][C]45[/C][C]300[/C][C]136.157711472038[/C][/ROW]
[ROW][C]46[/C][C]238.5[/C][C]164.294723220295[/C][/ROW]
[ROW][C]47[/C][C]194.5[/C][C]142.880720140488[/C][/ROW]
[ROW][C]48[/C][C]140.75[/C][C]196.613502921185[/C][/ROW]
[ROW][C]49[/C][C]211.75[/C][C]152.099346335145[/C][/ROW]
[ROW][C]50[/C][C]274.8[/C][C]175.013624568627[/C][/ROW]
[/TABLE]
Source: https://freestatistics.org/blog/index.php?pk=75891&T=2

Globally Unique Identifier (entire table): ba.freestatistics.org/blog/index.php?pk=75891&T=2

As an alternative you can also use a QR Code:  

The GUIDs for individual cells are displayed in the table below:

Actuals and Interpolation
TimeActualForecast
1209208.791000220112
2175198.426779339075
3247.5203.378258089298
4177206.916502799148
5188.775198.493885113137
6194.825196.263512901256
7182.275193.640749579656
8145.25183.618255052768
9286.3194.973766357325
10257.75219.947196737977
11335245.338121076719
12234.15257.514432415318
13276.275258.505048267576
14327.052255.53357353954
15375.325315.322448001021
16199.75293.272867505843
17215.875268.44574756024
18225254.391240106182
19228.1239.544311419872
20128.5213.489073070484
21242.5254.053084952268
22327.275243.25421812959
23346.8305.330568389782
24221.175267.255114086196
25245.275270.024693610743
26230.725298.681762847649
27335.3287.508494249009
2897.25214.89352137417
29254.5186.707631098946
3071.25207.601739355676
31273.575173.554668621071
3298.325154.336231589396
33184.55166.278743842984
34203.025228.807116636272
35121.655209.003839800871
36135135.659535200178
3798.75139.943125963237
3869.192.208844377748
39256.525147.122521391435
4097.77584.4553816480669
41202.7184.750081665235
4281.971.8893513924464
43165.25199.790371621642
4475.825107.963672206709
45300136.157711472038
46238.5164.294723220295
47194.5142.880720140488
48140.75196.613502921185
49211.75152.099346335145
50274.8175.013624568627


\begin{tabular}{lllllllll}
\hline
What is next? \tabularnewline
Simulate Time Series \tabularnewline
Generate Forecasts \tabularnewline
Forecast Analysis \tabularnewline
\hline
\end{tabular}
%Source: https://freestatistics.org/blog/index.php?pk=75891&T=3

[TABLE]
[ROW][C]What is next?[/C][/ROW]
[ROW][C]Simulate Time Series[/C][/ROW]
[ROW][C]Generate Forecasts[/C][/ROW]
[ROW][C]Forecast Analysis[/C][/ROW]
[/TABLE]
Source: https://freestatistics.org/blog/index.php?pk=75891&T=3

Globally Unique Identifier (entire table): ba.freestatistics.org/blog/index.php?pk=75891&T=3

As an alternative you can also use a QR Code:  

The GUIDs for individual cells are displayed in the table below:

What is next?
Simulate Time Series
Generate Forecasts
Forecast Analysis


Parameters (Session):
par1 = Input box ; par2 = ARIMA ; par3 = NA ; par4 = NA ; par5 = ZZZ ; par6 = 12 ; par7 = dum ; par8 = dumresult ; par9 = 3 ; par10 = 0.1 ;
Parameters (R input):
par1 = Input box ; par2 = ARIMA ; par3 = NA ; par4 = NA ; par5 = ZZZ ; par6 = 12 ; par7 = dum ; par8 = dumresult ; par9 = 3 ; par10 = 0.1 ;
R code (references can be found in the software module):
if(par3!='NA') par3 <- as.numeric(par3) else par3 <- NA
if(par4!='NA') par4 <- as.numeric(par4) else par4 <- NA
par6 <- as.numeric(par6) #Seasonal Period
par9 <- as.numeric(par9) #Forecast Horizon
par10 <- as.numeric(par10) #Alpha
library(forecast)
if (par1 == 'CSV') {
xarr <- read.csv(file=paste('tmp/',par7,'.csv',sep=''),header=T)
numseries <- length(xarr[1,])-1
n <- length(xarr[,1])
nmh <- n - par9
nmhp1 <- nmh + 1
rarr <- array(NA,dim=c(n,numseries))
farr <- array(NA,dim=c(n,numseries))
parr <- array(NA,dim=c(numseries,8))
colnames(parr) = list('ME','RMSE','MAE','MPE','MAPE','MASE','ACF1','TheilU')
for(i in 1:numseries) {
sindex <- i+1
x <- xarr[,sindex]
if(par2=='Croston') {
if (i==1) m <- croston(x,alpha=par10)
if (i==1) mydemand <- m$model$demand[]
fit <- croston(x[1:nmh],h=par9,alpha=par10)
}
if(par2=='ARIMA') {
m <- auto.arima(ts(x,freq=par6),d=par3,D=par4)
mydemand <- forecast(m)
fit <- auto.arima(ts(x[1:nmh],freq=par6),d=par3,D=par4)
}
if(par2=='ETS') {
m <- ets(ts(x,freq=par6),model=par5)
mydemand <- forecast(m)
fit <- ets(ts(x[1:nmh],freq=par6),model=par5)
}
try(rarr[,i] <- mydemand$resid,silent=T)
try(farr[,i] <- mydemand$mean,silent=T)
if (par2!='Croston') parr[i,] <- accuracy(forecast(fit,par9),x[nmhp1:n])
if (par2=='Croston') parr[i,] <- accuracy(fit,x[nmhp1:n])
}
write.csv(farr,file=paste('tmp/',par8,'_f.csv',sep=''))
write.csv(rarr,file=paste('tmp/',par8,'_r.csv',sep=''))
write.csv(parr,file=paste('tmp/',par8,'_p.csv',sep=''))
}
if (par1 == 'Input box') {
numseries <- 1
n <- length(x)
if(par2=='Croston') {
m <- croston(x)
mydemand <- m$model$demand[]
}
if(par2=='ARIMA') {
m <- auto.arima(ts(x,freq=par6),d=par3,D=par4)
mydemand <- forecast(m)
}
if(par2=='ETS') {
m <- ets(ts(x,freq=par6),model=par5)
mydemand <- forecast(m)
}
summary(m)
}
bitmap(file='test1.png')
op <- par(mfrow=c(2,1))
if (par2=='Croston') plot(m)
if ((par2=='ARIMA') | par2=='ETS') plot(forecast(m))
plot(mydemand$resid,type='l',main='Residuals', ylab='residual value', xlab='time')
par(op)
dev.off()
bitmap(file='pic2.png')
op <- par(mfrow=c(2,2))
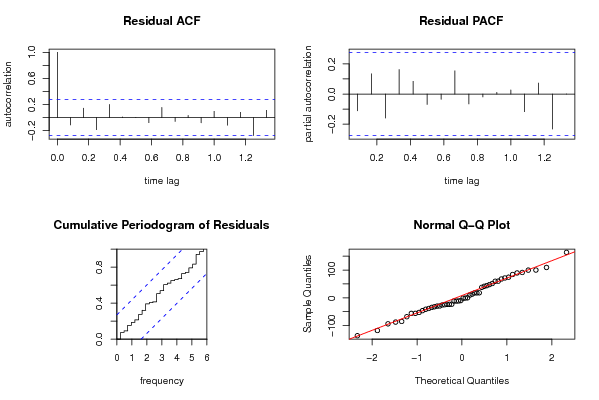
acf(mydemand$resid, lag.max=n/3, main='Residual ACF', ylab='autocorrelation', xlab='time lag')
pacf(mydemand$resid,lag.max=n/3, main='Residual PACF', ylab='partial autocorrelation', xlab='time lag')
cpgram(mydemand$resid, main='Cumulative Periodogram of Residuals')
qqnorm(mydemand$resid); qqline(mydemand$resid, col=2)
par(op)
dev.off()
load(file='createtable')
a<-table.start()
a<-table.row.start(a)
a<-table.element(a,'Demand Forecast',6,TRUE)
a<-table.row.end(a)
a<-table.row.start(a)
a<-table.element(a,'Point',header=TRUE)
a<-table.element(a,'Forecast',header=TRUE)
a<-table.element(a,'95% LB',header=TRUE)
a<-table.element(a,'80% LB',header=TRUE)
a<-table.element(a,'80% UB',header=TRUE)
a<-table.element(a,'95% UB',header=TRUE)
a<-table.row.end(a)
for (i in 1:length(mydemand$mean)) {
a<-table.row.start(a)
a<-table.element(a,i+n,header=TRUE)
a<-table.element(a,as.numeric(mydemand$mean[i]))
a<-table.element(a,as.numeric(mydemand$lower[i,2]))
a<-table.element(a,as.numeric(mydemand$lower[i,1]))
a<-table.element(a,as.numeric(mydemand$upper[i,1]))
a<-table.element(a,as.numeric(mydemand$upper[i,2]))
a<-table.row.end(a)
}
a<-table.end(a)
table.save(a,file='mytable.tab')
a<-table.start()
a<-table.row.start(a)
a<-table.element(a,'Actuals and Interpolation',3,TRUE)
a<-table.row.end(a)
a<-table.row.start(a)
a<-table.element(a,'Time',header=TRUE)
a<-table.element(a,'Actual',header=TRUE)
a<-table.element(a,'Forecast',header=TRUE)
a<-table.row.end(a)
for (i in 1:n) {
a<-table.row.start(a)
a<-table.element(a,i,header=TRUE)
a<-table.element(a,x[i])
a<-table.element(a,x[i] - as.numeric(m$resid[i]))
a<-table.row.end(a)
}
a<-table.end(a)
table.save(a,file='mytable1.tab')
a<-table.start()
a<-table.row.start(a)
a<-table.element(a,'What is next?',1,TRUE)
a<-table.row.end(a)
a<-table.row.start(a)
a<-table.element(a,hyperlink(paste('https://automated.biganalytics.eu/Patrick.Wessa/rwasp_demand_forecasting_simulate.wasp',sep=''),'Simulate Time Series','',target=''))
a<-table.row.end(a)
a<-table.row.start(a)
a<-table.element(a,hyperlink(paste('https://automated.biganalytics.eu/Patrick.Wessa/rwasp_demand_forecasting_croston.wasp',sep=''),'Generate Forecasts','',target=''))
a<-table.row.end(a)
a<-table.row.start(a)
a<-table.element(a,hyperlink(paste('https://automated.biganalytics.eu/Patrick.Wessa/rwasp_demand_forecasting_analysis.wasp',sep=''),'Forecast Analysis','',target=''))
a<-table.row.end(a)
a<-table.end(a)
table.save(a,file='mytable0.tab')
-SERVER-wessa.org