Free Statistics

of Irreproducible Research!

Author's title

Author*Unverified author*
R Software ModulePatrick.Wessarwasp_demand_forecasting_croston.wasp
Title produced by softwareCroston Forecasting
Date of computationThu, 13 May 2010 13:03:06 +0000
Cite this page as followsStatistical Computations at FreeStatistics.org, Office for Research Development and Education, URL https://freestatistics.org/blog/index.php?v=date/2010/May/13/t12737558189y8duvm2wyql1t0.htm/, Retrieved Sun, 05 May 2024 23:07:22 +0000
Statistical Computations at FreeStatistics.org, Office for Research Development and Education, URL https://freestatistics.org/blog/index.php?pk=75916, Retrieved Sun, 05 May 2024 23:07:22 +0000
QR Codes:

Original text written by user:
IsPrivate?No (this computation is public)
User-defined keywordsB382,steven,coomans,thesis,ETS,per2maand
Estimated Impact119
Family? (F = Feedback message, R = changed R code, M = changed R Module, P = changed Parameters, D = changed Data)
-       [Croston Forecasting] [B382,steven,cooma...] [2010-05-13 13:03:06] [d41d8cd98f00b204e9800998ecf8427e] [Current]
Feedback Forum

Post a new message
Dataseries X:
285
215.375
313.725
256.7625
273.79
173.0125
174.875
258.2625
222.65
231.7375
150.778
144.1375
136.15
152.875
238.375
147.8
35.425
80.375
143.375
194.8875
190.43
122.525
153.125
79.6
182.8625


Summary of computational transaction
Raw Inputview raw input (R code)
Raw Outputview raw output of R engine
Computing time7 seconds
R Serverwessa.org @ wessa.org

\begin{tabular}{lllllllll}
\hline
Summary of computational transaction \tabularnewline
Raw Input & view raw input (R code)  \tabularnewline
Raw Output & view raw output of R engine  \tabularnewline
Computing time & 7 seconds \tabularnewline
R Server & wessa.org @ wessa.org \tabularnewline
\hline
\end{tabular}
%Source: https://freestatistics.org/blog/index.php?pk=75916&T=0

[TABLE]
[ROW][C]Summary of computational transaction[/C][/ROW]
[ROW][C]Raw Input[/C][C]view raw input (R code) [/C][/ROW]
[ROW][C]Raw Output[/C][C]view raw output of R engine [/C][/ROW]
[ROW][C]Computing time[/C][C]7 seconds[/C][/ROW]
[ROW][C]R Server[/C][C]wessa.org @ wessa.org[/C][/ROW]
[/TABLE]
Source: https://freestatistics.org/blog/index.php?pk=75916&T=0

Globally Unique Identifier (entire table): ba.freestatistics.org/blog/index.php?pk=75916&T=0

As an alternative you can also use a QR Code:  

The GUIDs for individual cells are displayed in the table below:

Summary of computational transaction
Raw Inputview raw input (R code)
Raw Outputview raw output of R engine
Computing time7 seconds
R Serverwessa.org @ wessa.org


Demand Forecast
PointForecast95% LB80% LB80% UB95% UB
26130.26085185559435.234103642514868.1262009631886192.395502748000225.287600068673
27128.56637287431633.539620602319866.4317193279275190.701026420705223.593125146313
28127.00416337897031.977404343459664.869505410157189.138821347782222.030922414480
29125.56389853395530.537129632984463.4292341144642187.698562953445220.590667434925
30124.23605945093429.209277307510262.1013863726688186.370732529200219.262841594358
31123.01187027732627.985071338467760.8771862171164185.146554337536218.038669216185
32121.88324019560726.856420812034959.7485427673175184.017937623896216.910059579179
33120.84270995010025.815866439809858.7079967461974182.977423154002215.869553460389
34119.88340254783224.856531246295857.7486711722104182.018133923453214.910273849367
35118.99897780763923.972075106938556.8642259012073181.133729714070214.025880508339
36118.18359045712223.156652835954156.0488157174243180.318365196821213.210528078291
37117.43185150052522.404875546695955.2970516964473179.566651304603212.458827454354
38116.73879260218921.711775028969854.6039655846547178.873619619723211.765810175408
39116.09983325021221.072770907682253.964976959599178.234689540825211.126895592742
40115.51075048328020.483640365614553.375862954185177.645638012375210.537860600946
41114.96765098059319.940490230085352.8327303444618177.102571616724209.994811731101
42114.46694533042519.439731238906952.331989816482176.601900844369209.494159421944
43114.00532430726218.978054315462251.8703322420894176.140316372435209.032594299062
44113.57973700071918.552408696018151.4447068067895175.714767194648208.607065305419
45113.18737065169518.159981764650951.0523008451006175.322440458289208.214759538738
46112.82563206250517.798180462449250.6905212500763174.960742874933207.85308366256
47112.49213045811217.464614148076850.3569773341021174.627283582121207.519646768147
48112.18466168520117.157078796377650.0494650276616174.319858342741207.212244574025
49111.90119364465916.873542430551949.7659523116178174.0364349777206.928844858766

\begin{tabular}{lllllllll}
\hline
Demand Forecast \tabularnewline
Point & Forecast & 95% LB & 80% LB & 80% UB & 95% UB \tabularnewline
26 & 130.260851855594 & 35.2341036425148 & 68.1262009631886 & 192.395502748000 & 225.287600068673 \tabularnewline
27 & 128.566372874316 & 33.5396206023198 & 66.4317193279275 & 190.701026420705 & 223.593125146313 \tabularnewline
28 & 127.004163378970 & 31.9774043434596 & 64.869505410157 & 189.138821347782 & 222.030922414480 \tabularnewline
29 & 125.563898533955 & 30.5371296329844 & 63.4292341144642 & 187.698562953445 & 220.590667434925 \tabularnewline
30 & 124.236059450934 & 29.2092773075102 & 62.1013863726688 & 186.370732529200 & 219.262841594358 \tabularnewline
31 & 123.011870277326 & 27.9850713384677 & 60.8771862171164 & 185.146554337536 & 218.038669216185 \tabularnewline
32 & 121.883240195607 & 26.8564208120349 & 59.7485427673175 & 184.017937623896 & 216.910059579179 \tabularnewline
33 & 120.842709950100 & 25.8158664398098 & 58.7079967461974 & 182.977423154002 & 215.869553460389 \tabularnewline
34 & 119.883402547832 & 24.8565312462958 & 57.7486711722104 & 182.018133923453 & 214.910273849367 \tabularnewline
35 & 118.998977807639 & 23.9720751069385 & 56.8642259012073 & 181.133729714070 & 214.025880508339 \tabularnewline
36 & 118.183590457122 & 23.1566528359541 & 56.0488157174243 & 180.318365196821 & 213.210528078291 \tabularnewline
37 & 117.431851500525 & 22.4048755466959 & 55.2970516964473 & 179.566651304603 & 212.458827454354 \tabularnewline
38 & 116.738792602189 & 21.7117750289698 & 54.6039655846547 & 178.873619619723 & 211.765810175408 \tabularnewline
39 & 116.099833250212 & 21.0727709076822 & 53.964976959599 & 178.234689540825 & 211.126895592742 \tabularnewline
40 & 115.510750483280 & 20.4836403656145 & 53.375862954185 & 177.645638012375 & 210.537860600946 \tabularnewline
41 & 114.967650980593 & 19.9404902300853 & 52.8327303444618 & 177.102571616724 & 209.994811731101 \tabularnewline
42 & 114.466945330425 & 19.4397312389069 & 52.331989816482 & 176.601900844369 & 209.494159421944 \tabularnewline
43 & 114.005324307262 & 18.9780543154622 & 51.8703322420894 & 176.140316372435 & 209.032594299062 \tabularnewline
44 & 113.579737000719 & 18.5524086960181 & 51.4447068067895 & 175.714767194648 & 208.607065305419 \tabularnewline
45 & 113.187370651695 & 18.1599817646509 & 51.0523008451006 & 175.322440458289 & 208.214759538738 \tabularnewline
46 & 112.825632062505 & 17.7981804624492 & 50.6905212500763 & 174.960742874933 & 207.85308366256 \tabularnewline
47 & 112.492130458112 & 17.4646141480768 & 50.3569773341021 & 174.627283582121 & 207.519646768147 \tabularnewline
48 & 112.184661685201 & 17.1570787963776 & 50.0494650276616 & 174.319858342741 & 207.212244574025 \tabularnewline
49 & 111.901193644659 & 16.8735424305519 & 49.7659523116178 & 174.0364349777 & 206.928844858766 \tabularnewline
\hline
\end{tabular}
%Source: https://freestatistics.org/blog/index.php?pk=75916&T=1

[TABLE]
[ROW][C]Demand Forecast[/C][/ROW]
[ROW][C]Point[/C][C]Forecast[/C][C]95% LB[/C][C]80% LB[/C][C]80% UB[/C][C]95% UB[/C][/ROW]
[ROW][C]26[/C][C]130.260851855594[/C][C]35.2341036425148[/C][C]68.1262009631886[/C][C]192.395502748000[/C][C]225.287600068673[/C][/ROW]
[ROW][C]27[/C][C]128.566372874316[/C][C]33.5396206023198[/C][C]66.4317193279275[/C][C]190.701026420705[/C][C]223.593125146313[/C][/ROW]
[ROW][C]28[/C][C]127.004163378970[/C][C]31.9774043434596[/C][C]64.869505410157[/C][C]189.138821347782[/C][C]222.030922414480[/C][/ROW]
[ROW][C]29[/C][C]125.563898533955[/C][C]30.5371296329844[/C][C]63.4292341144642[/C][C]187.698562953445[/C][C]220.590667434925[/C][/ROW]
[ROW][C]30[/C][C]124.236059450934[/C][C]29.2092773075102[/C][C]62.1013863726688[/C][C]186.370732529200[/C][C]219.262841594358[/C][/ROW]
[ROW][C]31[/C][C]123.011870277326[/C][C]27.9850713384677[/C][C]60.8771862171164[/C][C]185.146554337536[/C][C]218.038669216185[/C][/ROW]
[ROW][C]32[/C][C]121.883240195607[/C][C]26.8564208120349[/C][C]59.7485427673175[/C][C]184.017937623896[/C][C]216.910059579179[/C][/ROW]
[ROW][C]33[/C][C]120.842709950100[/C][C]25.8158664398098[/C][C]58.7079967461974[/C][C]182.977423154002[/C][C]215.869553460389[/C][/ROW]
[ROW][C]34[/C][C]119.883402547832[/C][C]24.8565312462958[/C][C]57.7486711722104[/C][C]182.018133923453[/C][C]214.910273849367[/C][/ROW]
[ROW][C]35[/C][C]118.998977807639[/C][C]23.9720751069385[/C][C]56.8642259012073[/C][C]181.133729714070[/C][C]214.025880508339[/C][/ROW]
[ROW][C]36[/C][C]118.183590457122[/C][C]23.1566528359541[/C][C]56.0488157174243[/C][C]180.318365196821[/C][C]213.210528078291[/C][/ROW]
[ROW][C]37[/C][C]117.431851500525[/C][C]22.4048755466959[/C][C]55.2970516964473[/C][C]179.566651304603[/C][C]212.458827454354[/C][/ROW]
[ROW][C]38[/C][C]116.738792602189[/C][C]21.7117750289698[/C][C]54.6039655846547[/C][C]178.873619619723[/C][C]211.765810175408[/C][/ROW]
[ROW][C]39[/C][C]116.099833250212[/C][C]21.0727709076822[/C][C]53.964976959599[/C][C]178.234689540825[/C][C]211.126895592742[/C][/ROW]
[ROW][C]40[/C][C]115.510750483280[/C][C]20.4836403656145[/C][C]53.375862954185[/C][C]177.645638012375[/C][C]210.537860600946[/C][/ROW]
[ROW][C]41[/C][C]114.967650980593[/C][C]19.9404902300853[/C][C]52.8327303444618[/C][C]177.102571616724[/C][C]209.994811731101[/C][/ROW]
[ROW][C]42[/C][C]114.466945330425[/C][C]19.4397312389069[/C][C]52.331989816482[/C][C]176.601900844369[/C][C]209.494159421944[/C][/ROW]
[ROW][C]43[/C][C]114.005324307262[/C][C]18.9780543154622[/C][C]51.8703322420894[/C][C]176.140316372435[/C][C]209.032594299062[/C][/ROW]
[ROW][C]44[/C][C]113.579737000719[/C][C]18.5524086960181[/C][C]51.4447068067895[/C][C]175.714767194648[/C][C]208.607065305419[/C][/ROW]
[ROW][C]45[/C][C]113.187370651695[/C][C]18.1599817646509[/C][C]51.0523008451006[/C][C]175.322440458289[/C][C]208.214759538738[/C][/ROW]
[ROW][C]46[/C][C]112.825632062505[/C][C]17.7981804624492[/C][C]50.6905212500763[/C][C]174.960742874933[/C][C]207.85308366256[/C][/ROW]
[ROW][C]47[/C][C]112.492130458112[/C][C]17.4646141480768[/C][C]50.3569773341021[/C][C]174.627283582121[/C][C]207.519646768147[/C][/ROW]
[ROW][C]48[/C][C]112.184661685201[/C][C]17.1570787963776[/C][C]50.0494650276616[/C][C]174.319858342741[/C][C]207.212244574025[/C][/ROW]
[ROW][C]49[/C][C]111.901193644659[/C][C]16.8735424305519[/C][C]49.7659523116178[/C][C]174.0364349777[/C][C]206.928844858766[/C][/ROW]
[/TABLE]
Source: https://freestatistics.org/blog/index.php?pk=75916&T=1

Globally Unique Identifier (entire table): ba.freestatistics.org/blog/index.php?pk=75916&T=1

As an alternative you can also use a QR Code:  

The GUIDs for individual cells are displayed in the table below:

Demand Forecast
PointForecast95% LB80% LB80% UB95% UB
26130.26085185559435.234103642514868.1262009631886192.395502748000225.287600068673
27128.56637287431633.539620602319866.4317193279275190.701026420705223.593125146313
28127.00416337897031.977404343459664.869505410157189.138821347782222.030922414480
29125.56389853395530.537129632984463.4292341144642187.698562953445220.590667434925
30124.23605945093429.209277307510262.1013863726688186.370732529200219.262841594358
31123.01187027732627.985071338467760.8771862171164185.146554337536218.038669216185
32121.88324019560726.856420812034959.7485427673175184.017937623896216.910059579179
33120.84270995010025.815866439809858.7079967461974182.977423154002215.869553460389
34119.88340254783224.856531246295857.7486711722104182.018133923453214.910273849367
35118.99897780763923.972075106938556.8642259012073181.133729714070214.025880508339
36118.18359045712223.156652835954156.0488157174243180.318365196821213.210528078291
37117.43185150052522.404875546695955.2970516964473179.566651304603212.458827454354
38116.73879260218921.711775028969854.6039655846547178.873619619723211.765810175408
39116.09983325021221.072770907682253.964976959599178.234689540825211.126895592742
40115.51075048328020.483640365614553.375862954185177.645638012375210.537860600946
41114.96765098059319.940490230085352.8327303444618177.102571616724209.994811731101
42114.46694533042519.439731238906952.331989816482176.601900844369209.494159421944
43114.00532430726218.978054315462251.8703322420894176.140316372435209.032594299062
44113.57973700071918.552408696018151.4447068067895175.714767194648208.607065305419
45113.18737065169518.159981764650951.0523008451006175.322440458289208.214759538738
46112.82563206250517.798180462449250.6905212500763174.960742874933207.85308366256
47112.49213045811217.464614148076850.3569773341021174.627283582121207.519646768147
48112.18466168520117.157078796377650.0494650276616174.319858342741207.212244574025
49111.90119364465916.873542430551949.7659523116178174.0364349777206.928844858766


Actuals and Interpolation
TimeActualForecast
1285263.074978758798
2215.375251.150995958404
3313.725240.148887802906
4256.7625230.023039795889
5273.79220.685960664563
6173.0125212.085468785266
7174.875204.143913113455
8258.2625196.82024483039
9222.65190.082767981171
10231.7375183.871806487569
11150.778178.151865687297
12144.1375172.868740338206
13136.15167.995011999447
14152.875163.498250062763
15238.375159.353396166068
16147.8155.548258305226
1735.425152.031367572698
1880.375148.767298136698
19143.375145.755625456846
20194.8875142.984891871717
21190.43140.440637576800
22122.525138.099808990679
23153.125135.934098031119
2479.6133.942182198235
25182.8625132.093720050010

\begin{tabular}{lllllllll}
\hline
Actuals and Interpolation \tabularnewline
Time & Actual & Forecast \tabularnewline
1 & 285 & 263.074978758798 \tabularnewline
2 & 215.375 & 251.150995958404 \tabularnewline
3 & 313.725 & 240.148887802906 \tabularnewline
4 & 256.7625 & 230.023039795889 \tabularnewline
5 & 273.79 & 220.685960664563 \tabularnewline
6 & 173.0125 & 212.085468785266 \tabularnewline
7 & 174.875 & 204.143913113455 \tabularnewline
8 & 258.2625 & 196.82024483039 \tabularnewline
9 & 222.65 & 190.082767981171 \tabularnewline
10 & 231.7375 & 183.871806487569 \tabularnewline
11 & 150.778 & 178.151865687297 \tabularnewline
12 & 144.1375 & 172.868740338206 \tabularnewline
13 & 136.15 & 167.995011999447 \tabularnewline
14 & 152.875 & 163.498250062763 \tabularnewline
15 & 238.375 & 159.353396166068 \tabularnewline
16 & 147.8 & 155.548258305226 \tabularnewline
17 & 35.425 & 152.031367572698 \tabularnewline
18 & 80.375 & 148.767298136698 \tabularnewline
19 & 143.375 & 145.755625456846 \tabularnewline
20 & 194.8875 & 142.984891871717 \tabularnewline
21 & 190.43 & 140.440637576800 \tabularnewline
22 & 122.525 & 138.099808990679 \tabularnewline
23 & 153.125 & 135.934098031119 \tabularnewline
24 & 79.6 & 133.942182198235 \tabularnewline
25 & 182.8625 & 132.093720050010 \tabularnewline
\hline
\end{tabular}
%Source: https://freestatistics.org/blog/index.php?pk=75916&T=2

[TABLE]
[ROW][C]Actuals and Interpolation[/C][/ROW]
[ROW][C]Time[/C][C]Actual[/C][C]Forecast[/C][/ROW]
[ROW][C]1[/C][C]285[/C][C]263.074978758798[/C][/ROW]
[ROW][C]2[/C][C]215.375[/C][C]251.150995958404[/C][/ROW]
[ROW][C]3[/C][C]313.725[/C][C]240.148887802906[/C][/ROW]
[ROW][C]4[/C][C]256.7625[/C][C]230.023039795889[/C][/ROW]
[ROW][C]5[/C][C]273.79[/C][C]220.685960664563[/C][/ROW]
[ROW][C]6[/C][C]173.0125[/C][C]212.085468785266[/C][/ROW]
[ROW][C]7[/C][C]174.875[/C][C]204.143913113455[/C][/ROW]
[ROW][C]8[/C][C]258.2625[/C][C]196.82024483039[/C][/ROW]
[ROW][C]9[/C][C]222.65[/C][C]190.082767981171[/C][/ROW]
[ROW][C]10[/C][C]231.7375[/C][C]183.871806487569[/C][/ROW]
[ROW][C]11[/C][C]150.778[/C][C]178.151865687297[/C][/ROW]
[ROW][C]12[/C][C]144.1375[/C][C]172.868740338206[/C][/ROW]
[ROW][C]13[/C][C]136.15[/C][C]167.995011999447[/C][/ROW]
[ROW][C]14[/C][C]152.875[/C][C]163.498250062763[/C][/ROW]
[ROW][C]15[/C][C]238.375[/C][C]159.353396166068[/C][/ROW]
[ROW][C]16[/C][C]147.8[/C][C]155.548258305226[/C][/ROW]
[ROW][C]17[/C][C]35.425[/C][C]152.031367572698[/C][/ROW]
[ROW][C]18[/C][C]80.375[/C][C]148.767298136698[/C][/ROW]
[ROW][C]19[/C][C]143.375[/C][C]145.755625456846[/C][/ROW]
[ROW][C]20[/C][C]194.8875[/C][C]142.984891871717[/C][/ROW]
[ROW][C]21[/C][C]190.43[/C][C]140.440637576800[/C][/ROW]
[ROW][C]22[/C][C]122.525[/C][C]138.099808990679[/C][/ROW]
[ROW][C]23[/C][C]153.125[/C][C]135.934098031119[/C][/ROW]
[ROW][C]24[/C][C]79.6[/C][C]133.942182198235[/C][/ROW]
[ROW][C]25[/C][C]182.8625[/C][C]132.093720050010[/C][/ROW]
[/TABLE]
Source: https://freestatistics.org/blog/index.php?pk=75916&T=2

Globally Unique Identifier (entire table): ba.freestatistics.org/blog/index.php?pk=75916&T=2

As an alternative you can also use a QR Code:  

The GUIDs for individual cells are displayed in the table below:

Actuals and Interpolation
TimeActualForecast
1285263.074978758798
2215.375251.150995958404
3313.725240.148887802906
4256.7625230.023039795889
5273.79220.685960664563
6173.0125212.085468785266
7174.875204.143913113455
8258.2625196.82024483039
9222.65190.082767981171
10231.7375183.871806487569
11150.778178.151865687297
12144.1375172.868740338206
13136.15167.995011999447
14152.875163.498250062763
15238.375159.353396166068
16147.8155.548258305226
1735.425152.031367572698
1880.375148.767298136698
19143.375145.755625456846
20194.8875142.984891871717
21190.43140.440637576800
22122.525138.099808990679
23153.125135.934098031119
2479.6133.942182198235
25182.8625132.093720050010


\begin{tabular}{lllllllll}
\hline
What is next? \tabularnewline
Simulate Time Series \tabularnewline
Generate Forecasts \tabularnewline
Forecast Analysis \tabularnewline
\hline
\end{tabular}
%Source: https://freestatistics.org/blog/index.php?pk=75916&T=3

[TABLE]
[ROW][C]What is next?[/C][/ROW]
[ROW][C]Simulate Time Series[/C][/ROW]
[ROW][C]Generate Forecasts[/C][/ROW]
[ROW][C]Forecast Analysis[/C][/ROW]
[/TABLE]
Source: https://freestatistics.org/blog/index.php?pk=75916&T=3

Globally Unique Identifier (entire table): ba.freestatistics.org/blog/index.php?pk=75916&T=3

As an alternative you can also use a QR Code:  

The GUIDs for individual cells are displayed in the table below:

What is next?
Simulate Time Series
Generate Forecasts
Forecast Analysis


Parameters (Session):
par1 = Input box ; par2 = ARIMA ; par3 = NA ; par4 = NA ; par5 = ZZZ ; par6 = 12 ; par7 = dum ; par8 = dumresult ; par9 = 3 ; par10 = 0.1 ;
Parameters (R input):
par1 = Input box ; par2 = ETS ; par3 = NA ; par4 = NA ; par5 = ZZZ ; par6 = 12 ; par7 = dum ; par8 = dumresult ; par9 = 3 ; par10 = 0.1 ;
R code (references can be found in the software module):
if(par3!='NA') par3 <- as.numeric(par3) else par3 <- NA
if(par4!='NA') par4 <- as.numeric(par4) else par4 <- NA
par6 <- as.numeric(par6) #Seasonal Period
par9 <- as.numeric(par9) #Forecast Horizon
par10 <- as.numeric(par10) #Alpha
library(forecast)
if (par1 == 'CSV') {
xarr <- read.csv(file=paste('tmp/',par7,'.csv',sep=''),header=T)
numseries <- length(xarr[1,])-1
n <- length(xarr[,1])
nmh <- n - par9
nmhp1 <- nmh + 1
rarr <- array(NA,dim=c(n,numseries))
farr <- array(NA,dim=c(n,numseries))
parr <- array(NA,dim=c(numseries,8))
colnames(parr) = list('ME','RMSE','MAE','MPE','MAPE','MASE','ACF1','TheilU')
for(i in 1:numseries) {
sindex <- i+1
x <- xarr[,sindex]
if(par2=='Croston') {
if (i==1) m <- croston(x,alpha=par10)
if (i==1) mydemand <- m$model$demand[]
fit <- croston(x[1:nmh],h=par9,alpha=par10)
}
if(par2=='ARIMA') {
m <- auto.arima(ts(x,freq=par6),d=par3,D=par4)
mydemand <- forecast(m)
fit <- auto.arima(ts(x[1:nmh],freq=par6),d=par3,D=par4)
}
if(par2=='ETS') {
m <- ets(ts(x,freq=par6),model=par5)
mydemand <- forecast(m)
fit <- ets(ts(x[1:nmh],freq=par6),model=par5)
}
try(rarr[,i] <- mydemand$resid,silent=T)
try(farr[,i] <- mydemand$mean,silent=T)
if (par2!='Croston') parr[i,] <- accuracy(forecast(fit,par9),x[nmhp1:n])
if (par2=='Croston') parr[i,] <- accuracy(fit,x[nmhp1:n])
}
write.csv(farr,file=paste('tmp/',par8,'_f.csv',sep=''))
write.csv(rarr,file=paste('tmp/',par8,'_r.csv',sep=''))
write.csv(parr,file=paste('tmp/',par8,'_p.csv',sep=''))
}
if (par1 == 'Input box') {
numseries <- 1
n <- length(x)
if(par2=='Croston') {
m <- croston(x)
mydemand <- m$model$demand[]
}
if(par2=='ARIMA') {
m <- auto.arima(ts(x,freq=par6),d=par3,D=par4)
mydemand <- forecast(m)
}
if(par2=='ETS') {
m <- ets(ts(x,freq=par6),model=par5)
mydemand <- forecast(m)
}
summary(m)
}
bitmap(file='test1.png')
op <- par(mfrow=c(2,1))
if (par2=='Croston') plot(m)
if ((par2=='ARIMA') | par2=='ETS') plot(forecast(m))
plot(mydemand$resid,type='l',main='Residuals', ylab='residual value', xlab='time')
par(op)
dev.off()
bitmap(file='pic2.png')
op <- par(mfrow=c(2,2))
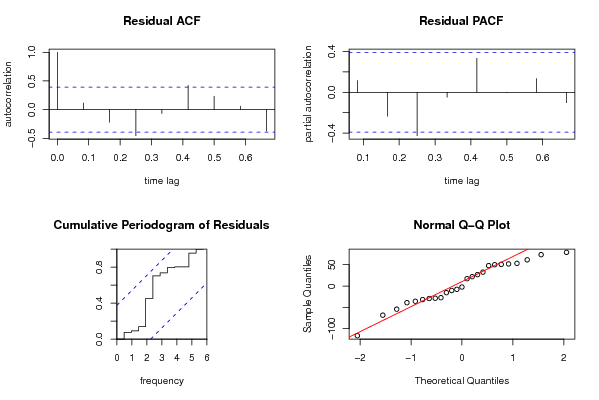
acf(mydemand$resid, lag.max=n/3, main='Residual ACF', ylab='autocorrelation', xlab='time lag')
pacf(mydemand$resid,lag.max=n/3, main='Residual PACF', ylab='partial autocorrelation', xlab='time lag')
cpgram(mydemand$resid, main='Cumulative Periodogram of Residuals')
qqnorm(mydemand$resid); qqline(mydemand$resid, col=2)
par(op)
dev.off()
load(file='createtable')
a<-table.start()
a<-table.row.start(a)
a<-table.element(a,'Demand Forecast',6,TRUE)
a<-table.row.end(a)
a<-table.row.start(a)
a<-table.element(a,'Point',header=TRUE)
a<-table.element(a,'Forecast',header=TRUE)
a<-table.element(a,'95% LB',header=TRUE)
a<-table.element(a,'80% LB',header=TRUE)
a<-table.element(a,'80% UB',header=TRUE)
a<-table.element(a,'95% UB',header=TRUE)
a<-table.row.end(a)
for (i in 1:length(mydemand$mean)) {
a<-table.row.start(a)
a<-table.element(a,i+n,header=TRUE)
a<-table.element(a,as.numeric(mydemand$mean[i]))
a<-table.element(a,as.numeric(mydemand$lower[i,2]))
a<-table.element(a,as.numeric(mydemand$lower[i,1]))
a<-table.element(a,as.numeric(mydemand$upper[i,1]))
a<-table.element(a,as.numeric(mydemand$upper[i,2]))
a<-table.row.end(a)
}
a<-table.end(a)
table.save(a,file='mytable.tab')
a<-table.start()
a<-table.row.start(a)
a<-table.element(a,'Actuals and Interpolation',3,TRUE)
a<-table.row.end(a)
a<-table.row.start(a)
a<-table.element(a,'Time',header=TRUE)
a<-table.element(a,'Actual',header=TRUE)
a<-table.element(a,'Forecast',header=TRUE)
a<-table.row.end(a)
for (i in 1:n) {
a<-table.row.start(a)
a<-table.element(a,i,header=TRUE)
a<-table.element(a,x[i])
a<-table.element(a,x[i] - as.numeric(m$resid[i]))
a<-table.row.end(a)
}
a<-table.end(a)
table.save(a,file='mytable1.tab')
a<-table.start()
a<-table.row.start(a)
a<-table.element(a,'What is next?',1,TRUE)
a<-table.row.end(a)
a<-table.row.start(a)
a<-table.element(a,hyperlink(paste('https://automated.biganalytics.eu/Patrick.Wessa/rwasp_demand_forecasting_simulate.wasp',sep=''),'Simulate Time Series','',target=''))
a<-table.row.end(a)
a<-table.row.start(a)
a<-table.element(a,hyperlink(paste('https://automated.biganalytics.eu/Patrick.Wessa/rwasp_demand_forecasting_croston.wasp',sep=''),'Generate Forecasts','',target=''))
a<-table.row.end(a)
a<-table.row.start(a)
a<-table.element(a,hyperlink(paste('https://automated.biganalytics.eu/Patrick.Wessa/rwasp_demand_forecasting_analysis.wasp',sep=''),'Forecast Analysis','',target=''))
a<-table.row.end(a)
a<-table.end(a)
table.save(a,file='mytable0.tab')
-SERVER-wessa.org