Free Statistics

of Irreproducible Research!

Author's title

Author*Unverified author*
R Software ModulePatrick.Wessarwasp_demand_forecasting_croston.wasp
Title produced by softwareCroston Forecasting
Date of computationThu, 13 May 2010 13:09:03 +0000
Cite this page as followsStatistical Computations at FreeStatistics.org, Office for Research Development and Education, URL https://freestatistics.org/blog/index.php?v=date/2010/May/13/t1273756198nfiyj1wtxxz0bbe.htm/, Retrieved Mon, 06 May 2024 10:09:29 +0000
Statistical Computations at FreeStatistics.org, Office for Research Development and Education, URL https://freestatistics.org/blog/index.php?pk=75921, Retrieved Mon, 06 May 2024 10:09:29 +0000
QR Codes:

Original text written by user:
IsPrivate?No (this computation is public)
User-defined keywordsB521,steven,coomans,thesis,Arima,per2maand
Estimated Impact133
Family? (F = Feedback message, R = changed R code, M = changed R Module, P = changed Parameters, D = changed Data)
-       [Croston Forecasting] [B521,steven,cooma...] [2010-05-13 13:09:03] [d41d8cd98f00b204e9800998ecf8427e] [Current]
Feedback Forum

Post a new message
Dataseries X:
341,25
303,6875
357,5
295,075
386,5755
455,6625
424,926
506,751
433,9
466,3375
496,7
464,45
385,375
381,875
219,6375
268,975
292,2875
181,025
277,625
166,75
266
189,25
226,35
158,75
218,8125


Summary of computational transaction
Raw Inputview raw input (R code)
Raw Outputview raw output of R engine
Computing time3 seconds
R Serverwessa.org @ wessa.org

\begin{tabular}{lllllllll}
\hline
Summary of computational transaction \tabularnewline
Raw Input & view raw input (R code)  \tabularnewline
Raw Output & view raw output of R engine  \tabularnewline
Computing time & 3 seconds \tabularnewline
R Server & wessa.org @ wessa.org \tabularnewline
\hline
\end{tabular}
%Source: https://freestatistics.org/blog/index.php?pk=75921&T=0

[TABLE]
[ROW][C]Summary of computational transaction[/C][/ROW]
[ROW][C]Raw Input[/C][C]view raw input (R code) [/C][/ROW]
[ROW][C]Raw Output[/C][C]view raw output of R engine [/C][/ROW]
[ROW][C]Computing time[/C][C]3 seconds[/C][/ROW]
[ROW][C]R Server[/C][C]wessa.org @ wessa.org[/C][/ROW]
[/TABLE]
Source: https://freestatistics.org/blog/index.php?pk=75921&T=0

Globally Unique Identifier (entire table): ba.freestatistics.org/blog/index.php?pk=75921&T=0

As an alternative you can also use a QR Code:  

The GUIDs for individual cells are displayed in the table below:

Summary of computational transaction
Raw Inputview raw input (R code)
Raw Outputview raw output of R engine
Computing time3 seconds
R Serverwessa.org @ wessa.org


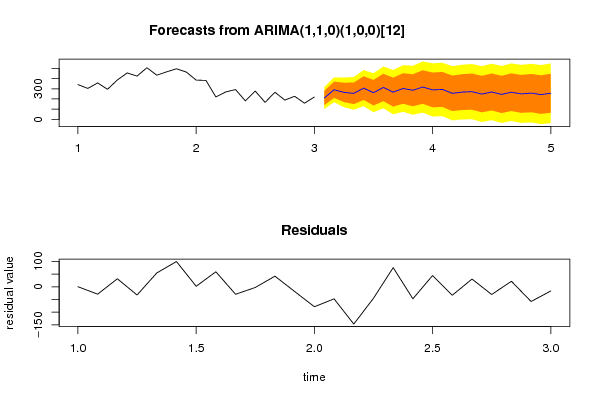
Demand Forecast
PointForecast95% LB80% LB80% UB95% UB
26209.414075178548102.401522366656139.442327906270279.385822450827316.426627990440
27290.524811316582169.796143181674211.584578294538369.465044338626411.253479451489
28264.943295219106119.941526035548170.131734512018359.754855926194409.945064402663
29255.24870824175494.8189236900868150.349310511024360.148105972483415.678492793421
30306.684590709726129.918675339492191.103571178487422.265610240964483.450506079959
31261.80265570783771.1025898407337137.110584889609386.494726526064452.50272157494
32313.500955096749109.367423282953180.025213022075446.976697171423517.634486910545
33267.16835806483950.6358163769914125.585339203126408.751376926552483.700899752687
34303.01586417717574.664820543475153.705142260422452.326586093929531.366907810876
35285.68745384860846.1421256492712129.057182683295442.31772501392525.232782047944
36317.28081679139167.0223041022669153.645570808606480.916062774175567.539329480515
37289.20735439180228.6846148276172118.860691196968459.554017586636549.730093955987
38293.59916887812332.1153698135266122.624102652902464.574235103343555.082967942718
39255.684010977318-9.8652376565522482.0506901610731429.317331793563521.233259611189
40267.641952204615-0.18767582963880692.5175714435707442.76633296566535.47158023887
41272.1739392226141.3251985593154895.0754668217094449.272411623519543.022679885913
42248.129717785499-25.333399202320269.3217965895961426.937638981402521.592834773319
43269.110198390853-7.1153218839306288.4960387716936449.724358010012545.335718665636
44244.943370603749-33.934786488924462.5947449976619427.291996209835523.821527696422
45266.601945560824-14.942703172252282.509794786303450.694096335345548.146594293901
46249.844720054549-34.322980455566664.037447911531435.651992197568534.012420564665
47257.945034697678-28.830438325851170.4326317596503445.457437635707544.720507721208
48243.176447821398-46.179169982110853.9769788922616432.375916750533532.532065624906
49256.299626781121-35.615285273468865.4267252889207447.172528273321548.21453883571

\begin{tabular}{lllllllll}
\hline
Demand Forecast \tabularnewline
Point & Forecast & 95% LB & 80% LB & 80% UB & 95% UB \tabularnewline
26 & 209.414075178548 & 102.401522366656 & 139.442327906270 & 279.385822450827 & 316.426627990440 \tabularnewline
27 & 290.524811316582 & 169.796143181674 & 211.584578294538 & 369.465044338626 & 411.253479451489 \tabularnewline
28 & 264.943295219106 & 119.941526035548 & 170.131734512018 & 359.754855926194 & 409.945064402663 \tabularnewline
29 & 255.248708241754 & 94.8189236900868 & 150.349310511024 & 360.148105972483 & 415.678492793421 \tabularnewline
30 & 306.684590709726 & 129.918675339492 & 191.103571178487 & 422.265610240964 & 483.450506079959 \tabularnewline
31 & 261.802655707837 & 71.1025898407337 & 137.110584889609 & 386.494726526064 & 452.50272157494 \tabularnewline
32 & 313.500955096749 & 109.367423282953 & 180.025213022075 & 446.976697171423 & 517.634486910545 \tabularnewline
33 & 267.168358064839 & 50.6358163769914 & 125.585339203126 & 408.751376926552 & 483.700899752687 \tabularnewline
34 & 303.015864177175 & 74.664820543475 & 153.705142260422 & 452.326586093929 & 531.366907810876 \tabularnewline
35 & 285.687453848608 & 46.1421256492712 & 129.057182683295 & 442.31772501392 & 525.232782047944 \tabularnewline
36 & 317.280816791391 & 67.0223041022669 & 153.645570808606 & 480.916062774175 & 567.539329480515 \tabularnewline
37 & 289.207354391802 & 28.6846148276172 & 118.860691196968 & 459.554017586636 & 549.730093955987 \tabularnewline
38 & 293.599168878123 & 32.1153698135266 & 122.624102652902 & 464.574235103343 & 555.082967942718 \tabularnewline
39 & 255.684010977318 & -9.86523765655224 & 82.0506901610731 & 429.317331793563 & 521.233259611189 \tabularnewline
40 & 267.641952204615 & -0.187675829638806 & 92.5175714435707 & 442.76633296566 & 535.47158023887 \tabularnewline
41 & 272.173939222614 & 1.32519855931548 & 95.0754668217094 & 449.272411623519 & 543.022679885913 \tabularnewline
42 & 248.129717785499 & -25.3333992023202 & 69.3217965895961 & 426.937638981402 & 521.592834773319 \tabularnewline
43 & 269.110198390853 & -7.11532188393062 & 88.4960387716936 & 449.724358010012 & 545.335718665636 \tabularnewline
44 & 244.943370603749 & -33.9347864889244 & 62.5947449976619 & 427.291996209835 & 523.821527696422 \tabularnewline
45 & 266.601945560824 & -14.9427031722522 & 82.509794786303 & 450.694096335345 & 548.146594293901 \tabularnewline
46 & 249.844720054549 & -34.3229804555666 & 64.037447911531 & 435.651992197568 & 534.012420564665 \tabularnewline
47 & 257.945034697678 & -28.8304383258511 & 70.4326317596503 & 445.457437635707 & 544.720507721208 \tabularnewline
48 & 243.176447821398 & -46.1791699821108 & 53.9769788922616 & 432.375916750533 & 532.532065624906 \tabularnewline
49 & 256.299626781121 & -35.6152852734688 & 65.4267252889207 & 447.172528273321 & 548.21453883571 \tabularnewline
\hline
\end{tabular}
%Source: https://freestatistics.org/blog/index.php?pk=75921&T=1

[TABLE]
[ROW][C]Demand Forecast[/C][/ROW]
[ROW][C]Point[/C][C]Forecast[/C][C]95% LB[/C][C]80% LB[/C][C]80% UB[/C][C]95% UB[/C][/ROW]
[ROW][C]26[/C][C]209.414075178548[/C][C]102.401522366656[/C][C]139.442327906270[/C][C]279.385822450827[/C][C]316.426627990440[/C][/ROW]
[ROW][C]27[/C][C]290.524811316582[/C][C]169.796143181674[/C][C]211.584578294538[/C][C]369.465044338626[/C][C]411.253479451489[/C][/ROW]
[ROW][C]28[/C][C]264.943295219106[/C][C]119.941526035548[/C][C]170.131734512018[/C][C]359.754855926194[/C][C]409.945064402663[/C][/ROW]
[ROW][C]29[/C][C]255.248708241754[/C][C]94.8189236900868[/C][C]150.349310511024[/C][C]360.148105972483[/C][C]415.678492793421[/C][/ROW]
[ROW][C]30[/C][C]306.684590709726[/C][C]129.918675339492[/C][C]191.103571178487[/C][C]422.265610240964[/C][C]483.450506079959[/C][/ROW]
[ROW][C]31[/C][C]261.802655707837[/C][C]71.1025898407337[/C][C]137.110584889609[/C][C]386.494726526064[/C][C]452.50272157494[/C][/ROW]
[ROW][C]32[/C][C]313.500955096749[/C][C]109.367423282953[/C][C]180.025213022075[/C][C]446.976697171423[/C][C]517.634486910545[/C][/ROW]
[ROW][C]33[/C][C]267.168358064839[/C][C]50.6358163769914[/C][C]125.585339203126[/C][C]408.751376926552[/C][C]483.700899752687[/C][/ROW]
[ROW][C]34[/C][C]303.015864177175[/C][C]74.664820543475[/C][C]153.705142260422[/C][C]452.326586093929[/C][C]531.366907810876[/C][/ROW]
[ROW][C]35[/C][C]285.687453848608[/C][C]46.1421256492712[/C][C]129.057182683295[/C][C]442.31772501392[/C][C]525.232782047944[/C][/ROW]
[ROW][C]36[/C][C]317.280816791391[/C][C]67.0223041022669[/C][C]153.645570808606[/C][C]480.916062774175[/C][C]567.539329480515[/C][/ROW]
[ROW][C]37[/C][C]289.207354391802[/C][C]28.6846148276172[/C][C]118.860691196968[/C][C]459.554017586636[/C][C]549.730093955987[/C][/ROW]
[ROW][C]38[/C][C]293.599168878123[/C][C]32.1153698135266[/C][C]122.624102652902[/C][C]464.574235103343[/C][C]555.082967942718[/C][/ROW]
[ROW][C]39[/C][C]255.684010977318[/C][C]-9.86523765655224[/C][C]82.0506901610731[/C][C]429.317331793563[/C][C]521.233259611189[/C][/ROW]
[ROW][C]40[/C][C]267.641952204615[/C][C]-0.187675829638806[/C][C]92.5175714435707[/C][C]442.76633296566[/C][C]535.47158023887[/C][/ROW]
[ROW][C]41[/C][C]272.173939222614[/C][C]1.32519855931548[/C][C]95.0754668217094[/C][C]449.272411623519[/C][C]543.022679885913[/C][/ROW]
[ROW][C]42[/C][C]248.129717785499[/C][C]-25.3333992023202[/C][C]69.3217965895961[/C][C]426.937638981402[/C][C]521.592834773319[/C][/ROW]
[ROW][C]43[/C][C]269.110198390853[/C][C]-7.11532188393062[/C][C]88.4960387716936[/C][C]449.724358010012[/C][C]545.335718665636[/C][/ROW]
[ROW][C]44[/C][C]244.943370603749[/C][C]-33.9347864889244[/C][C]62.5947449976619[/C][C]427.291996209835[/C][C]523.821527696422[/C][/ROW]
[ROW][C]45[/C][C]266.601945560824[/C][C]-14.9427031722522[/C][C]82.509794786303[/C][C]450.694096335345[/C][C]548.146594293901[/C][/ROW]
[ROW][C]46[/C][C]249.844720054549[/C][C]-34.3229804555666[/C][C]64.037447911531[/C][C]435.651992197568[/C][C]534.012420564665[/C][/ROW]
[ROW][C]47[/C][C]257.945034697678[/C][C]-28.8304383258511[/C][C]70.4326317596503[/C][C]445.457437635707[/C][C]544.720507721208[/C][/ROW]
[ROW][C]48[/C][C]243.176447821398[/C][C]-46.1791699821108[/C][C]53.9769788922616[/C][C]432.375916750533[/C][C]532.532065624906[/C][/ROW]
[ROW][C]49[/C][C]256.299626781121[/C][C]-35.6152852734688[/C][C]65.4267252889207[/C][C]447.172528273321[/C][C]548.21453883571[/C][/ROW]
[/TABLE]
Source: https://freestatistics.org/blog/index.php?pk=75921&T=1

Globally Unique Identifier (entire table): ba.freestatistics.org/blog/index.php?pk=75921&T=1

As an alternative you can also use a QR Code:  

The GUIDs for individual cells are displayed in the table below:

Demand Forecast
PointForecast95% LB80% LB80% UB95% UB
26209.414075178548102.401522366656139.442327906270279.385822450827316.426627990440
27290.524811316582169.796143181674211.584578294538369.465044338626411.253479451489
28264.943295219106119.941526035548170.131734512018359.754855926194409.945064402663
29255.24870824175494.8189236900868150.349310511024360.148105972483415.678492793421
30306.684590709726129.918675339492191.103571178487422.265610240964483.450506079959
31261.80265570783771.1025898407337137.110584889609386.494726526064452.50272157494
32313.500955096749109.367423282953180.025213022075446.976697171423517.634486910545
33267.16835806483950.6358163769914125.585339203126408.751376926552483.700899752687
34303.01586417717574.664820543475153.705142260422452.326586093929531.366907810876
35285.68745384860846.1421256492712129.057182683295442.31772501392525.232782047944
36317.28081679139167.0223041022669153.645570808606480.916062774175567.539329480515
37289.20735439180228.6846148276172118.860691196968459.554017586636549.730093955987
38293.59916887812332.1153698135266122.624102652902464.574235103343555.082967942718
39255.684010977318-9.8652376565522482.0506901610731429.317331793563521.233259611189
40267.641952204615-0.18767582963880692.5175714435707442.76633296566535.47158023887
41272.1739392226141.3251985593154895.0754668217094449.272411623519543.022679885913
42248.129717785499-25.333399202320269.3217965895961426.937638981402521.592834773319
43269.110198390853-7.1153218839306288.4960387716936449.724358010012545.335718665636
44244.943370603749-33.934786488924462.5947449976619427.291996209835523.821527696422
45266.601945560824-14.942703172252282.509794786303450.694096335345548.146594293901
46249.844720054549-34.322980455566664.037447911531435.651992197568534.012420564665
47257.945034697678-28.830438325851170.4326317596503445.457437635707544.720507721208
48243.176447821398-46.179169982110853.9769788922616432.375916750533532.532065624906
49256.299626781121-35.615285273468865.4267252889207447.172528273321548.21453883571


Actuals and Interpolation
TimeActualForecast
1341.25340.90875028286
2303.6875332.86089603337
3357.5325.788548906474
4295.075327.541311770725
5386.5755332.035063343418
6455.6625355.979142780996
7424.926422.853279739822
8506.751447.538297256219
9433.9463.452634199947
10466.3375469.038817658043
11496.7454.838864911353
12464.45483.073307566238
13385.375464.126997390433
14381.875429.475306145968
15219.6375366.780195970248
16268.975314.305881579131
17292.2875216.573154866353
18181.025228.421842054758
19277.625233.11741103145
20166.75200.091184304044
21266235.499484918374
22189.25219.691637200487
23226.35204.478173107192
24158.75216.921637949675
25218.8125235.210210182817

\begin{tabular}{lllllllll}
\hline
Actuals and Interpolation \tabularnewline
Time & Actual & Forecast \tabularnewline
1 & 341.25 & 340.90875028286 \tabularnewline
2 & 303.6875 & 332.86089603337 \tabularnewline
3 & 357.5 & 325.788548906474 \tabularnewline
4 & 295.075 & 327.541311770725 \tabularnewline
5 & 386.5755 & 332.035063343418 \tabularnewline
6 & 455.6625 & 355.979142780996 \tabularnewline
7 & 424.926 & 422.853279739822 \tabularnewline
8 & 506.751 & 447.538297256219 \tabularnewline
9 & 433.9 & 463.452634199947 \tabularnewline
10 & 466.3375 & 469.038817658043 \tabularnewline
11 & 496.7 & 454.838864911353 \tabularnewline
12 & 464.45 & 483.073307566238 \tabularnewline
13 & 385.375 & 464.126997390433 \tabularnewline
14 & 381.875 & 429.475306145968 \tabularnewline
15 & 219.6375 & 366.780195970248 \tabularnewline
16 & 268.975 & 314.305881579131 \tabularnewline
17 & 292.2875 & 216.573154866353 \tabularnewline
18 & 181.025 & 228.421842054758 \tabularnewline
19 & 277.625 & 233.11741103145 \tabularnewline
20 & 166.75 & 200.091184304044 \tabularnewline
21 & 266 & 235.499484918374 \tabularnewline
22 & 189.25 & 219.691637200487 \tabularnewline
23 & 226.35 & 204.478173107192 \tabularnewline
24 & 158.75 & 216.921637949675 \tabularnewline
25 & 218.8125 & 235.210210182817 \tabularnewline
\hline
\end{tabular}
%Source: https://freestatistics.org/blog/index.php?pk=75921&T=2

[TABLE]
[ROW][C]Actuals and Interpolation[/C][/ROW]
[ROW][C]Time[/C][C]Actual[/C][C]Forecast[/C][/ROW]
[ROW][C]1[/C][C]341.25[/C][C]340.90875028286[/C][/ROW]
[ROW][C]2[/C][C]303.6875[/C][C]332.86089603337[/C][/ROW]
[ROW][C]3[/C][C]357.5[/C][C]325.788548906474[/C][/ROW]
[ROW][C]4[/C][C]295.075[/C][C]327.541311770725[/C][/ROW]
[ROW][C]5[/C][C]386.5755[/C][C]332.035063343418[/C][/ROW]
[ROW][C]6[/C][C]455.6625[/C][C]355.979142780996[/C][/ROW]
[ROW][C]7[/C][C]424.926[/C][C]422.853279739822[/C][/ROW]
[ROW][C]8[/C][C]506.751[/C][C]447.538297256219[/C][/ROW]
[ROW][C]9[/C][C]433.9[/C][C]463.452634199947[/C][/ROW]
[ROW][C]10[/C][C]466.3375[/C][C]469.038817658043[/C][/ROW]
[ROW][C]11[/C][C]496.7[/C][C]454.838864911353[/C][/ROW]
[ROW][C]12[/C][C]464.45[/C][C]483.073307566238[/C][/ROW]
[ROW][C]13[/C][C]385.375[/C][C]464.126997390433[/C][/ROW]
[ROW][C]14[/C][C]381.875[/C][C]429.475306145968[/C][/ROW]
[ROW][C]15[/C][C]219.6375[/C][C]366.780195970248[/C][/ROW]
[ROW][C]16[/C][C]268.975[/C][C]314.305881579131[/C][/ROW]
[ROW][C]17[/C][C]292.2875[/C][C]216.573154866353[/C][/ROW]
[ROW][C]18[/C][C]181.025[/C][C]228.421842054758[/C][/ROW]
[ROW][C]19[/C][C]277.625[/C][C]233.11741103145[/C][/ROW]
[ROW][C]20[/C][C]166.75[/C][C]200.091184304044[/C][/ROW]
[ROW][C]21[/C][C]266[/C][C]235.499484918374[/C][/ROW]
[ROW][C]22[/C][C]189.25[/C][C]219.691637200487[/C][/ROW]
[ROW][C]23[/C][C]226.35[/C][C]204.478173107192[/C][/ROW]
[ROW][C]24[/C][C]158.75[/C][C]216.921637949675[/C][/ROW]
[ROW][C]25[/C][C]218.8125[/C][C]235.210210182817[/C][/ROW]
[/TABLE]
Source: https://freestatistics.org/blog/index.php?pk=75921&T=2

Globally Unique Identifier (entire table): ba.freestatistics.org/blog/index.php?pk=75921&T=2

As an alternative you can also use a QR Code:  

The GUIDs for individual cells are displayed in the table below:

Actuals and Interpolation
TimeActualForecast
1341.25340.90875028286
2303.6875332.86089603337
3357.5325.788548906474
4295.075327.541311770725
5386.5755332.035063343418
6455.6625355.979142780996
7424.926422.853279739822
8506.751447.538297256219
9433.9463.452634199947
10466.3375469.038817658043
11496.7454.838864911353
12464.45483.073307566238
13385.375464.126997390433
14381.875429.475306145968
15219.6375366.780195970248
16268.975314.305881579131
17292.2875216.573154866353
18181.025228.421842054758
19277.625233.11741103145
20166.75200.091184304044
21266235.499484918374
22189.25219.691637200487
23226.35204.478173107192
24158.75216.921637949675
25218.8125235.210210182817


\begin{tabular}{lllllllll}
\hline
What is next? \tabularnewline
Simulate Time Series \tabularnewline
Generate Forecasts \tabularnewline
Forecast Analysis \tabularnewline
\hline
\end{tabular}
%Source: https://freestatistics.org/blog/index.php?pk=75921&T=3

[TABLE]
[ROW][C]What is next?[/C][/ROW]
[ROW][C]Simulate Time Series[/C][/ROW]
[ROW][C]Generate Forecasts[/C][/ROW]
[ROW][C]Forecast Analysis[/C][/ROW]
[/TABLE]
Source: https://freestatistics.org/blog/index.php?pk=75921&T=3

Globally Unique Identifier (entire table): ba.freestatistics.org/blog/index.php?pk=75921&T=3

As an alternative you can also use a QR Code:  

The GUIDs for individual cells are displayed in the table below:

What is next?
Simulate Time Series
Generate Forecasts
Forecast Analysis


Parameters (Session):
par1 = Input box ; par2 = ARIMA ; par3 = NA ; par4 = NA ; par5 = ZZZ ; par6 = 12 ; par7 = dum ; par8 = dumresult ; par9 = 3 ; par10 = 0.1 ;
Parameters (R input):
par1 = Input box ; par2 = ARIMA ; par3 = NA ; par4 = NA ; par5 = ZZZ ; par6 = 12 ; par7 = dum ; par8 = dumresult ; par9 = 3 ; par10 = 0.1 ;
R code (references can be found in the software module):
if(par3!='NA') par3 <- as.numeric(par3) else par3 <- NA
if(par4!='NA') par4 <- as.numeric(par4) else par4 <- NA
par6 <- as.numeric(par6) #Seasonal Period
par9 <- as.numeric(par9) #Forecast Horizon
par10 <- as.numeric(par10) #Alpha
library(forecast)
if (par1 == 'CSV') {
xarr <- read.csv(file=paste('tmp/',par7,'.csv',sep=''),header=T)
numseries <- length(xarr[1,])-1
n <- length(xarr[,1])
nmh <- n - par9
nmhp1 <- nmh + 1
rarr <- array(NA,dim=c(n,numseries))
farr <- array(NA,dim=c(n,numseries))
parr <- array(NA,dim=c(numseries,8))
colnames(parr) = list('ME','RMSE','MAE','MPE','MAPE','MASE','ACF1','TheilU')
for(i in 1:numseries) {
sindex <- i+1
x <- xarr[,sindex]
if(par2=='Croston') {
if (i==1) m <- croston(x,alpha=par10)
if (i==1) mydemand <- m$model$demand[]
fit <- croston(x[1:nmh],h=par9,alpha=par10)
}
if(par2=='ARIMA') {
m <- auto.arima(ts(x,freq=par6),d=par3,D=par4)
mydemand <- forecast(m)
fit <- auto.arima(ts(x[1:nmh],freq=par6),d=par3,D=par4)
}
if(par2=='ETS') {
m <- ets(ts(x,freq=par6),model=par5)
mydemand <- forecast(m)
fit <- ets(ts(x[1:nmh],freq=par6),model=par5)
}
try(rarr[,i] <- mydemand$resid,silent=T)
try(farr[,i] <- mydemand$mean,silent=T)
if (par2!='Croston') parr[i,] <- accuracy(forecast(fit,par9),x[nmhp1:n])
if (par2=='Croston') parr[i,] <- accuracy(fit,x[nmhp1:n])
}
write.csv(farr,file=paste('tmp/',par8,'_f.csv',sep=''))
write.csv(rarr,file=paste('tmp/',par8,'_r.csv',sep=''))
write.csv(parr,file=paste('tmp/',par8,'_p.csv',sep=''))
}
if (par1 == 'Input box') {
numseries <- 1
n <- length(x)
if(par2=='Croston') {
m <- croston(x)
mydemand <- m$model$demand[]
}
if(par2=='ARIMA') {
m <- auto.arima(ts(x,freq=par6),d=par3,D=par4)
mydemand <- forecast(m)
}
if(par2=='ETS') {
m <- ets(ts(x,freq=par6),model=par5)
mydemand <- forecast(m)
}
summary(m)
}
bitmap(file='test1.png')
op <- par(mfrow=c(2,1))
if (par2=='Croston') plot(m)
if ((par2=='ARIMA') | par2=='ETS') plot(forecast(m))
plot(mydemand$resid,type='l',main='Residuals', ylab='residual value', xlab='time')
par(op)
dev.off()
bitmap(file='pic2.png')
op <- par(mfrow=c(2,2))
acf(mydemand$resid, lag.max=n/3, main='Residual ACF', ylab='autocorrelation', xlab='time lag')
pacf(mydemand$resid,lag.max=n/3, main='Residual PACF', ylab='partial autocorrelation', xlab='time lag')
cpgram(mydemand$resid, main='Cumulative Periodogram of Residuals')
qqnorm(mydemand$resid); qqline(mydemand$resid, col=2)
par(op)
dev.off()
load(file='createtable')
a<-table.start()
a<-table.row.start(a)
a<-table.element(a,'Demand Forecast',6,TRUE)
a<-table.row.end(a)
a<-table.row.start(a)
a<-table.element(a,'Point',header=TRUE)
a<-table.element(a,'Forecast',header=TRUE)
a<-table.element(a,'95% LB',header=TRUE)
a<-table.element(a,'80% LB',header=TRUE)
a<-table.element(a,'80% UB',header=TRUE)
a<-table.element(a,'95% UB',header=TRUE)
a<-table.row.end(a)
for (i in 1:length(mydemand$mean)) {
a<-table.row.start(a)
a<-table.element(a,i+n,header=TRUE)
a<-table.element(a,as.numeric(mydemand$mean[i]))
a<-table.element(a,as.numeric(mydemand$lower[i,2]))
a<-table.element(a,as.numeric(mydemand$lower[i,1]))
a<-table.element(a,as.numeric(mydemand$upper[i,1]))
a<-table.element(a,as.numeric(mydemand$upper[i,2]))
a<-table.row.end(a)
}
a<-table.end(a)
table.save(a,file='mytable.tab')
a<-table.start()
a<-table.row.start(a)
a<-table.element(a,'Actuals and Interpolation',3,TRUE)
a<-table.row.end(a)
a<-table.row.start(a)
a<-table.element(a,'Time',header=TRUE)
a<-table.element(a,'Actual',header=TRUE)
a<-table.element(a,'Forecast',header=TRUE)
a<-table.row.end(a)
for (i in 1:n) {
a<-table.row.start(a)
a<-table.element(a,i,header=TRUE)
a<-table.element(a,x[i])
a<-table.element(a,x[i] - as.numeric(m$resid[i]))
a<-table.row.end(a)
}
a<-table.end(a)
table.save(a,file='mytable1.tab')
a<-table.start()
a<-table.row.start(a)
a<-table.element(a,'What is next?',1,TRUE)
a<-table.row.end(a)
a<-table.row.start(a)
a<-table.element(a,hyperlink(paste('https://automated.biganalytics.eu/Patrick.Wessa/rwasp_demand_forecasting_simulate.wasp',sep=''),'Simulate Time Series','',target=''))
a<-table.row.end(a)
a<-table.row.start(a)
a<-table.element(a,hyperlink(paste('https://automated.biganalytics.eu/Patrick.Wessa/rwasp_demand_forecasting_croston.wasp',sep=''),'Generate Forecasts','',target=''))
a<-table.row.end(a)
a<-table.row.start(a)
a<-table.element(a,hyperlink(paste('https://automated.biganalytics.eu/Patrick.Wessa/rwasp_demand_forecasting_analysis.wasp',sep=''),'Forecast Analysis','',target=''))
a<-table.row.end(a)
a<-table.end(a)
table.save(a,file='mytable0.tab')
-SERVER-wessa.org