Free Statistics

of Irreproducible Research!

Author's title

Author*Unverified author*
R Software ModulePatrick.Wessarwasp_demand_forecasting_croston.wasp
Title produced by softwareCroston Forecasting
Date of computationThu, 13 May 2010 13:10:30 +0000
Cite this page as followsStatistical Computations at FreeStatistics.org, Office for Research Development and Education, URL https://freestatistics.org/blog/index.php?v=date/2010/May/13/t12737562648oduvw0vdptpnxd.htm/, Retrieved Sun, 05 May 2024 23:40:01 +0000
Statistical Computations at FreeStatistics.org, Office for Research Development and Education, URL https://freestatistics.org/blog/index.php?pk=75922, Retrieved Sun, 05 May 2024 23:40:01 +0000
QR Codes:

Original text written by user:
IsPrivate?No (this computation is public)
User-defined keywordsB521,steven,coomans,thesis,croston,per2maand
Estimated Impact136
Family? (F = Feedback message, R = changed R code, M = changed R Module, P = changed Parameters, D = changed Data)
-       [Croston Forecasting] [B521,steven,cooma...] [2010-05-13 13:10:30] [d41d8cd98f00b204e9800998ecf8427e] [Current]
Feedback Forum

Post a new message
Dataseries X:
341.25
303.6875
357.5
295.075
386.5755
455.6625
424.926
506.751
433.9
466.3375
496.7
464.45
385.375
381.875
219.6375
268.975
292.2875
181.025
277.625
166.75
266
189.25
226.35
158.75
218.8125


Summary of computational transaction
Raw Inputview raw input (R code)
Raw Outputview raw output of R engine
Computing time3 seconds
R Serverwessa.org @ wessa.org

\begin{tabular}{lllllllll}
\hline
Summary of computational transaction \tabularnewline
Raw Input & view raw input (R code)  \tabularnewline
Raw Output & view raw output of R engine  \tabularnewline
Computing time & 3 seconds \tabularnewline
R Server & wessa.org @ wessa.org \tabularnewline
\hline
\end{tabular}
%Source: https://freestatistics.org/blog/index.php?pk=75922&T=0

[TABLE]
[ROW][C]Summary of computational transaction[/C][/ROW]
[ROW][C]Raw Input[/C][C]view raw input (R code) [/C][/ROW]
[ROW][C]Raw Output[/C][C]view raw output of R engine [/C][/ROW]
[ROW][C]Computing time[/C][C]3 seconds[/C][/ROW]
[ROW][C]R Server[/C][C]wessa.org @ wessa.org[/C][/ROW]
[/TABLE]
Source: https://freestatistics.org/blog/index.php?pk=75922&T=0

Globally Unique Identifier (entire table): ba.freestatistics.org/blog/index.php?pk=75922&T=0

As an alternative you can also use a QR Code:  

The GUIDs for individual cells are displayed in the table below:

Summary of computational transaction
Raw Inputview raw input (R code)
Raw Outputview raw output of R engine
Computing time3 seconds
R Serverwessa.org @ wessa.org


Demand Forecast
PointForecast95% LB80% LB80% UB95% UB
26275.69502166610381.7827245154839148.902585707111402.487457625095469.607318816721
27275.69502166610380.8155748891473148.270200557422403.119842774783470.574468443058
28275.69502166610379.8532013979217147.640938354623403.749104977582471.536841934284
29275.69502166610378.8955339741455147.014753283932404.375290048274472.49450935806
30275.69502166610377.942504246781146.39160063993404.998442692275473.447539085424
31275.69502166610376.9940454844508145.771436789315405.61860654289474.395997847755
32275.69502166610376.0500925409088145.154219135247406.235824196959475.339950791297
33275.69502166610375.1105818028222144.539906083202406.850137249004476.279461529383
34275.69502166610374.1754511397434143.928457008264407.461586323941477.214592192462
35275.69502166610373.2446398561624143.319832223774408.070211108431478.145403476043

\begin{tabular}{lllllllll}
\hline
Demand Forecast \tabularnewline
Point & Forecast & 95% LB & 80% LB & 80% UB & 95% UB \tabularnewline
26 & 275.695021666103 & 81.7827245154839 & 148.902585707111 & 402.487457625095 & 469.607318816721 \tabularnewline
27 & 275.695021666103 & 80.8155748891473 & 148.270200557422 & 403.119842774783 & 470.574468443058 \tabularnewline
28 & 275.695021666103 & 79.8532013979217 & 147.640938354623 & 403.749104977582 & 471.536841934284 \tabularnewline
29 & 275.695021666103 & 78.8955339741455 & 147.014753283932 & 404.375290048274 & 472.49450935806 \tabularnewline
30 & 275.695021666103 & 77.942504246781 & 146.39160063993 & 404.998442692275 & 473.447539085424 \tabularnewline
31 & 275.695021666103 & 76.9940454844508 & 145.771436789315 & 405.61860654289 & 474.395997847755 \tabularnewline
32 & 275.695021666103 & 76.0500925409088 & 145.154219135247 & 406.235824196959 & 475.339950791297 \tabularnewline
33 & 275.695021666103 & 75.1105818028222 & 144.539906083202 & 406.850137249004 & 476.279461529383 \tabularnewline
34 & 275.695021666103 & 74.1754511397434 & 143.928457008264 & 407.461586323941 & 477.214592192462 \tabularnewline
35 & 275.695021666103 & 73.2446398561624 & 143.319832223774 & 408.070211108431 & 478.145403476043 \tabularnewline
\hline
\end{tabular}
%Source: https://freestatistics.org/blog/index.php?pk=75922&T=1

[TABLE]
[ROW][C]Demand Forecast[/C][/ROW]
[ROW][C]Point[/C][C]Forecast[/C][C]95% LB[/C][C]80% LB[/C][C]80% UB[/C][C]95% UB[/C][/ROW]
[ROW][C]26[/C][C]275.695021666103[/C][C]81.7827245154839[/C][C]148.902585707111[/C][C]402.487457625095[/C][C]469.607318816721[/C][/ROW]
[ROW][C]27[/C][C]275.695021666103[/C][C]80.8155748891473[/C][C]148.270200557422[/C][C]403.119842774783[/C][C]470.574468443058[/C][/ROW]
[ROW][C]28[/C][C]275.695021666103[/C][C]79.8532013979217[/C][C]147.640938354623[/C][C]403.749104977582[/C][C]471.536841934284[/C][/ROW]
[ROW][C]29[/C][C]275.695021666103[/C][C]78.8955339741455[/C][C]147.014753283932[/C][C]404.375290048274[/C][C]472.49450935806[/C][/ROW]
[ROW][C]30[/C][C]275.695021666103[/C][C]77.942504246781[/C][C]146.39160063993[/C][C]404.998442692275[/C][C]473.447539085424[/C][/ROW]
[ROW][C]31[/C][C]275.695021666103[/C][C]76.9940454844508[/C][C]145.771436789315[/C][C]405.61860654289[/C][C]474.395997847755[/C][/ROW]
[ROW][C]32[/C][C]275.695021666103[/C][C]76.0500925409088[/C][C]145.154219135247[/C][C]406.235824196959[/C][C]475.339950791297[/C][/ROW]
[ROW][C]33[/C][C]275.695021666103[/C][C]75.1105818028222[/C][C]144.539906083202[/C][C]406.850137249004[/C][C]476.279461529383[/C][/ROW]
[ROW][C]34[/C][C]275.695021666103[/C][C]74.1754511397434[/C][C]143.928457008264[/C][C]407.461586323941[/C][C]477.214592192462[/C][/ROW]
[ROW][C]35[/C][C]275.695021666103[/C][C]73.2446398561624[/C][C]143.319832223774[/C][C]408.070211108431[/C][C]478.145403476043[/C][/ROW]
[/TABLE]
Source: https://freestatistics.org/blog/index.php?pk=75922&T=1

Globally Unique Identifier (entire table): ba.freestatistics.org/blog/index.php?pk=75922&T=1

As an alternative you can also use a QR Code:  

The GUIDs for individual cells are displayed in the table below:

Demand Forecast
PointForecast95% LB80% LB80% UB95% UB
26275.69502166610381.7827245154839148.902585707111402.487457625095469.607318816721
27275.69502166610380.8155748891473148.270200557422403.119842774783470.574468443058
28275.69502166610379.8532013979217147.640938354623403.749104977582471.536841934284
29275.69502166610378.8955339741455147.014753283932404.375290048274472.49450935806
30275.69502166610377.942504246781146.39160063993404.998442692275473.447539085424
31275.69502166610376.9940454844508145.771436789315405.61860654289474.395997847755
32275.69502166610376.0500925409088145.154219135247406.235824196959475.339950791297
33275.69502166610375.1105818028222144.539906083202406.850137249004476.279461529383
34275.69502166610374.1754511397434143.928457008264407.461586323941477.214592192462
35275.69502166610373.2446398561624143.319832223774408.070211108431478.145403476043


Actuals and Interpolation
TimeActualForecast
1341.25NA
2303.6875341.25
3357.5337.49375
4295.075339.494375
5386.5755335.0524375
6455.6625340.20474375
7424.926351.750519375
8506.751359.0680674375
9433.9373.83636069375
10466.3375379.842724624375
11496.7388.492202161938
12464.45399.312981945744
13385.375405.826683751169
14381.875403.781515376053
15219.6375401.590863838447
16268.975383.395527454603
17292.2875371.953474709142
18181.025363.986877238228
19277.625345.690689514405
20166.75338.884120562965
21266321.670708506668
22189.25316.103637656002
23226.35303.418273890401
24158.75295.711446501361
25218.8125282.015301851225

\begin{tabular}{lllllllll}
\hline
Actuals and Interpolation \tabularnewline
Time & Actual & Forecast \tabularnewline
1 & 341.25 & NA \tabularnewline
2 & 303.6875 & 341.25 \tabularnewline
3 & 357.5 & 337.49375 \tabularnewline
4 & 295.075 & 339.494375 \tabularnewline
5 & 386.5755 & 335.0524375 \tabularnewline
6 & 455.6625 & 340.20474375 \tabularnewline
7 & 424.926 & 351.750519375 \tabularnewline
8 & 506.751 & 359.0680674375 \tabularnewline
9 & 433.9 & 373.83636069375 \tabularnewline
10 & 466.3375 & 379.842724624375 \tabularnewline
11 & 496.7 & 388.492202161938 \tabularnewline
12 & 464.45 & 399.312981945744 \tabularnewline
13 & 385.375 & 405.826683751169 \tabularnewline
14 & 381.875 & 403.781515376053 \tabularnewline
15 & 219.6375 & 401.590863838447 \tabularnewline
16 & 268.975 & 383.395527454603 \tabularnewline
17 & 292.2875 & 371.953474709142 \tabularnewline
18 & 181.025 & 363.986877238228 \tabularnewline
19 & 277.625 & 345.690689514405 \tabularnewline
20 & 166.75 & 338.884120562965 \tabularnewline
21 & 266 & 321.670708506668 \tabularnewline
22 & 189.25 & 316.103637656002 \tabularnewline
23 & 226.35 & 303.418273890401 \tabularnewline
24 & 158.75 & 295.711446501361 \tabularnewline
25 & 218.8125 & 282.015301851225 \tabularnewline
\hline
\end{tabular}
%Source: https://freestatistics.org/blog/index.php?pk=75922&T=2

[TABLE]
[ROW][C]Actuals and Interpolation[/C][/ROW]
[ROW][C]Time[/C][C]Actual[/C][C]Forecast[/C][/ROW]
[ROW][C]1[/C][C]341.25[/C][C]NA[/C][/ROW]
[ROW][C]2[/C][C]303.6875[/C][C]341.25[/C][/ROW]
[ROW][C]3[/C][C]357.5[/C][C]337.49375[/C][/ROW]
[ROW][C]4[/C][C]295.075[/C][C]339.494375[/C][/ROW]
[ROW][C]5[/C][C]386.5755[/C][C]335.0524375[/C][/ROW]
[ROW][C]6[/C][C]455.6625[/C][C]340.20474375[/C][/ROW]
[ROW][C]7[/C][C]424.926[/C][C]351.750519375[/C][/ROW]
[ROW][C]8[/C][C]506.751[/C][C]359.0680674375[/C][/ROW]
[ROW][C]9[/C][C]433.9[/C][C]373.83636069375[/C][/ROW]
[ROW][C]10[/C][C]466.3375[/C][C]379.842724624375[/C][/ROW]
[ROW][C]11[/C][C]496.7[/C][C]388.492202161938[/C][/ROW]
[ROW][C]12[/C][C]464.45[/C][C]399.312981945744[/C][/ROW]
[ROW][C]13[/C][C]385.375[/C][C]405.826683751169[/C][/ROW]
[ROW][C]14[/C][C]381.875[/C][C]403.781515376053[/C][/ROW]
[ROW][C]15[/C][C]219.6375[/C][C]401.590863838447[/C][/ROW]
[ROW][C]16[/C][C]268.975[/C][C]383.395527454603[/C][/ROW]
[ROW][C]17[/C][C]292.2875[/C][C]371.953474709142[/C][/ROW]
[ROW][C]18[/C][C]181.025[/C][C]363.986877238228[/C][/ROW]
[ROW][C]19[/C][C]277.625[/C][C]345.690689514405[/C][/ROW]
[ROW][C]20[/C][C]166.75[/C][C]338.884120562965[/C][/ROW]
[ROW][C]21[/C][C]266[/C][C]321.670708506668[/C][/ROW]
[ROW][C]22[/C][C]189.25[/C][C]316.103637656002[/C][/ROW]
[ROW][C]23[/C][C]226.35[/C][C]303.418273890401[/C][/ROW]
[ROW][C]24[/C][C]158.75[/C][C]295.711446501361[/C][/ROW]
[ROW][C]25[/C][C]218.8125[/C][C]282.015301851225[/C][/ROW]
[/TABLE]
Source: https://freestatistics.org/blog/index.php?pk=75922&T=2

Globally Unique Identifier (entire table): ba.freestatistics.org/blog/index.php?pk=75922&T=2

As an alternative you can also use a QR Code:  

The GUIDs for individual cells are displayed in the table below:

Actuals and Interpolation
TimeActualForecast
1341.25NA
2303.6875341.25
3357.5337.49375
4295.075339.494375
5386.5755335.0524375
6455.6625340.20474375
7424.926351.750519375
8506.751359.0680674375
9433.9373.83636069375
10466.3375379.842724624375
11496.7388.492202161938
12464.45399.312981945744
13385.375405.826683751169
14381.875403.781515376053
15219.6375401.590863838447
16268.975383.395527454603
17292.2875371.953474709142
18181.025363.986877238228
19277.625345.690689514405
20166.75338.884120562965
21266321.670708506668
22189.25316.103637656002
23226.35303.418273890401
24158.75295.711446501361
25218.8125282.015301851225


\begin{tabular}{lllllllll}
\hline
What is next? \tabularnewline
Simulate Time Series \tabularnewline
Generate Forecasts \tabularnewline
Forecast Analysis \tabularnewline
\hline
\end{tabular}
%Source: https://freestatistics.org/blog/index.php?pk=75922&T=3

[TABLE]
[ROW][C]What is next?[/C][/ROW]
[ROW][C]Simulate Time Series[/C][/ROW]
[ROW][C]Generate Forecasts[/C][/ROW]
[ROW][C]Forecast Analysis[/C][/ROW]
[/TABLE]
Source: https://freestatistics.org/blog/index.php?pk=75922&T=3

Globally Unique Identifier (entire table): ba.freestatistics.org/blog/index.php?pk=75922&T=3

As an alternative you can also use a QR Code:  

The GUIDs for individual cells are displayed in the table below:

What is next?
Simulate Time Series
Generate Forecasts
Forecast Analysis


Parameters (Session):
par1 = Input box ; par2 = ARIMA ; par3 = NA ; par4 = NA ; par5 = ZZZ ; par6 = 12 ; par7 = dum ; par8 = dumresult ; par9 = 3 ; par10 = 0.1 ;
Parameters (R input):
par1 = Input box ; par2 = Croston ; par3 = NA ; par4 = NA ; par5 = ZZZ ; par6 = 12 ; par7 = dum ; par8 = dumresult ; par9 = 3 ; par10 = 0.1 ;
R code (references can be found in the software module):
if(par3!='NA') par3 <- as.numeric(par3) else par3 <- NA
if(par4!='NA') par4 <- as.numeric(par4) else par4 <- NA
par6 <- as.numeric(par6) #Seasonal Period
par9 <- as.numeric(par9) #Forecast Horizon
par10 <- as.numeric(par10) #Alpha
library(forecast)
if (par1 == 'CSV') {
xarr <- read.csv(file=paste('tmp/',par7,'.csv',sep=''),header=T)
numseries <- length(xarr[1,])-1
n <- length(xarr[,1])
nmh <- n - par9
nmhp1 <- nmh + 1
rarr <- array(NA,dim=c(n,numseries))
farr <- array(NA,dim=c(n,numseries))
parr <- array(NA,dim=c(numseries,8))
colnames(parr) = list('ME','RMSE','MAE','MPE','MAPE','MASE','ACF1','TheilU')
for(i in 1:numseries) {
sindex <- i+1
x <- xarr[,sindex]
if(par2=='Croston') {
if (i==1) m <- croston(x,alpha=par10)
if (i==1) mydemand <- m$model$demand[]
fit <- croston(x[1:nmh],h=par9,alpha=par10)
}
if(par2=='ARIMA') {
m <- auto.arima(ts(x,freq=par6),d=par3,D=par4)
mydemand <- forecast(m)
fit <- auto.arima(ts(x[1:nmh],freq=par6),d=par3,D=par4)
}
if(par2=='ETS') {
m <- ets(ts(x,freq=par6),model=par5)
mydemand <- forecast(m)
fit <- ets(ts(x[1:nmh],freq=par6),model=par5)
}
try(rarr[,i] <- mydemand$resid,silent=T)
try(farr[,i] <- mydemand$mean,silent=T)
if (par2!='Croston') parr[i,] <- accuracy(forecast(fit,par9),x[nmhp1:n])
if (par2=='Croston') parr[i,] <- accuracy(fit,x[nmhp1:n])
}
write.csv(farr,file=paste('tmp/',par8,'_f.csv',sep=''))
write.csv(rarr,file=paste('tmp/',par8,'_r.csv',sep=''))
write.csv(parr,file=paste('tmp/',par8,'_p.csv',sep=''))
}
if (par1 == 'Input box') {
numseries <- 1
n <- length(x)
if(par2=='Croston') {
m <- croston(x)
mydemand <- m$model$demand[]
}
if(par2=='ARIMA') {
m <- auto.arima(ts(x,freq=par6),d=par3,D=par4)
mydemand <- forecast(m)
}
if(par2=='ETS') {
m <- ets(ts(x,freq=par6),model=par5)
mydemand <- forecast(m)
}
summary(m)
}
bitmap(file='test1.png')
op <- par(mfrow=c(2,1))
if (par2=='Croston') plot(m)
if ((par2=='ARIMA') | par2=='ETS') plot(forecast(m))
plot(mydemand$resid,type='l',main='Residuals', ylab='residual value', xlab='time')
par(op)
dev.off()
bitmap(file='pic2.png')
op <- par(mfrow=c(2,2))
acf(mydemand$resid, lag.max=n/3, main='Residual ACF', ylab='autocorrelation', xlab='time lag')
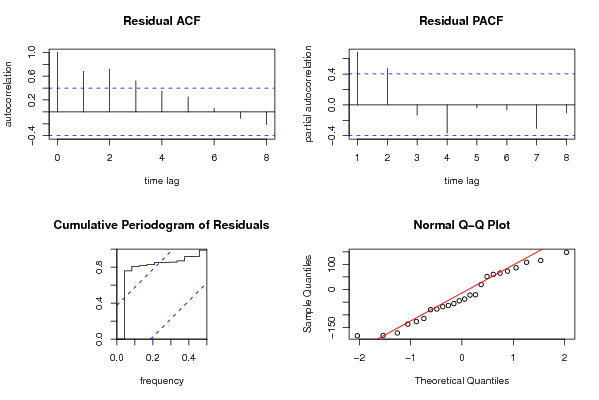
pacf(mydemand$resid,lag.max=n/3, main='Residual PACF', ylab='partial autocorrelation', xlab='time lag')
cpgram(mydemand$resid, main='Cumulative Periodogram of Residuals')
qqnorm(mydemand$resid); qqline(mydemand$resid, col=2)
par(op)
dev.off()
load(file='createtable')
a<-table.start()
a<-table.row.start(a)
a<-table.element(a,'Demand Forecast',6,TRUE)
a<-table.row.end(a)
a<-table.row.start(a)
a<-table.element(a,'Point',header=TRUE)
a<-table.element(a,'Forecast',header=TRUE)
a<-table.element(a,'95% LB',header=TRUE)
a<-table.element(a,'80% LB',header=TRUE)
a<-table.element(a,'80% UB',header=TRUE)
a<-table.element(a,'95% UB',header=TRUE)
a<-table.row.end(a)
for (i in 1:length(mydemand$mean)) {
a<-table.row.start(a)
a<-table.element(a,i+n,header=TRUE)
a<-table.element(a,as.numeric(mydemand$mean[i]))
a<-table.element(a,as.numeric(mydemand$lower[i,2]))
a<-table.element(a,as.numeric(mydemand$lower[i,1]))
a<-table.element(a,as.numeric(mydemand$upper[i,1]))
a<-table.element(a,as.numeric(mydemand$upper[i,2]))
a<-table.row.end(a)
}
a<-table.end(a)
table.save(a,file='mytable.tab')
a<-table.start()
a<-table.row.start(a)
a<-table.element(a,'Actuals and Interpolation',3,TRUE)
a<-table.row.end(a)
a<-table.row.start(a)
a<-table.element(a,'Time',header=TRUE)
a<-table.element(a,'Actual',header=TRUE)
a<-table.element(a,'Forecast',header=TRUE)
a<-table.row.end(a)
for (i in 1:n) {
a<-table.row.start(a)
a<-table.element(a,i,header=TRUE)
a<-table.element(a,x[i])
a<-table.element(a,x[i] - as.numeric(m$resid[i]))
a<-table.row.end(a)
}
a<-table.end(a)
table.save(a,file='mytable1.tab')
a<-table.start()
a<-table.row.start(a)
a<-table.element(a,'What is next?',1,TRUE)
a<-table.row.end(a)
a<-table.row.start(a)
a<-table.element(a,hyperlink(paste('https://automated.biganalytics.eu/Patrick.Wessa/rwasp_demand_forecasting_simulate.wasp',sep=''),'Simulate Time Series','',target=''))
a<-table.row.end(a)
a<-table.row.start(a)
a<-table.element(a,hyperlink(paste('https://automated.biganalytics.eu/Patrick.Wessa/rwasp_demand_forecasting_croston.wasp',sep=''),'Generate Forecasts','',target=''))
a<-table.row.end(a)
a<-table.row.start(a)
a<-table.element(a,hyperlink(paste('https://automated.biganalytics.eu/Patrick.Wessa/rwasp_demand_forecasting_analysis.wasp',sep=''),'Forecast Analysis','',target=''))
a<-table.row.end(a)
a<-table.end(a)
table.save(a,file='mytable0.tab')
-SERVER-wessa.org