Free Statistics

of Irreproducible Research!

Author's title

Author*Unverified author*
R Software ModulePatrick.Wessarwasp_demand_forecasting_croston.wasp
Title produced by softwareCroston Forecasting
Date of computationThu, 13 May 2010 13:25:51 +0000
Cite this page as followsStatistical Computations at FreeStatistics.org, Office for Research Development and Education, URL https://freestatistics.org/blog/index.php?v=date/2010/May/13/t12737571874l1rdlkbk1x1dcz.htm/, Retrieved Sun, 05 May 2024 20:40:01 +0000
Statistical Computations at FreeStatistics.org, Office for Research Development and Education, URL https://freestatistics.org/blog/index.php?pk=75934, Retrieved Sun, 05 May 2024 20:40:01 +0000
QR Codes:

Original text written by user:
IsPrivate?No (this computation is public)
User-defined keywordsFM50,steven,coomans,thesis,ETS,per2maand
Estimated Impact134
Family? (F = Feedback message, R = changed R code, M = changed R Module, P = changed Parameters, D = changed Data)
-       [Croston Forecasting] [FM50,steven,cooma...] [2010-05-13 13:25:51] [d41d8cd98f00b204e9800998ecf8427e] [Current]
Feedback Forum

Post a new message
Dataseries X:
1201.42
1157.2125
1722.05
1918.2475
1930.4575
1264.1775
1456.3725
2168.985
1983.765
1672.695
1938.575
1307.6425
1523.3425
1928.39
2208.435
2290.175
2578.245
1152.84
1398.7575
1393.9175
1972.2525
2410.4775
2363.27
1341.6075
1437.0425


Summary of computational transaction
Raw Inputview raw input (R code)
Raw Outputview raw output of R engine
Computing time10 seconds
R Serverwessa.org @ wessa.org

\begin{tabular}{lllllllll}
\hline
Summary of computational transaction \tabularnewline
Raw Input & view raw input (R code)  \tabularnewline
Raw Output & view raw output of R engine  \tabularnewline
Computing time & 10 seconds \tabularnewline
R Server & wessa.org @ wessa.org \tabularnewline
\hline
\end{tabular}
%Source: https://freestatistics.org/blog/index.php?pk=75934&T=0

[TABLE]
[ROW][C]Summary of computational transaction[/C][/ROW]
[ROW][C]Raw Input[/C][C]view raw input (R code) [/C][/ROW]
[ROW][C]Raw Output[/C][C]view raw output of R engine [/C][/ROW]
[ROW][C]Computing time[/C][C]10 seconds[/C][/ROW]
[ROW][C]R Server[/C][C]wessa.org @ wessa.org[/C][/ROW]
[/TABLE]
Source: https://freestatistics.org/blog/index.php?pk=75934&T=0

Globally Unique Identifier (entire table): ba.freestatistics.org/blog/index.php?pk=75934&T=0

As an alternative you can also use a QR Code:  

The GUIDs for individual cells are displayed in the table below:

Summary of computational transaction
Raw Inputview raw input (R code)
Raw Outputview raw output of R engine
Computing time10 seconds
R Serverwessa.org @ wessa.org


Demand Forecast
PointForecast95% LB80% LB80% UB95% UB
261681.979872481491247.641279271901397.981131435841965.978613527142116.31846569108
272129.165822785241469.950341438931698.127988001332560.203657569162788.38130413156
282266.190396916121464.157166891951741.769055675272790.611738156983068.22362694030
292390.248192070801449.607350050611775.196204781833005.300179359783330.889034091
301318.44583127858751.816261231706947.946669913711688.944992643441885.07540132544
311493.76446504982801.5199547705721041.130109068931946.398821030712186.00897532907
321917.62131038867968.3642687065621296.935492961562538.307127815772866.87835207077
332127.127762920401010.535611810441397.027398517232857.228127323573243.71991403036
342231.48850891680996.5114148158721423.980390991783038.996626841813466.46560301772
352228.53512834891934.3482643616541382.311822853153074.758433844673522.72199233616
361344.63743152739528.442557552127810.95628902521878.318574029572160.83230550265
371447.39925728933532.122686958468848.9320758175882045.866438761072362.67582762019
381681.98178959975577.043696578176959.5016041926862404.461975006812786.91988262132
392129.16824960541679.6865906415961181.403135590223076.933363620593578.64990856922
402266.19297991670670.8325125037921223.042840042693309.343119790713861.55344732961
412390.25091647228653.4573384803581254.622636330343525.879196614224127.0444944642
421318.44733404125331.29153062565672.9808482881561963.913819794352305.60313745685
431493.76616764043343.028420108815741.3391978017532246.19313747912644.50391517204
441917.62349609070399.713518594266925.1155095356172910.131482645783435.53347358713
452127.13018741758399.14574118992997.2618889348133256.998485900363855.11463364525
462231.49105236421373.1454919453021016.384202920453446.597901807984089.83661278312
472228.53766843007327.891288549986985.7717998247823471.303537035354129.18404831015
481344.63896414321171.260302652134577.4078963930542111.870031893372518.01762563429
491447.40090703293156.164210993368603.1066126729932291.695201392882738.6376030725

\begin{tabular}{lllllllll}
\hline
Demand Forecast \tabularnewline
Point & Forecast & 95% LB & 80% LB & 80% UB & 95% UB \tabularnewline
26 & 1681.97987248149 & 1247.64127927190 & 1397.98113143584 & 1965.97861352714 & 2116.31846569108 \tabularnewline
27 & 2129.16582278524 & 1469.95034143893 & 1698.12798800133 & 2560.20365756916 & 2788.38130413156 \tabularnewline
28 & 2266.19039691612 & 1464.15716689195 & 1741.76905567527 & 2790.61173815698 & 3068.22362694030 \tabularnewline
29 & 2390.24819207080 & 1449.60735005061 & 1775.19620478183 & 3005.30017935978 & 3330.889034091 \tabularnewline
30 & 1318.44583127858 & 751.816261231706 & 947.94666991371 & 1688.94499264344 & 1885.07540132544 \tabularnewline
31 & 1493.76446504982 & 801.519954770572 & 1041.13010906893 & 1946.39882103071 & 2186.00897532907 \tabularnewline
32 & 1917.62131038867 & 968.364268706562 & 1296.93549296156 & 2538.30712781577 & 2866.87835207077 \tabularnewline
33 & 2127.12776292040 & 1010.53561181044 & 1397.02739851723 & 2857.22812732357 & 3243.71991403036 \tabularnewline
34 & 2231.48850891680 & 996.511414815872 & 1423.98039099178 & 3038.99662684181 & 3466.46560301772 \tabularnewline
35 & 2228.53512834891 & 934.348264361654 & 1382.31182285315 & 3074.75843384467 & 3522.72199233616 \tabularnewline
36 & 1344.63743152739 & 528.442557552127 & 810.9562890252 & 1878.31857402957 & 2160.83230550265 \tabularnewline
37 & 1447.39925728933 & 532.122686958468 & 848.932075817588 & 2045.86643876107 & 2362.67582762019 \tabularnewline
38 & 1681.98178959975 & 577.043696578176 & 959.501604192686 & 2404.46197500681 & 2786.91988262132 \tabularnewline
39 & 2129.16824960541 & 679.686590641596 & 1181.40313559022 & 3076.93336362059 & 3578.64990856922 \tabularnewline
40 & 2266.19297991670 & 670.832512503792 & 1223.04284004269 & 3309.34311979071 & 3861.55344732961 \tabularnewline
41 & 2390.25091647228 & 653.457338480358 & 1254.62263633034 & 3525.87919661422 & 4127.0444944642 \tabularnewline
42 & 1318.44733404125 & 331.29153062565 & 672.980848288156 & 1963.91381979435 & 2305.60313745685 \tabularnewline
43 & 1493.76616764043 & 343.028420108815 & 741.339197801753 & 2246.1931374791 & 2644.50391517204 \tabularnewline
44 & 1917.62349609070 & 399.713518594266 & 925.115509535617 & 2910.13148264578 & 3435.53347358713 \tabularnewline
45 & 2127.13018741758 & 399.14574118992 & 997.261888934813 & 3256.99848590036 & 3855.11463364525 \tabularnewline
46 & 2231.49105236421 & 373.145491945302 & 1016.38420292045 & 3446.59790180798 & 4089.83661278312 \tabularnewline
47 & 2228.53766843007 & 327.891288549986 & 985.771799824782 & 3471.30353703535 & 4129.18404831015 \tabularnewline
48 & 1344.63896414321 & 171.260302652134 & 577.407896393054 & 2111.87003189337 & 2518.01762563429 \tabularnewline
49 & 1447.40090703293 & 156.164210993368 & 603.106612672993 & 2291.69520139288 & 2738.6376030725 \tabularnewline
\hline
\end{tabular}
%Source: https://freestatistics.org/blog/index.php?pk=75934&T=1

[TABLE]
[ROW][C]Demand Forecast[/C][/ROW]
[ROW][C]Point[/C][C]Forecast[/C][C]95% LB[/C][C]80% LB[/C][C]80% UB[/C][C]95% UB[/C][/ROW]
[ROW][C]26[/C][C]1681.97987248149[/C][C]1247.64127927190[/C][C]1397.98113143584[/C][C]1965.97861352714[/C][C]2116.31846569108[/C][/ROW]
[ROW][C]27[/C][C]2129.16582278524[/C][C]1469.95034143893[/C][C]1698.12798800133[/C][C]2560.20365756916[/C][C]2788.38130413156[/C][/ROW]
[ROW][C]28[/C][C]2266.19039691612[/C][C]1464.15716689195[/C][C]1741.76905567527[/C][C]2790.61173815698[/C][C]3068.22362694030[/C][/ROW]
[ROW][C]29[/C][C]2390.24819207080[/C][C]1449.60735005061[/C][C]1775.19620478183[/C][C]3005.30017935978[/C][C]3330.889034091[/C][/ROW]
[ROW][C]30[/C][C]1318.44583127858[/C][C]751.816261231706[/C][C]947.94666991371[/C][C]1688.94499264344[/C][C]1885.07540132544[/C][/ROW]
[ROW][C]31[/C][C]1493.76446504982[/C][C]801.519954770572[/C][C]1041.13010906893[/C][C]1946.39882103071[/C][C]2186.00897532907[/C][/ROW]
[ROW][C]32[/C][C]1917.62131038867[/C][C]968.364268706562[/C][C]1296.93549296156[/C][C]2538.30712781577[/C][C]2866.87835207077[/C][/ROW]
[ROW][C]33[/C][C]2127.12776292040[/C][C]1010.53561181044[/C][C]1397.02739851723[/C][C]2857.22812732357[/C][C]3243.71991403036[/C][/ROW]
[ROW][C]34[/C][C]2231.48850891680[/C][C]996.511414815872[/C][C]1423.98039099178[/C][C]3038.99662684181[/C][C]3466.46560301772[/C][/ROW]
[ROW][C]35[/C][C]2228.53512834891[/C][C]934.348264361654[/C][C]1382.31182285315[/C][C]3074.75843384467[/C][C]3522.72199233616[/C][/ROW]
[ROW][C]36[/C][C]1344.63743152739[/C][C]528.442557552127[/C][C]810.9562890252[/C][C]1878.31857402957[/C][C]2160.83230550265[/C][/ROW]
[ROW][C]37[/C][C]1447.39925728933[/C][C]532.122686958468[/C][C]848.932075817588[/C][C]2045.86643876107[/C][C]2362.67582762019[/C][/ROW]
[ROW][C]38[/C][C]1681.98178959975[/C][C]577.043696578176[/C][C]959.501604192686[/C][C]2404.46197500681[/C][C]2786.91988262132[/C][/ROW]
[ROW][C]39[/C][C]2129.16824960541[/C][C]679.686590641596[/C][C]1181.40313559022[/C][C]3076.93336362059[/C][C]3578.64990856922[/C][/ROW]
[ROW][C]40[/C][C]2266.19297991670[/C][C]670.832512503792[/C][C]1223.04284004269[/C][C]3309.34311979071[/C][C]3861.55344732961[/C][/ROW]
[ROW][C]41[/C][C]2390.25091647228[/C][C]653.457338480358[/C][C]1254.62263633034[/C][C]3525.87919661422[/C][C]4127.0444944642[/C][/ROW]
[ROW][C]42[/C][C]1318.44733404125[/C][C]331.29153062565[/C][C]672.980848288156[/C][C]1963.91381979435[/C][C]2305.60313745685[/C][/ROW]
[ROW][C]43[/C][C]1493.76616764043[/C][C]343.028420108815[/C][C]741.339197801753[/C][C]2246.1931374791[/C][C]2644.50391517204[/C][/ROW]
[ROW][C]44[/C][C]1917.62349609070[/C][C]399.713518594266[/C][C]925.115509535617[/C][C]2910.13148264578[/C][C]3435.53347358713[/C][/ROW]
[ROW][C]45[/C][C]2127.13018741758[/C][C]399.14574118992[/C][C]997.261888934813[/C][C]3256.99848590036[/C][C]3855.11463364525[/C][/ROW]
[ROW][C]46[/C][C]2231.49105236421[/C][C]373.145491945302[/C][C]1016.38420292045[/C][C]3446.59790180798[/C][C]4089.83661278312[/C][/ROW]
[ROW][C]47[/C][C]2228.53766843007[/C][C]327.891288549986[/C][C]985.771799824782[/C][C]3471.30353703535[/C][C]4129.18404831015[/C][/ROW]
[ROW][C]48[/C][C]1344.63896414321[/C][C]171.260302652134[/C][C]577.407896393054[/C][C]2111.87003189337[/C][C]2518.01762563429[/C][/ROW]
[ROW][C]49[/C][C]1447.40090703293[/C][C]156.164210993368[/C][C]603.106612672993[/C][C]2291.69520139288[/C][C]2738.6376030725[/C][/ROW]
[/TABLE]
Source: https://freestatistics.org/blog/index.php?pk=75934&T=1

Globally Unique Identifier (entire table): ba.freestatistics.org/blog/index.php?pk=75934&T=1

As an alternative you can also use a QR Code:  

The GUIDs for individual cells are displayed in the table below:

Demand Forecast
PointForecast95% LB80% LB80% UB95% UB
261681.979872481491247.641279271901397.981131435841965.978613527142116.31846569108
272129.165822785241469.950341438931698.127988001332560.203657569162788.38130413156
282266.190396916121464.157166891951741.769055675272790.611738156983068.22362694030
292390.248192070801449.607350050611775.196204781833005.300179359783330.889034091
301318.44583127858751.816261231706947.946669913711688.944992643441885.07540132544
311493.76446504982801.5199547705721041.130109068931946.398821030712186.00897532907
321917.62131038867968.3642687065621296.935492961562538.307127815772866.87835207077
332127.127762920401010.535611810441397.027398517232857.228127323573243.71991403036
342231.48850891680996.5114148158721423.980390991783038.996626841813466.46560301772
352228.53512834891934.3482643616541382.311822853153074.758433844673522.72199233616
361344.63743152739528.442557552127810.95628902521878.318574029572160.83230550265
371447.39925728933532.122686958468848.9320758175882045.866438761072362.67582762019
381681.98178959975577.043696578176959.5016041926862404.461975006812786.91988262132
392129.16824960541679.6865906415961181.403135590223076.933363620593578.64990856922
402266.19297991670670.8325125037921223.042840042693309.343119790713861.55344732961
412390.25091647228653.4573384803581254.622636330343525.879196614224127.0444944642
421318.44733404125331.29153062565672.9808482881561963.913819794352305.60313745685
431493.76616764043343.028420108815741.3391978017532246.19313747912644.50391517204
441917.62349609070399.713518594266925.1155095356172910.131482645783435.53347358713
452127.13018741758399.14574118992997.2618889348133256.998485900363855.11463364525
462231.49105236421373.1454919453021016.384202920453446.597901807984089.83661278312
472228.53766843007327.891288549986985.7717998247823471.303537035354129.18404831015
481344.63896414321171.260302652134577.4078963930542111.870031893372518.01762563429
491447.40090703293156.164210993368603.1066126729932291.695201392882738.6376030725


Actuals and Interpolation
TimeActualForecast
11201.421201.52699174648
21157.21251157.41646441400
31722.051721.96970488708
41918.24751918.17344273383
51930.45751930.48017222676
61264.17751263.99969486656
71456.37251456.29994042014
82168.9852168.79723376114
91983.7651983.89302511237
101672.6951672.92990971789
111938.5751938.52541901855
121307.64251307.50607718124
131523.34251523.21360851071
141928.391928.25609237535
152208.4352208.49199362838
162290.1752290.220544191
172578.2452578.19488211031
181152.841153.01584440369
191398.75751398.7598374143
201393.91751394.14187074320
211972.25251972.09241634781
222410.47752410.25436087483
232363.272363.22252889700
241341.60751341.65173666235
251437.04251437.06301486057

\begin{tabular}{lllllllll}
\hline
Actuals and Interpolation \tabularnewline
Time & Actual & Forecast \tabularnewline
1 & 1201.42 & 1201.52699174648 \tabularnewline
2 & 1157.2125 & 1157.41646441400 \tabularnewline
3 & 1722.05 & 1721.96970488708 \tabularnewline
4 & 1918.2475 & 1918.17344273383 \tabularnewline
5 & 1930.4575 & 1930.48017222676 \tabularnewline
6 & 1264.1775 & 1263.99969486656 \tabularnewline
7 & 1456.3725 & 1456.29994042014 \tabularnewline
8 & 2168.985 & 2168.79723376114 \tabularnewline
9 & 1983.765 & 1983.89302511237 \tabularnewline
10 & 1672.695 & 1672.92990971789 \tabularnewline
11 & 1938.575 & 1938.52541901855 \tabularnewline
12 & 1307.6425 & 1307.50607718124 \tabularnewline
13 & 1523.3425 & 1523.21360851071 \tabularnewline
14 & 1928.39 & 1928.25609237535 \tabularnewline
15 & 2208.435 & 2208.49199362838 \tabularnewline
16 & 2290.175 & 2290.220544191 \tabularnewline
17 & 2578.245 & 2578.19488211031 \tabularnewline
18 & 1152.84 & 1153.01584440369 \tabularnewline
19 & 1398.7575 & 1398.7598374143 \tabularnewline
20 & 1393.9175 & 1394.14187074320 \tabularnewline
21 & 1972.2525 & 1972.09241634781 \tabularnewline
22 & 2410.4775 & 2410.25436087483 \tabularnewline
23 & 2363.27 & 2363.22252889700 \tabularnewline
24 & 1341.6075 & 1341.65173666235 \tabularnewline
25 & 1437.0425 & 1437.06301486057 \tabularnewline
\hline
\end{tabular}
%Source: https://freestatistics.org/blog/index.php?pk=75934&T=2

[TABLE]
[ROW][C]Actuals and Interpolation[/C][/ROW]
[ROW][C]Time[/C][C]Actual[/C][C]Forecast[/C][/ROW]
[ROW][C]1[/C][C]1201.42[/C][C]1201.52699174648[/C][/ROW]
[ROW][C]2[/C][C]1157.2125[/C][C]1157.41646441400[/C][/ROW]
[ROW][C]3[/C][C]1722.05[/C][C]1721.96970488708[/C][/ROW]
[ROW][C]4[/C][C]1918.2475[/C][C]1918.17344273383[/C][/ROW]
[ROW][C]5[/C][C]1930.4575[/C][C]1930.48017222676[/C][/ROW]
[ROW][C]6[/C][C]1264.1775[/C][C]1263.99969486656[/C][/ROW]
[ROW][C]7[/C][C]1456.3725[/C][C]1456.29994042014[/C][/ROW]
[ROW][C]8[/C][C]2168.985[/C][C]2168.79723376114[/C][/ROW]
[ROW][C]9[/C][C]1983.765[/C][C]1983.89302511237[/C][/ROW]
[ROW][C]10[/C][C]1672.695[/C][C]1672.92990971789[/C][/ROW]
[ROW][C]11[/C][C]1938.575[/C][C]1938.52541901855[/C][/ROW]
[ROW][C]12[/C][C]1307.6425[/C][C]1307.50607718124[/C][/ROW]
[ROW][C]13[/C][C]1523.3425[/C][C]1523.21360851071[/C][/ROW]
[ROW][C]14[/C][C]1928.39[/C][C]1928.25609237535[/C][/ROW]
[ROW][C]15[/C][C]2208.435[/C][C]2208.49199362838[/C][/ROW]
[ROW][C]16[/C][C]2290.175[/C][C]2290.220544191[/C][/ROW]
[ROW][C]17[/C][C]2578.245[/C][C]2578.19488211031[/C][/ROW]
[ROW][C]18[/C][C]1152.84[/C][C]1153.01584440369[/C][/ROW]
[ROW][C]19[/C][C]1398.7575[/C][C]1398.7598374143[/C][/ROW]
[ROW][C]20[/C][C]1393.9175[/C][C]1394.14187074320[/C][/ROW]
[ROW][C]21[/C][C]1972.2525[/C][C]1972.09241634781[/C][/ROW]
[ROW][C]22[/C][C]2410.4775[/C][C]2410.25436087483[/C][/ROW]
[ROW][C]23[/C][C]2363.27[/C][C]2363.22252889700[/C][/ROW]
[ROW][C]24[/C][C]1341.6075[/C][C]1341.65173666235[/C][/ROW]
[ROW][C]25[/C][C]1437.0425[/C][C]1437.06301486057[/C][/ROW]
[/TABLE]
Source: https://freestatistics.org/blog/index.php?pk=75934&T=2

Globally Unique Identifier (entire table): ba.freestatistics.org/blog/index.php?pk=75934&T=2

As an alternative you can also use a QR Code:  

The GUIDs for individual cells are displayed in the table below:

Actuals and Interpolation
TimeActualForecast
11201.421201.52699174648
21157.21251157.41646441400
31722.051721.96970488708
41918.24751918.17344273383
51930.45751930.48017222676
61264.17751263.99969486656
71456.37251456.29994042014
82168.9852168.79723376114
91983.7651983.89302511237
101672.6951672.92990971789
111938.5751938.52541901855
121307.64251307.50607718124
131523.34251523.21360851071
141928.391928.25609237535
152208.4352208.49199362838
162290.1752290.220544191
172578.2452578.19488211031
181152.841153.01584440369
191398.75751398.7598374143
201393.91751394.14187074320
211972.25251972.09241634781
222410.47752410.25436087483
232363.272363.22252889700
241341.60751341.65173666235
251437.04251437.06301486057


\begin{tabular}{lllllllll}
\hline
What is next? \tabularnewline
Simulate Time Series \tabularnewline
Generate Forecasts \tabularnewline
Forecast Analysis \tabularnewline
\hline
\end{tabular}
%Source: https://freestatistics.org/blog/index.php?pk=75934&T=3

[TABLE]
[ROW][C]What is next?[/C][/ROW]
[ROW][C]Simulate Time Series[/C][/ROW]
[ROW][C]Generate Forecasts[/C][/ROW]
[ROW][C]Forecast Analysis[/C][/ROW]
[/TABLE]
Source: https://freestatistics.org/blog/index.php?pk=75934&T=3

Globally Unique Identifier (entire table): ba.freestatistics.org/blog/index.php?pk=75934&T=3

As an alternative you can also use a QR Code:  

The GUIDs for individual cells are displayed in the table below:

What is next?
Simulate Time Series
Generate Forecasts
Forecast Analysis


Parameters (Session):
par1 = Input box ; par2 = ARIMA ; par3 = NA ; par4 = NA ; par5 = ZZZ ; par6 = 12 ; par7 = dum ; par8 = dumresult ; par9 = 3 ; par10 = 0.1 ;
Parameters (R input):
par1 = Input box ; par2 = ETS ; par3 = NA ; par4 = NA ; par5 = ZZZ ; par6 = 12 ; par7 = dum ; par8 = dumresult ; par9 = 3 ; par10 = 0.1 ;
R code (references can be found in the software module):
if(par3!='NA') par3 <- as.numeric(par3) else par3 <- NA
if(par4!='NA') par4 <- as.numeric(par4) else par4 <- NA
par6 <- as.numeric(par6) #Seasonal Period
par9 <- as.numeric(par9) #Forecast Horizon
par10 <- as.numeric(par10) #Alpha
library(forecast)
if (par1 == 'CSV') {
xarr <- read.csv(file=paste('tmp/',par7,'.csv',sep=''),header=T)
numseries <- length(xarr[1,])-1
n <- length(xarr[,1])
nmh <- n - par9
nmhp1 <- nmh + 1
rarr <- array(NA,dim=c(n,numseries))
farr <- array(NA,dim=c(n,numseries))
parr <- array(NA,dim=c(numseries,8))
colnames(parr) = list('ME','RMSE','MAE','MPE','MAPE','MASE','ACF1','TheilU')
for(i in 1:numseries) {
sindex <- i+1
x <- xarr[,sindex]
if(par2=='Croston') {
if (i==1) m <- croston(x,alpha=par10)
if (i==1) mydemand <- m$model$demand[]
fit <- croston(x[1:nmh],h=par9,alpha=par10)
}
if(par2=='ARIMA') {
m <- auto.arima(ts(x,freq=par6),d=par3,D=par4)
mydemand <- forecast(m)
fit <- auto.arima(ts(x[1:nmh],freq=par6),d=par3,D=par4)
}
if(par2=='ETS') {
m <- ets(ts(x,freq=par6),model=par5)
mydemand <- forecast(m)
fit <- ets(ts(x[1:nmh],freq=par6),model=par5)
}
try(rarr[,i] <- mydemand$resid,silent=T)
try(farr[,i] <- mydemand$mean,silent=T)
if (par2!='Croston') parr[i,] <- accuracy(forecast(fit,par9),x[nmhp1:n])
if (par2=='Croston') parr[i,] <- accuracy(fit,x[nmhp1:n])
}
write.csv(farr,file=paste('tmp/',par8,'_f.csv',sep=''))
write.csv(rarr,file=paste('tmp/',par8,'_r.csv',sep=''))
write.csv(parr,file=paste('tmp/',par8,'_p.csv',sep=''))
}
if (par1 == 'Input box') {
numseries <- 1
n <- length(x)
if(par2=='Croston') {
m <- croston(x)
mydemand <- m$model$demand[]
}
if(par2=='ARIMA') {
m <- auto.arima(ts(x,freq=par6),d=par3,D=par4)
mydemand <- forecast(m)
}
if(par2=='ETS') {
m <- ets(ts(x,freq=par6),model=par5)
mydemand <- forecast(m)
}
summary(m)
}
bitmap(file='test1.png')
op <- par(mfrow=c(2,1))
if (par2=='Croston') plot(m)
if ((par2=='ARIMA') | par2=='ETS') plot(forecast(m))
plot(mydemand$resid,type='l',main='Residuals', ylab='residual value', xlab='time')
par(op)
dev.off()
bitmap(file='pic2.png')
op <- par(mfrow=c(2,2))
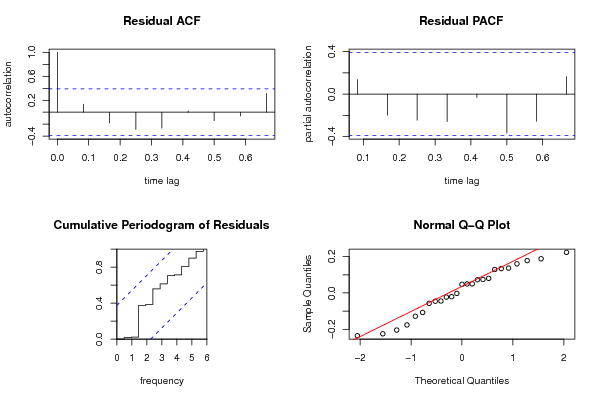
acf(mydemand$resid, lag.max=n/3, main='Residual ACF', ylab='autocorrelation', xlab='time lag')
pacf(mydemand$resid,lag.max=n/3, main='Residual PACF', ylab='partial autocorrelation', xlab='time lag')
cpgram(mydemand$resid, main='Cumulative Periodogram of Residuals')
qqnorm(mydemand$resid); qqline(mydemand$resid, col=2)
par(op)
dev.off()
load(file='createtable')
a<-table.start()
a<-table.row.start(a)
a<-table.element(a,'Demand Forecast',6,TRUE)
a<-table.row.end(a)
a<-table.row.start(a)
a<-table.element(a,'Point',header=TRUE)
a<-table.element(a,'Forecast',header=TRUE)
a<-table.element(a,'95% LB',header=TRUE)
a<-table.element(a,'80% LB',header=TRUE)
a<-table.element(a,'80% UB',header=TRUE)
a<-table.element(a,'95% UB',header=TRUE)
a<-table.row.end(a)
for (i in 1:length(mydemand$mean)) {
a<-table.row.start(a)
a<-table.element(a,i+n,header=TRUE)
a<-table.element(a,as.numeric(mydemand$mean[i]))
a<-table.element(a,as.numeric(mydemand$lower[i,2]))
a<-table.element(a,as.numeric(mydemand$lower[i,1]))
a<-table.element(a,as.numeric(mydemand$upper[i,1]))
a<-table.element(a,as.numeric(mydemand$upper[i,2]))
a<-table.row.end(a)
}
a<-table.end(a)
table.save(a,file='mytable.tab')
a<-table.start()
a<-table.row.start(a)
a<-table.element(a,'Actuals and Interpolation',3,TRUE)
a<-table.row.end(a)
a<-table.row.start(a)
a<-table.element(a,'Time',header=TRUE)
a<-table.element(a,'Actual',header=TRUE)
a<-table.element(a,'Forecast',header=TRUE)
a<-table.row.end(a)
for (i in 1:n) {
a<-table.row.start(a)
a<-table.element(a,i,header=TRUE)
a<-table.element(a,x[i])
a<-table.element(a,x[i] - as.numeric(m$resid[i]))
a<-table.row.end(a)
}
a<-table.end(a)
table.save(a,file='mytable1.tab')
a<-table.start()
a<-table.row.start(a)
a<-table.element(a,'What is next?',1,TRUE)
a<-table.row.end(a)
a<-table.row.start(a)
a<-table.element(a,hyperlink(paste('https://automated.biganalytics.eu/Patrick.Wessa/rwasp_demand_forecasting_simulate.wasp',sep=''),'Simulate Time Series','',target=''))
a<-table.row.end(a)
a<-table.row.start(a)
a<-table.element(a,hyperlink(paste('https://automated.biganalytics.eu/Patrick.Wessa/rwasp_demand_forecasting_croston.wasp',sep=''),'Generate Forecasts','',target=''))
a<-table.row.end(a)
a<-table.row.start(a)
a<-table.element(a,hyperlink(paste('https://automated.biganalytics.eu/Patrick.Wessa/rwasp_demand_forecasting_analysis.wasp',sep=''),'Forecast Analysis','',target=''))
a<-table.row.end(a)
a<-table.end(a)
table.save(a,file='mytable0.tab')
-SERVER-wessa.org