Free Statistics

of Irreproducible Research!

Author's title

Author*Unverified author*
R Software ModulePatrick.Wessarwasp_demand_forecasting_croston.wasp
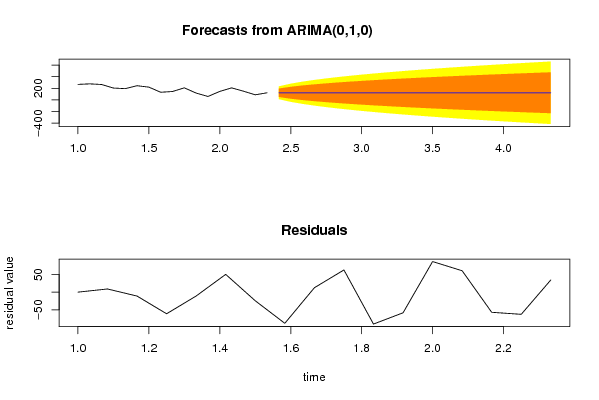
Title produced by softwareCroston Forecasting
Date of computationThu, 13 May 2010 14:00:22 +0000
Cite this page as followsStatistical Computations at FreeStatistics.org, Office for Research Development and Education, URL https://freestatistics.org/blog/index.php?v=date/2010/May/13/t12737592633h8e0cp2ld0fl3v.htm/, Retrieved Sun, 05 May 2024 22:12:01 +0000
Statistical Computations at FreeStatistics.org, Office for Research Development and Education, URL https://freestatistics.org/blog/index.php?pk=75947, Retrieved Sun, 05 May 2024 22:12:01 +0000
QR Codes:

Original text written by user:
IsPrivate?No (this computation is public)
User-defined keywordsB382,steven,coomans,thesis,ARIMA,Per3maand
Estimated Impact112
Family? (F = Feedback message, R = changed R code, M = changed R Module, P = changed Parameters, D = changed Data)
-       [Croston Forecasting] [B382,steven,cooma...] [2010-05-13 14:00:22] [d41d8cd98f00b204e9800998ecf8427e] [Current]
Feedback Forum

Post a new message
Dataseries X:
266.75
275.9833333
265.1016667
203.9416667
193.25
243.9416667
219.6583333
131.4436667
144.1833333
207.4166667
117.0666667
58.66666667
145.7583333
206.7033333
149.7666667
87.06666667
121.9083333


Summary of computational transaction
Raw Inputview raw input (R code)
Raw Outputview raw output of R engine
Computing time2 seconds
R Serverwessa.org @ wessa.org

\begin{tabular}{lllllllll}
\hline
Summary of computational transaction \tabularnewline
Raw Input & view raw input (R code)  \tabularnewline
Raw Output & view raw output of R engine  \tabularnewline
Computing time & 2 seconds \tabularnewline
R Server & wessa.org @ wessa.org \tabularnewline
\hline
\end{tabular}
%Source: https://freestatistics.org/blog/index.php?pk=75947&T=0

[TABLE]
[ROW][C]Summary of computational transaction[/C][/ROW]
[ROW][C]Raw Input[/C][C]view raw input (R code) [/C][/ROW]
[ROW][C]Raw Output[/C][C]view raw output of R engine [/C][/ROW]
[ROW][C]Computing time[/C][C]2 seconds[/C][/ROW]
[ROW][C]R Server[/C][C]wessa.org @ wessa.org[/C][/ROW]
[/TABLE]
Source: https://freestatistics.org/blog/index.php?pk=75947&T=0

Globally Unique Identifier (entire table): ba.freestatistics.org/blog/index.php?pk=75947&T=0

As an alternative you can also use a QR Code:  

The GUIDs for individual cells are displayed in the table below:

Summary of computational transaction
Raw Inputview raw input (R code)
Raw Outputview raw output of R engine
Computing time2 seconds
R Serverwessa.org @ wessa.org


Demand Forecast
PointForecast95% LB80% LB80% UB95% UB
18121.908333311.883390826478649.966890299972193.849776300028231.933275773521
19121.9083333-33.690432545373620.1677689126695223.648897687331277.507099145374
20121.9083333-68.660457163982-2.69790114586881246.514567745869312.477123763982
21121.9083333-98.1415516470428-21.974552700056265.791219300056341.958218247043
22121.9083333-124.114917291298-38.957623647489282.774290247489367.931583891298
23121.9083333-147.5966347392-54.3114934095892298.128160009589391.4133013392
24121.9083333-169.190302499125-68.4308338372025312.247500437203413.006969099125
25121.9083333-189.289198390747-81.572795474661325.389462074661433.105864990747
26121.9083333-208.166494120564-93.915995700084337.732662300084451.983160720564
27121.9083333-226.021084345328-105.590484739265349.407151339265469.837750945328
28121.9083333-243.003118465108-116.694440007833360.511106607833486.819785065108
29121.9083333-259.229247627964-127.304135591738371.120802191738503.045914227964
30121.9083333-274.792238368257-137.480228267471381.296894867471518.608904968257
31121.9083333-289.767305435429-147.271898316231391.088564916231533.583972035429
32121.9083333-304.216436567377-156.719677341239400.536343941238548.033103167377
33121.9083333-318.191436594086-165.857438700112409.674105300112562.008103194086
34121.9083333-331.736125970836-174.713835048468418.530501648468575.552792570836
35121.9083333-344.887964236121-183.313359861992427.130026461992588.704630836121
36121.9083333-357.679272210956-191.677146589614435.493813189613601.495938810956
37121.9083333-370.138167882595-199.823580594978443.640247194978613.954834482595
38121.9083333-382.289293918074-207.768774851979451.585441451979626.105960518074
39121.9083333-394.154390851471-215.526944731770459.34361133177637.971057451471
40121.9083333-405.752754165183-223.110706872139466.927373472139649.569420765182
41121.9083333-417.1016027784-230.531320119178474.347986719178660.9182693784

\begin{tabular}{lllllllll}
\hline
Demand Forecast \tabularnewline
Point & Forecast & 95% LB & 80% LB & 80% UB & 95% UB \tabularnewline
18 & 121.9083333 & 11.8833908264786 & 49.966890299972 & 193.849776300028 & 231.933275773521 \tabularnewline
19 & 121.9083333 & -33.6904325453736 & 20.1677689126695 & 223.648897687331 & 277.507099145374 \tabularnewline
20 & 121.9083333 & -68.660457163982 & -2.69790114586881 & 246.514567745869 & 312.477123763982 \tabularnewline
21 & 121.9083333 & -98.1415516470428 & -21.974552700056 & 265.791219300056 & 341.958218247043 \tabularnewline
22 & 121.9083333 & -124.114917291298 & -38.957623647489 & 282.774290247489 & 367.931583891298 \tabularnewline
23 & 121.9083333 & -147.5966347392 & -54.3114934095892 & 298.128160009589 & 391.4133013392 \tabularnewline
24 & 121.9083333 & -169.190302499125 & -68.4308338372025 & 312.247500437203 & 413.006969099125 \tabularnewline
25 & 121.9083333 & -189.289198390747 & -81.572795474661 & 325.389462074661 & 433.105864990747 \tabularnewline
26 & 121.9083333 & -208.166494120564 & -93.915995700084 & 337.732662300084 & 451.983160720564 \tabularnewline
27 & 121.9083333 & -226.021084345328 & -105.590484739265 & 349.407151339265 & 469.837750945328 \tabularnewline
28 & 121.9083333 & -243.003118465108 & -116.694440007833 & 360.511106607833 & 486.819785065108 \tabularnewline
29 & 121.9083333 & -259.229247627964 & -127.304135591738 & 371.120802191738 & 503.045914227964 \tabularnewline
30 & 121.9083333 & -274.792238368257 & -137.480228267471 & 381.296894867471 & 518.608904968257 \tabularnewline
31 & 121.9083333 & -289.767305435429 & -147.271898316231 & 391.088564916231 & 533.583972035429 \tabularnewline
32 & 121.9083333 & -304.216436567377 & -156.719677341239 & 400.536343941238 & 548.033103167377 \tabularnewline
33 & 121.9083333 & -318.191436594086 & -165.857438700112 & 409.674105300112 & 562.008103194086 \tabularnewline
34 & 121.9083333 & -331.736125970836 & -174.713835048468 & 418.530501648468 & 575.552792570836 \tabularnewline
35 & 121.9083333 & -344.887964236121 & -183.313359861992 & 427.130026461992 & 588.704630836121 \tabularnewline
36 & 121.9083333 & -357.679272210956 & -191.677146589614 & 435.493813189613 & 601.495938810956 \tabularnewline
37 & 121.9083333 & -370.138167882595 & -199.823580594978 & 443.640247194978 & 613.954834482595 \tabularnewline
38 & 121.9083333 & -382.289293918074 & -207.768774851979 & 451.585441451979 & 626.105960518074 \tabularnewline
39 & 121.9083333 & -394.154390851471 & -215.526944731770 & 459.34361133177 & 637.971057451471 \tabularnewline
40 & 121.9083333 & -405.752754165183 & -223.110706872139 & 466.927373472139 & 649.569420765182 \tabularnewline
41 & 121.9083333 & -417.1016027784 & -230.531320119178 & 474.347986719178 & 660.9182693784 \tabularnewline
\hline
\end{tabular}
%Source: https://freestatistics.org/blog/index.php?pk=75947&T=1

[TABLE]
[ROW][C]Demand Forecast[/C][/ROW]
[ROW][C]Point[/C][C]Forecast[/C][C]95% LB[/C][C]80% LB[/C][C]80% UB[/C][C]95% UB[/C][/ROW]
[ROW][C]18[/C][C]121.9083333[/C][C]11.8833908264786[/C][C]49.966890299972[/C][C]193.849776300028[/C][C]231.933275773521[/C][/ROW]
[ROW][C]19[/C][C]121.9083333[/C][C]-33.6904325453736[/C][C]20.1677689126695[/C][C]223.648897687331[/C][C]277.507099145374[/C][/ROW]
[ROW][C]20[/C][C]121.9083333[/C][C]-68.660457163982[/C][C]-2.69790114586881[/C][C]246.514567745869[/C][C]312.477123763982[/C][/ROW]
[ROW][C]21[/C][C]121.9083333[/C][C]-98.1415516470428[/C][C]-21.974552700056[/C][C]265.791219300056[/C][C]341.958218247043[/C][/ROW]
[ROW][C]22[/C][C]121.9083333[/C][C]-124.114917291298[/C][C]-38.957623647489[/C][C]282.774290247489[/C][C]367.931583891298[/C][/ROW]
[ROW][C]23[/C][C]121.9083333[/C][C]-147.5966347392[/C][C]-54.3114934095892[/C][C]298.128160009589[/C][C]391.4133013392[/C][/ROW]
[ROW][C]24[/C][C]121.9083333[/C][C]-169.190302499125[/C][C]-68.4308338372025[/C][C]312.247500437203[/C][C]413.006969099125[/C][/ROW]
[ROW][C]25[/C][C]121.9083333[/C][C]-189.289198390747[/C][C]-81.572795474661[/C][C]325.389462074661[/C][C]433.105864990747[/C][/ROW]
[ROW][C]26[/C][C]121.9083333[/C][C]-208.166494120564[/C][C]-93.915995700084[/C][C]337.732662300084[/C][C]451.983160720564[/C][/ROW]
[ROW][C]27[/C][C]121.9083333[/C][C]-226.021084345328[/C][C]-105.590484739265[/C][C]349.407151339265[/C][C]469.837750945328[/C][/ROW]
[ROW][C]28[/C][C]121.9083333[/C][C]-243.003118465108[/C][C]-116.694440007833[/C][C]360.511106607833[/C][C]486.819785065108[/C][/ROW]
[ROW][C]29[/C][C]121.9083333[/C][C]-259.229247627964[/C][C]-127.304135591738[/C][C]371.120802191738[/C][C]503.045914227964[/C][/ROW]
[ROW][C]30[/C][C]121.9083333[/C][C]-274.792238368257[/C][C]-137.480228267471[/C][C]381.296894867471[/C][C]518.608904968257[/C][/ROW]
[ROW][C]31[/C][C]121.9083333[/C][C]-289.767305435429[/C][C]-147.271898316231[/C][C]391.088564916231[/C][C]533.583972035429[/C][/ROW]
[ROW][C]32[/C][C]121.9083333[/C][C]-304.216436567377[/C][C]-156.719677341239[/C][C]400.536343941238[/C][C]548.033103167377[/C][/ROW]
[ROW][C]33[/C][C]121.9083333[/C][C]-318.191436594086[/C][C]-165.857438700112[/C][C]409.674105300112[/C][C]562.008103194086[/C][/ROW]
[ROW][C]34[/C][C]121.9083333[/C][C]-331.736125970836[/C][C]-174.713835048468[/C][C]418.530501648468[/C][C]575.552792570836[/C][/ROW]
[ROW][C]35[/C][C]121.9083333[/C][C]-344.887964236121[/C][C]-183.313359861992[/C][C]427.130026461992[/C][C]588.704630836121[/C][/ROW]
[ROW][C]36[/C][C]121.9083333[/C][C]-357.679272210956[/C][C]-191.677146589614[/C][C]435.493813189613[/C][C]601.495938810956[/C][/ROW]
[ROW][C]37[/C][C]121.9083333[/C][C]-370.138167882595[/C][C]-199.823580594978[/C][C]443.640247194978[/C][C]613.954834482595[/C][/ROW]
[ROW][C]38[/C][C]121.9083333[/C][C]-382.289293918074[/C][C]-207.768774851979[/C][C]451.585441451979[/C][C]626.105960518074[/C][/ROW]
[ROW][C]39[/C][C]121.9083333[/C][C]-394.154390851471[/C][C]-215.526944731770[/C][C]459.34361133177[/C][C]637.971057451471[/C][/ROW]
[ROW][C]40[/C][C]121.9083333[/C][C]-405.752754165183[/C][C]-223.110706872139[/C][C]466.927373472139[/C][C]649.569420765182[/C][/ROW]
[ROW][C]41[/C][C]121.9083333[/C][C]-417.1016027784[/C][C]-230.531320119178[/C][C]474.347986719178[/C][C]660.9182693784[/C][/ROW]
[/TABLE]
Source: https://freestatistics.org/blog/index.php?pk=75947&T=1

Globally Unique Identifier (entire table): ba.freestatistics.org/blog/index.php?pk=75947&T=1

As an alternative you can also use a QR Code:  

The GUIDs for individual cells are displayed in the table below:

Demand Forecast
PointForecast95% LB80% LB80% UB95% UB
18121.908333311.883390826478649.966890299972193.849776300028231.933275773521
19121.9083333-33.690432545373620.1677689126695223.648897687331277.507099145374
20121.9083333-68.660457163982-2.69790114586881246.514567745869312.477123763982
21121.9083333-98.1415516470428-21.974552700056265.791219300056341.958218247043
22121.9083333-124.114917291298-38.957623647489282.774290247489367.931583891298
23121.9083333-147.5966347392-54.3114934095892298.128160009589391.4133013392
24121.9083333-169.190302499125-68.4308338372025312.247500437203413.006969099125
25121.9083333-189.289198390747-81.572795474661325.389462074661433.105864990747
26121.9083333-208.166494120564-93.915995700084337.732662300084451.983160720564
27121.9083333-226.021084345328-105.590484739265349.407151339265469.837750945328
28121.9083333-243.003118465108-116.694440007833360.511106607833486.819785065108
29121.9083333-259.229247627964-127.304135591738371.120802191738503.045914227964
30121.9083333-274.792238368257-137.480228267471381.296894867471518.608904968257
31121.9083333-289.767305435429-147.271898316231391.088564916231533.583972035429
32121.9083333-304.216436567377-156.719677341239400.536343941238548.033103167377
33121.9083333-318.191436594086-165.857438700112409.674105300112562.008103194086
34121.9083333-331.736125970836-174.713835048468418.530501648468575.552792570836
35121.9083333-344.887964236121-183.313359861992427.130026461992588.704630836121
36121.9083333-357.679272210956-191.677146589614435.493813189613601.495938810956
37121.9083333-370.138167882595-199.823580594978443.640247194978613.954834482595
38121.9083333-382.289293918074-207.768774851979451.585441451979626.105960518074
39121.9083333-394.154390851471-215.526944731770459.34361133177637.971057451471
40121.9083333-405.752754165183-223.110706872139466.927373472139649.569420765182
41121.9083333-417.1016027784-230.531320119178474.347986719178660.9182693784


Actuals and Interpolation
TimeActualForecast
1266.75266.483250133375
2275.9833333266.74999999996
3265.1016667275.9833333
4203.9416667265.1016667
5193.25203.9416667
6243.9416667193.25
7219.6583333243.9416667
8131.4436667219.6583333
9144.1833333131.4436667
10207.4166667144.1833333
11117.0666667207.4166667
1258.66666667117.0666667
13145.758333358.66666667
14206.7033333145.7583333
15149.7666667206.7033333
1687.06666667149.7666667
17121.908333387.06666667

\begin{tabular}{lllllllll}
\hline
Actuals and Interpolation \tabularnewline
Time & Actual & Forecast \tabularnewline
1 & 266.75 & 266.483250133375 \tabularnewline
2 & 275.9833333 & 266.74999999996 \tabularnewline
3 & 265.1016667 & 275.9833333 \tabularnewline
4 & 203.9416667 & 265.1016667 \tabularnewline
5 & 193.25 & 203.9416667 \tabularnewline
6 & 243.9416667 & 193.25 \tabularnewline
7 & 219.6583333 & 243.9416667 \tabularnewline
8 & 131.4436667 & 219.6583333 \tabularnewline
9 & 144.1833333 & 131.4436667 \tabularnewline
10 & 207.4166667 & 144.1833333 \tabularnewline
11 & 117.0666667 & 207.4166667 \tabularnewline
12 & 58.66666667 & 117.0666667 \tabularnewline
13 & 145.7583333 & 58.66666667 \tabularnewline
14 & 206.7033333 & 145.7583333 \tabularnewline
15 & 149.7666667 & 206.7033333 \tabularnewline
16 & 87.06666667 & 149.7666667 \tabularnewline
17 & 121.9083333 & 87.06666667 \tabularnewline
\hline
\end{tabular}
%Source: https://freestatistics.org/blog/index.php?pk=75947&T=2

[TABLE]
[ROW][C]Actuals and Interpolation[/C][/ROW]
[ROW][C]Time[/C][C]Actual[/C][C]Forecast[/C][/ROW]
[ROW][C]1[/C][C]266.75[/C][C]266.483250133375[/C][/ROW]
[ROW][C]2[/C][C]275.9833333[/C][C]266.74999999996[/C][/ROW]
[ROW][C]3[/C][C]265.1016667[/C][C]275.9833333[/C][/ROW]
[ROW][C]4[/C][C]203.9416667[/C][C]265.1016667[/C][/ROW]
[ROW][C]5[/C][C]193.25[/C][C]203.9416667[/C][/ROW]
[ROW][C]6[/C][C]243.9416667[/C][C]193.25[/C][/ROW]
[ROW][C]7[/C][C]219.6583333[/C][C]243.9416667[/C][/ROW]
[ROW][C]8[/C][C]131.4436667[/C][C]219.6583333[/C][/ROW]
[ROW][C]9[/C][C]144.1833333[/C][C]131.4436667[/C][/ROW]
[ROW][C]10[/C][C]207.4166667[/C][C]144.1833333[/C][/ROW]
[ROW][C]11[/C][C]117.0666667[/C][C]207.4166667[/C][/ROW]
[ROW][C]12[/C][C]58.66666667[/C][C]117.0666667[/C][/ROW]
[ROW][C]13[/C][C]145.7583333[/C][C]58.66666667[/C][/ROW]
[ROW][C]14[/C][C]206.7033333[/C][C]145.7583333[/C][/ROW]
[ROW][C]15[/C][C]149.7666667[/C][C]206.7033333[/C][/ROW]
[ROW][C]16[/C][C]87.06666667[/C][C]149.7666667[/C][/ROW]
[ROW][C]17[/C][C]121.9083333[/C][C]87.06666667[/C][/ROW]
[/TABLE]
Source: https://freestatistics.org/blog/index.php?pk=75947&T=2

Globally Unique Identifier (entire table): ba.freestatistics.org/blog/index.php?pk=75947&T=2

As an alternative you can also use a QR Code:  

The GUIDs for individual cells are displayed in the table below:

Actuals and Interpolation
TimeActualForecast
1266.75266.483250133375
2275.9833333266.74999999996
3265.1016667275.9833333
4203.9416667265.1016667
5193.25203.9416667
6243.9416667193.25
7219.6583333243.9416667
8131.4436667219.6583333
9144.1833333131.4436667
10207.4166667144.1833333
11117.0666667207.4166667
1258.66666667117.0666667
13145.758333358.66666667
14206.7033333145.7583333
15149.7666667206.7033333
1687.06666667149.7666667
17121.908333387.06666667


\begin{tabular}{lllllllll}
\hline
What is next? \tabularnewline
Simulate Time Series \tabularnewline
Generate Forecasts \tabularnewline
Forecast Analysis \tabularnewline
\hline
\end{tabular}
%Source: https://freestatistics.org/blog/index.php?pk=75947&T=3

[TABLE]
[ROW][C]What is next?[/C][/ROW]
[ROW][C]Simulate Time Series[/C][/ROW]
[ROW][C]Generate Forecasts[/C][/ROW]
[ROW][C]Forecast Analysis[/C][/ROW]
[/TABLE]
Source: https://freestatistics.org/blog/index.php?pk=75947&T=3

Globally Unique Identifier (entire table): ba.freestatistics.org/blog/index.php?pk=75947&T=3

As an alternative you can also use a QR Code:  

The GUIDs for individual cells are displayed in the table below:

What is next?
Simulate Time Series
Generate Forecasts
Forecast Analysis


Parameters (Session):
par1 = Input box ; par2 = ARIMA ; par3 = NA ; par4 = NA ; par5 = ZZZ ; par6 = 12 ; par7 = dum ; par8 = dumresult ; par9 = 3 ; par10 = 0.1 ;
Parameters (R input):
par1 = Input box ; par2 = ARIMA ; par3 = NA ; par4 = NA ; par5 = ZZZ ; par6 = 12 ; par7 = dum ; par8 = dumresult ; par9 = 3 ; par10 = 0.1 ;
R code (references can be found in the software module):
if(par3!='NA') par3 <- as.numeric(par3) else par3 <- NA
if(par4!='NA') par4 <- as.numeric(par4) else par4 <- NA
par6 <- as.numeric(par6) #Seasonal Period
par9 <- as.numeric(par9) #Forecast Horizon
par10 <- as.numeric(par10) #Alpha
library(forecast)
if (par1 == 'CSV') {
xarr <- read.csv(file=paste('tmp/',par7,'.csv',sep=''),header=T)
numseries <- length(xarr[1,])-1
n <- length(xarr[,1])
nmh <- n - par9
nmhp1 <- nmh + 1
rarr <- array(NA,dim=c(n,numseries))
farr <- array(NA,dim=c(n,numseries))
parr <- array(NA,dim=c(numseries,8))
colnames(parr) = list('ME','RMSE','MAE','MPE','MAPE','MASE','ACF1','TheilU')
for(i in 1:numseries) {
sindex <- i+1
x <- xarr[,sindex]
if(par2=='Croston') {
if (i==1) m <- croston(x,alpha=par10)
if (i==1) mydemand <- m$model$demand[]
fit <- croston(x[1:nmh],h=par9,alpha=par10)
}
if(par2=='ARIMA') {
m <- auto.arima(ts(x,freq=par6),d=par3,D=par4)
mydemand <- forecast(m)
fit <- auto.arima(ts(x[1:nmh],freq=par6),d=par3,D=par4)
}
if(par2=='ETS') {
m <- ets(ts(x,freq=par6),model=par5)
mydemand <- forecast(m)
fit <- ets(ts(x[1:nmh],freq=par6),model=par5)
}
try(rarr[,i] <- mydemand$resid,silent=T)
try(farr[,i] <- mydemand$mean,silent=T)
if (par2!='Croston') parr[i,] <- accuracy(forecast(fit,par9),x[nmhp1:n])
if (par2=='Croston') parr[i,] <- accuracy(fit,x[nmhp1:n])
}
write.csv(farr,file=paste('tmp/',par8,'_f.csv',sep=''))
write.csv(rarr,file=paste('tmp/',par8,'_r.csv',sep=''))
write.csv(parr,file=paste('tmp/',par8,'_p.csv',sep=''))
}
if (par1 == 'Input box') {
numseries <- 1
n <- length(x)
if(par2=='Croston') {
m <- croston(x)
mydemand <- m$model$demand[]
}
if(par2=='ARIMA') {
m <- auto.arima(ts(x,freq=par6),d=par3,D=par4)
mydemand <- forecast(m)
}
if(par2=='ETS') {
m <- ets(ts(x,freq=par6),model=par5)
mydemand <- forecast(m)
}
summary(m)
}
bitmap(file='test1.png')
op <- par(mfrow=c(2,1))
if (par2=='Croston') plot(m)
if ((par2=='ARIMA') | par2=='ETS') plot(forecast(m))
plot(mydemand$resid,type='l',main='Residuals', ylab='residual value', xlab='time')
par(op)
dev.off()
bitmap(file='pic2.png')
op <- par(mfrow=c(2,2))
acf(mydemand$resid, lag.max=n/3, main='Residual ACF', ylab='autocorrelation', xlab='time lag')
pacf(mydemand$resid,lag.max=n/3, main='Residual PACF', ylab='partial autocorrelation', xlab='time lag')
cpgram(mydemand$resid, main='Cumulative Periodogram of Residuals')
qqnorm(mydemand$resid); qqline(mydemand$resid, col=2)
par(op)
dev.off()
load(file='createtable')
a<-table.start()
a<-table.row.start(a)
a<-table.element(a,'Demand Forecast',6,TRUE)
a<-table.row.end(a)
a<-table.row.start(a)
a<-table.element(a,'Point',header=TRUE)
a<-table.element(a,'Forecast',header=TRUE)
a<-table.element(a,'95% LB',header=TRUE)
a<-table.element(a,'80% LB',header=TRUE)
a<-table.element(a,'80% UB',header=TRUE)
a<-table.element(a,'95% UB',header=TRUE)
a<-table.row.end(a)
for (i in 1:length(mydemand$mean)) {
a<-table.row.start(a)
a<-table.element(a,i+n,header=TRUE)
a<-table.element(a,as.numeric(mydemand$mean[i]))
a<-table.element(a,as.numeric(mydemand$lower[i,2]))
a<-table.element(a,as.numeric(mydemand$lower[i,1]))
a<-table.element(a,as.numeric(mydemand$upper[i,1]))
a<-table.element(a,as.numeric(mydemand$upper[i,2]))
a<-table.row.end(a)
}
a<-table.end(a)
table.save(a,file='mytable.tab')
a<-table.start()
a<-table.row.start(a)
a<-table.element(a,'Actuals and Interpolation',3,TRUE)
a<-table.row.end(a)
a<-table.row.start(a)
a<-table.element(a,'Time',header=TRUE)
a<-table.element(a,'Actual',header=TRUE)
a<-table.element(a,'Forecast',header=TRUE)
a<-table.row.end(a)
for (i in 1:n) {
a<-table.row.start(a)
a<-table.element(a,i,header=TRUE)
a<-table.element(a,x[i])
a<-table.element(a,x[i] - as.numeric(m$resid[i]))
a<-table.row.end(a)
}
a<-table.end(a)
table.save(a,file='mytable1.tab')
a<-table.start()
a<-table.row.start(a)
a<-table.element(a,'What is next?',1,TRUE)
a<-table.row.end(a)
a<-table.row.start(a)
a<-table.element(a,hyperlink(paste('https://automated.biganalytics.eu/Patrick.Wessa/rwasp_demand_forecasting_simulate.wasp',sep=''),'Simulate Time Series','',target=''))
a<-table.row.end(a)
a<-table.row.start(a)
a<-table.element(a,hyperlink(paste('https://automated.biganalytics.eu/Patrick.Wessa/rwasp_demand_forecasting_croston.wasp',sep=''),'Generate Forecasts','',target=''))
a<-table.row.end(a)
a<-table.row.start(a)
a<-table.element(a,hyperlink(paste('https://automated.biganalytics.eu/Patrick.Wessa/rwasp_demand_forecasting_analysis.wasp',sep=''),'Forecast Analysis','',target=''))
a<-table.row.end(a)
a<-table.end(a)
table.save(a,file='mytable0.tab')
-SERVER-wessa.org