Free Statistics

of Irreproducible Research!

Author's title

Author*Unverified author*
R Software ModulePatrick.Wessarwasp_demand_forecasting_croston.wasp
Title produced by softwareCroston Forecasting
Date of computationThu, 13 May 2010 14:17:58 +0000
Cite this page as followsStatistical Computations at FreeStatistics.org, Office for Research Development and Education, URL https://freestatistics.org/blog/index.php?v=date/2010/May/13/t12737603081qo0y914a3m4muc.htm/, Retrieved Sun, 05 May 2024 22:51:31 +0000
Statistical Computations at FreeStatistics.org, Office for Research Development and Education, URL https://freestatistics.org/blog/index.php?pk=75961, Retrieved Sun, 05 May 2024 22:51:31 +0000
QR Codes:

Original text written by user:
IsPrivate?No (this computation is public)
User-defined keywordsB611,steven,coomans,thesis,ETS,per3maand
Estimated Impact124
Family? (F = Feedback message, R = changed R code, M = changed R Module, P = changed Parameters, D = changed Data)
-       [Croston Forecasting] [B611,steven,cooma...] [2010-05-13 14:17:58] [d41d8cd98f00b204e9800998ecf8427e] [Current]
Feedback Forum

Post a new message
Dataseries X:
42.13333333
43.68333333
9.016666667
33.7
19.09866667
10.06733333
18.81666667
40.85
51.575
16.625
42.6
25.66666667
49.325
39.40833333
37.55333333
57.05
29.575


Summary of computational transaction
Raw Inputview raw input (R code)
Raw Outputview raw output of R engine
Computing time4 seconds
R Serverwessa.org @ wessa.org

\begin{tabular}{lllllllll}
\hline
Summary of computational transaction \tabularnewline
Raw Input & view raw input (R code)  \tabularnewline
Raw Output & view raw output of R engine  \tabularnewline
Computing time & 4 seconds \tabularnewline
R Server & wessa.org @ wessa.org \tabularnewline
\hline
\end{tabular}
%Source: https://freestatistics.org/blog/index.php?pk=75961&T=0

[TABLE]
[ROW][C]Summary of computational transaction[/C][/ROW]
[ROW][C]Raw Input[/C][C]view raw input (R code) [/C][/ROW]
[ROW][C]Raw Output[/C][C]view raw output of R engine [/C][/ROW]
[ROW][C]Computing time[/C][C]4 seconds[/C][/ROW]
[ROW][C]R Server[/C][C]wessa.org @ wessa.org[/C][/ROW]
[/TABLE]
Source: https://freestatistics.org/blog/index.php?pk=75961&T=0

Globally Unique Identifier (entire table): ba.freestatistics.org/blog/index.php?pk=75961&T=0

As an alternative you can also use a QR Code:  

The GUIDs for individual cells are displayed in the table below:

Summary of computational transaction
Raw Inputview raw input (R code)
Raw Outputview raw output of R engine
Computing time4 seconds
R Serverwessa.org @ wessa.org


Demand Forecast
PointForecast95% LB80% LB80% UB95% UB
1814.52390576247418.845113275252410.810742939173718.237068585774520.2026982496958
1926.483637810401815.121295625102819.054201590817233.913074029986537.8459799957009
2056.275044192077230.150853818541239.193354254980373.35673412917482.3992345656131
2166.946367991056333.662291661122545.183080264959388.7096557171532100.23044432099
2220.50473641992259.671898069377913.421524148198127.587948691646931.3375747704670
2352.388231108271223.159210323247633.276401685970371.500060530572181.6172518932948
2429.627906742174312.257893724659918.270265708097040.985547776251546.9979197596887
2552.921005237657820.453377627840031.691564635132974.150445840182785.3886328474756
2646.332587651588816.68942653523226.949966421804965.715208881372775.9757487679456
2734.423895748140911.524224653186619.450605639913749.397185856368157.3235668430952
2856.364944246411117.478103633464330.938205867695381.791682625126995.2517848593578
2929.02639427068068.303659268055215.476526163684442.576262377676849.749129273306
3014.52393280592243.814707325841077.5215466457557521.526318966089125.2331582860037
3126.48368712281836.3503713090604613.319219507980939.648154737655746.6170029365762
3256.275148975960512.235109572275427.47891501981385.0713829321081100.315188379646
3366.946492644897413.088157904140531.7304204368972102.162564852898120.804827385654
3420.5047745996513.567924632944329.4303636607578531.579185538544137.4416245663577
3552.38832865492588.0097186401302723.370715275412181.405942034439596.7669386697213
3629.62796190920563.9148205580268412.815042481298046.440881337113255.3411032603844
3752.92110377633545.9114224053691422.183125307382883.65908224528899.9307851473018
3846.33267392266214.2430389331618918.811740864979973.853606980344288.4223089121623
3934.42395984528252.4694713207909713.530042856114455.317876834450666.378448369774
4056.3650491976882.9400837987199521.432341971294391.2977564240816109.790014596656
4129.02644831769830.95305053828558410.670240163799247.382656471597557.0998460971111

\begin{tabular}{lllllllll}
\hline
Demand Forecast \tabularnewline
Point & Forecast & 95% LB & 80% LB & 80% UB & 95% UB \tabularnewline
18 & 14.5239057624741 & 8.8451132752524 & 10.8107429391737 & 18.2370685857745 & 20.2026982496958 \tabularnewline
19 & 26.4836378104018 & 15.1212956251028 & 19.0542015908172 & 33.9130740299865 & 37.8459799957009 \tabularnewline
20 & 56.2750441920772 & 30.1508538185412 & 39.1933542549803 & 73.356734129174 & 82.3992345656131 \tabularnewline
21 & 66.9463679910563 & 33.6622916611225 & 45.1830802649593 & 88.7096557171532 & 100.23044432099 \tabularnewline
22 & 20.5047364199225 & 9.6718980693779 & 13.4215241481981 & 27.5879486916469 & 31.3375747704670 \tabularnewline
23 & 52.3882311082712 & 23.1592103232476 & 33.2764016859703 & 71.5000605305721 & 81.6172518932948 \tabularnewline
24 & 29.6279067421743 & 12.2578937246599 & 18.2702657080970 & 40.9855477762515 & 46.9979197596887 \tabularnewline
25 & 52.9210052376578 & 20.4533776278400 & 31.6915646351329 & 74.1504458401827 & 85.3886328474756 \tabularnewline
26 & 46.3325876515888 & 16.689426535232 & 26.9499664218049 & 65.7152088813727 & 75.9757487679456 \tabularnewline
27 & 34.4238957481409 & 11.5242246531866 & 19.4506056399137 & 49.3971858563681 & 57.3235668430952 \tabularnewline
28 & 56.3649442464111 & 17.4781036334643 & 30.9382058676953 & 81.7916826251269 & 95.2517848593578 \tabularnewline
29 & 29.0263942706806 & 8.3036592680552 & 15.4765261636844 & 42.5762623776768 & 49.749129273306 \tabularnewline
30 & 14.5239328059224 & 3.81470732584107 & 7.52154664575575 & 21.5263189660891 & 25.2331582860037 \tabularnewline
31 & 26.4836871228183 & 6.35037130906046 & 13.3192195079809 & 39.6481547376557 & 46.6170029365762 \tabularnewline
32 & 56.2751489759605 & 12.2351095722754 & 27.478915019813 & 85.0713829321081 & 100.315188379646 \tabularnewline
33 & 66.9464926448974 & 13.0881579041405 & 31.7304204368972 & 102.162564852898 & 120.804827385654 \tabularnewline
34 & 20.504774599651 & 3.56792463294432 & 9.43036366075785 & 31.5791855385441 & 37.4416245663577 \tabularnewline
35 & 52.3883286549258 & 8.00971864013027 & 23.3707152754121 & 81.4059420344395 & 96.7669386697213 \tabularnewline
36 & 29.6279619092056 & 3.91482055802684 & 12.8150424812980 & 46.4408813371132 & 55.3411032603844 \tabularnewline
37 & 52.9211037763354 & 5.91142240536914 & 22.1831253073828 & 83.659082245288 & 99.9307851473018 \tabularnewline
38 & 46.3326739226621 & 4.24303893316189 & 18.8117408649799 & 73.8536069803442 & 88.4223089121623 \tabularnewline
39 & 34.4239598452825 & 2.46947132079097 & 13.5300428561144 & 55.3178768344506 & 66.378448369774 \tabularnewline
40 & 56.365049197688 & 2.94008379871995 & 21.4323419712943 & 91.2977564240816 & 109.790014596656 \tabularnewline
41 & 29.0264483176983 & 0.953050538285584 & 10.6702401637992 & 47.3826564715975 & 57.0998460971111 \tabularnewline
\hline
\end{tabular}
%Source: https://freestatistics.org/blog/index.php?pk=75961&T=1

[TABLE]
[ROW][C]Demand Forecast[/C][/ROW]
[ROW][C]Point[/C][C]Forecast[/C][C]95% LB[/C][C]80% LB[/C][C]80% UB[/C][C]95% UB[/C][/ROW]
[ROW][C]18[/C][C]14.5239057624741[/C][C]8.8451132752524[/C][C]10.8107429391737[/C][C]18.2370685857745[/C][C]20.2026982496958[/C][/ROW]
[ROW][C]19[/C][C]26.4836378104018[/C][C]15.1212956251028[/C][C]19.0542015908172[/C][C]33.9130740299865[/C][C]37.8459799957009[/C][/ROW]
[ROW][C]20[/C][C]56.2750441920772[/C][C]30.1508538185412[/C][C]39.1933542549803[/C][C]73.356734129174[/C][C]82.3992345656131[/C][/ROW]
[ROW][C]21[/C][C]66.9463679910563[/C][C]33.6622916611225[/C][C]45.1830802649593[/C][C]88.7096557171532[/C][C]100.23044432099[/C][/ROW]
[ROW][C]22[/C][C]20.5047364199225[/C][C]9.6718980693779[/C][C]13.4215241481981[/C][C]27.5879486916469[/C][C]31.3375747704670[/C][/ROW]
[ROW][C]23[/C][C]52.3882311082712[/C][C]23.1592103232476[/C][C]33.2764016859703[/C][C]71.5000605305721[/C][C]81.6172518932948[/C][/ROW]
[ROW][C]24[/C][C]29.6279067421743[/C][C]12.2578937246599[/C][C]18.2702657080970[/C][C]40.9855477762515[/C][C]46.9979197596887[/C][/ROW]
[ROW][C]25[/C][C]52.9210052376578[/C][C]20.4533776278400[/C][C]31.6915646351329[/C][C]74.1504458401827[/C][C]85.3886328474756[/C][/ROW]
[ROW][C]26[/C][C]46.3325876515888[/C][C]16.689426535232[/C][C]26.9499664218049[/C][C]65.7152088813727[/C][C]75.9757487679456[/C][/ROW]
[ROW][C]27[/C][C]34.4238957481409[/C][C]11.5242246531866[/C][C]19.4506056399137[/C][C]49.3971858563681[/C][C]57.3235668430952[/C][/ROW]
[ROW][C]28[/C][C]56.3649442464111[/C][C]17.4781036334643[/C][C]30.9382058676953[/C][C]81.7916826251269[/C][C]95.2517848593578[/C][/ROW]
[ROW][C]29[/C][C]29.0263942706806[/C][C]8.3036592680552[/C][C]15.4765261636844[/C][C]42.5762623776768[/C][C]49.749129273306[/C][/ROW]
[ROW][C]30[/C][C]14.5239328059224[/C][C]3.81470732584107[/C][C]7.52154664575575[/C][C]21.5263189660891[/C][C]25.2331582860037[/C][/ROW]
[ROW][C]31[/C][C]26.4836871228183[/C][C]6.35037130906046[/C][C]13.3192195079809[/C][C]39.6481547376557[/C][C]46.6170029365762[/C][/ROW]
[ROW][C]32[/C][C]56.2751489759605[/C][C]12.2351095722754[/C][C]27.478915019813[/C][C]85.0713829321081[/C][C]100.315188379646[/C][/ROW]
[ROW][C]33[/C][C]66.9464926448974[/C][C]13.0881579041405[/C][C]31.7304204368972[/C][C]102.162564852898[/C][C]120.804827385654[/C][/ROW]
[ROW][C]34[/C][C]20.504774599651[/C][C]3.56792463294432[/C][C]9.43036366075785[/C][C]31.5791855385441[/C][C]37.4416245663577[/C][/ROW]
[ROW][C]35[/C][C]52.3883286549258[/C][C]8.00971864013027[/C][C]23.3707152754121[/C][C]81.4059420344395[/C][C]96.7669386697213[/C][/ROW]
[ROW][C]36[/C][C]29.6279619092056[/C][C]3.91482055802684[/C][C]12.8150424812980[/C][C]46.4408813371132[/C][C]55.3411032603844[/C][/ROW]
[ROW][C]37[/C][C]52.9211037763354[/C][C]5.91142240536914[/C][C]22.1831253073828[/C][C]83.659082245288[/C][C]99.9307851473018[/C][/ROW]
[ROW][C]38[/C][C]46.3326739226621[/C][C]4.24303893316189[/C][C]18.8117408649799[/C][C]73.8536069803442[/C][C]88.4223089121623[/C][/ROW]
[ROW][C]39[/C][C]34.4239598452825[/C][C]2.46947132079097[/C][C]13.5300428561144[/C][C]55.3178768344506[/C][C]66.378448369774[/C][/ROW]
[ROW][C]40[/C][C]56.365049197688[/C][C]2.94008379871995[/C][C]21.4323419712943[/C][C]91.2977564240816[/C][C]109.790014596656[/C][/ROW]
[ROW][C]41[/C][C]29.0264483176983[/C][C]0.953050538285584[/C][C]10.6702401637992[/C][C]47.3826564715975[/C][C]57.0998460971111[/C][/ROW]
[/TABLE]
Source: https://freestatistics.org/blog/index.php?pk=75961&T=1

Globally Unique Identifier (entire table): ba.freestatistics.org/blog/index.php?pk=75961&T=1

As an alternative you can also use a QR Code:  

The GUIDs for individual cells are displayed in the table below:

Demand Forecast
PointForecast95% LB80% LB80% UB95% UB
1814.52390576247418.845113275252410.810742939173718.237068585774520.2026982496958
1926.483637810401815.121295625102819.054201590817233.913074029986537.8459799957009
2056.275044192077230.150853818541239.193354254980373.35673412917482.3992345656131
2166.946367991056333.662291661122545.183080264959388.7096557171532100.23044432099
2220.50473641992259.671898069377913.421524148198127.587948691646931.3375747704670
2352.388231108271223.159210323247633.276401685970371.500060530572181.6172518932948
2429.627906742174312.257893724659918.270265708097040.985547776251546.9979197596887
2552.921005237657820.453377627840031.691564635132974.150445840182785.3886328474756
2646.332587651588816.68942653523226.949966421804965.715208881372775.9757487679456
2734.423895748140911.524224653186619.450605639913749.397185856368157.3235668430952
2856.364944246411117.478103633464330.938205867695381.791682625126995.2517848593578
2929.02639427068068.303659268055215.476526163684442.576262377676849.749129273306
3014.52393280592243.814707325841077.5215466457557521.526318966089125.2331582860037
3126.48368712281836.3503713090604613.319219507980939.648154737655746.6170029365762
3256.275148975960512.235109572275427.47891501981385.0713829321081100.315188379646
3366.946492644897413.088157904140531.7304204368972102.162564852898120.804827385654
3420.5047745996513.567924632944329.4303636607578531.579185538544137.4416245663577
3552.38832865492588.0097186401302723.370715275412181.405942034439596.7669386697213
3629.62796190920563.9148205580268412.815042481298046.440881337113255.3411032603844
3752.92110377633545.9114224053691422.183125307382883.65908224528899.9307851473018
3846.33267392266214.2430389331618918.811740864979973.853606980344288.4223089121623
3934.42395984528252.4694713207909713.530042856114455.317876834450666.378448369774
4056.3650491976882.9400837987199521.432341971294391.2977564240816109.790014596656
4129.02644831769830.95305053828558410.670240163799247.382656471597557.0998460971111


Actuals and Interpolation
TimeActualForecast
142.1333333342.1754999382236
243.6833333343.5274555841281
39.0166666679.71630430766763
433.733.7064299229627
519.0986666719.0021118404607
610.067333339.95953230744406
718.8166666718.7328988002079
840.8540.7823631786921
951.57551.4748790463977
1016.62516.5163611830858
1142.642.5391741934841
1225.6666666725.5661618094048
1349.32549.1914327687304
1439.4083333339.4316835376926
1537.5533333337.287564195407
1657.0556.9993272182539
1729.57529.5405454920193

\begin{tabular}{lllllllll}
\hline
Actuals and Interpolation \tabularnewline
Time & Actual & Forecast \tabularnewline
1 & 42.13333333 & 42.1754999382236 \tabularnewline
2 & 43.68333333 & 43.5274555841281 \tabularnewline
3 & 9.016666667 & 9.71630430766763 \tabularnewline
4 & 33.7 & 33.7064299229627 \tabularnewline
5 & 19.09866667 & 19.0021118404607 \tabularnewline
6 & 10.06733333 & 9.95953230744406 \tabularnewline
7 & 18.81666667 & 18.7328988002079 \tabularnewline
8 & 40.85 & 40.7823631786921 \tabularnewline
9 & 51.575 & 51.4748790463977 \tabularnewline
10 & 16.625 & 16.5163611830858 \tabularnewline
11 & 42.6 & 42.5391741934841 \tabularnewline
12 & 25.66666667 & 25.5661618094048 \tabularnewline
13 & 49.325 & 49.1914327687304 \tabularnewline
14 & 39.40833333 & 39.4316835376926 \tabularnewline
15 & 37.55333333 & 37.287564195407 \tabularnewline
16 & 57.05 & 56.9993272182539 \tabularnewline
17 & 29.575 & 29.5405454920193 \tabularnewline
\hline
\end{tabular}
%Source: https://freestatistics.org/blog/index.php?pk=75961&T=2

[TABLE]
[ROW][C]Actuals and Interpolation[/C][/ROW]
[ROW][C]Time[/C][C]Actual[/C][C]Forecast[/C][/ROW]
[ROW][C]1[/C][C]42.13333333[/C][C]42.1754999382236[/C][/ROW]
[ROW][C]2[/C][C]43.68333333[/C][C]43.5274555841281[/C][/ROW]
[ROW][C]3[/C][C]9.016666667[/C][C]9.71630430766763[/C][/ROW]
[ROW][C]4[/C][C]33.7[/C][C]33.7064299229627[/C][/ROW]
[ROW][C]5[/C][C]19.09866667[/C][C]19.0021118404607[/C][/ROW]
[ROW][C]6[/C][C]10.06733333[/C][C]9.95953230744406[/C][/ROW]
[ROW][C]7[/C][C]18.81666667[/C][C]18.7328988002079[/C][/ROW]
[ROW][C]8[/C][C]40.85[/C][C]40.7823631786921[/C][/ROW]
[ROW][C]9[/C][C]51.575[/C][C]51.4748790463977[/C][/ROW]
[ROW][C]10[/C][C]16.625[/C][C]16.5163611830858[/C][/ROW]
[ROW][C]11[/C][C]42.6[/C][C]42.5391741934841[/C][/ROW]
[ROW][C]12[/C][C]25.66666667[/C][C]25.5661618094048[/C][/ROW]
[ROW][C]13[/C][C]49.325[/C][C]49.1914327687304[/C][/ROW]
[ROW][C]14[/C][C]39.40833333[/C][C]39.4316835376926[/C][/ROW]
[ROW][C]15[/C][C]37.55333333[/C][C]37.287564195407[/C][/ROW]
[ROW][C]16[/C][C]57.05[/C][C]56.9993272182539[/C][/ROW]
[ROW][C]17[/C][C]29.575[/C][C]29.5405454920193[/C][/ROW]
[/TABLE]
Source: https://freestatistics.org/blog/index.php?pk=75961&T=2

Globally Unique Identifier (entire table): ba.freestatistics.org/blog/index.php?pk=75961&T=2

As an alternative you can also use a QR Code:  

The GUIDs for individual cells are displayed in the table below:

Actuals and Interpolation
TimeActualForecast
142.1333333342.1754999382236
243.6833333343.5274555841281
39.0166666679.71630430766763
433.733.7064299229627
519.0986666719.0021118404607
610.067333339.95953230744406
718.8166666718.7328988002079
840.8540.7823631786921
951.57551.4748790463977
1016.62516.5163611830858
1142.642.5391741934841
1225.6666666725.5661618094048
1349.32549.1914327687304
1439.4083333339.4316835376926
1537.5533333337.287564195407
1657.0556.9993272182539
1729.57529.5405454920193


\begin{tabular}{lllllllll}
\hline
What is next? \tabularnewline
Simulate Time Series \tabularnewline
Generate Forecasts \tabularnewline
Forecast Analysis \tabularnewline
\hline
\end{tabular}
%Source: https://freestatistics.org/blog/index.php?pk=75961&T=3

[TABLE]
[ROW][C]What is next?[/C][/ROW]
[ROW][C]Simulate Time Series[/C][/ROW]
[ROW][C]Generate Forecasts[/C][/ROW]
[ROW][C]Forecast Analysis[/C][/ROW]
[/TABLE]
Source: https://freestatistics.org/blog/index.php?pk=75961&T=3

Globally Unique Identifier (entire table): ba.freestatistics.org/blog/index.php?pk=75961&T=3

As an alternative you can also use a QR Code:  

The GUIDs for individual cells are displayed in the table below:

What is next?
Simulate Time Series
Generate Forecasts
Forecast Analysis


Parameters (Session):
par1 = Input box ; par2 = ARIMA ; par3 = NA ; par4 = NA ; par5 = ZZZ ; par6 = 12 ; par7 = dum ; par8 = dumresult ; par9 = 3 ; par10 = 0.1 ;
Parameters (R input):
par1 = Input box ; par2 = ETS ; par3 = NA ; par4 = NA ; par5 = ZZZ ; par6 = 12 ; par7 = dum ; par8 = dumresult ; par9 = 3 ; par10 = 0.1 ;
R code (references can be found in the software module):
if(par3!='NA') par3 <- as.numeric(par3) else par3 <- NA
if(par4!='NA') par4 <- as.numeric(par4) else par4 <- NA
par6 <- as.numeric(par6) #Seasonal Period
par9 <- as.numeric(par9) #Forecast Horizon
par10 <- as.numeric(par10) #Alpha
library(forecast)
if (par1 == 'CSV') {
xarr <- read.csv(file=paste('tmp/',par7,'.csv',sep=''),header=T)
numseries <- length(xarr[1,])-1
n <- length(xarr[,1])
nmh <- n - par9
nmhp1 <- nmh + 1
rarr <- array(NA,dim=c(n,numseries))
farr <- array(NA,dim=c(n,numseries))
parr <- array(NA,dim=c(numseries,8))
colnames(parr) = list('ME','RMSE','MAE','MPE','MAPE','MASE','ACF1','TheilU')
for(i in 1:numseries) {
sindex <- i+1
x <- xarr[,sindex]
if(par2=='Croston') {
if (i==1) m <- croston(x,alpha=par10)
if (i==1) mydemand <- m$model$demand[]
fit <- croston(x[1:nmh],h=par9,alpha=par10)
}
if(par2=='ARIMA') {
m <- auto.arima(ts(x,freq=par6),d=par3,D=par4)
mydemand <- forecast(m)
fit <- auto.arima(ts(x[1:nmh],freq=par6),d=par3,D=par4)
}
if(par2=='ETS') {
m <- ets(ts(x,freq=par6),model=par5)
mydemand <- forecast(m)
fit <- ets(ts(x[1:nmh],freq=par6),model=par5)
}
try(rarr[,i] <- mydemand$resid,silent=T)
try(farr[,i] <- mydemand$mean,silent=T)
if (par2!='Croston') parr[i,] <- accuracy(forecast(fit,par9),x[nmhp1:n])
if (par2=='Croston') parr[i,] <- accuracy(fit,x[nmhp1:n])
}
write.csv(farr,file=paste('tmp/',par8,'_f.csv',sep=''))
write.csv(rarr,file=paste('tmp/',par8,'_r.csv',sep=''))
write.csv(parr,file=paste('tmp/',par8,'_p.csv',sep=''))
}
if (par1 == 'Input box') {
numseries <- 1
n <- length(x)
if(par2=='Croston') {
m <- croston(x)
mydemand <- m$model$demand[]
}
if(par2=='ARIMA') {
m <- auto.arima(ts(x,freq=par6),d=par3,D=par4)
mydemand <- forecast(m)
}
if(par2=='ETS') {
m <- ets(ts(x,freq=par6),model=par5)
mydemand <- forecast(m)
}
summary(m)
}
bitmap(file='test1.png')
op <- par(mfrow=c(2,1))
if (par2=='Croston') plot(m)
if ((par2=='ARIMA') | par2=='ETS') plot(forecast(m))
plot(mydemand$resid,type='l',main='Residuals', ylab='residual value', xlab='time')
par(op)
dev.off()
bitmap(file='pic2.png')
op <- par(mfrow=c(2,2))
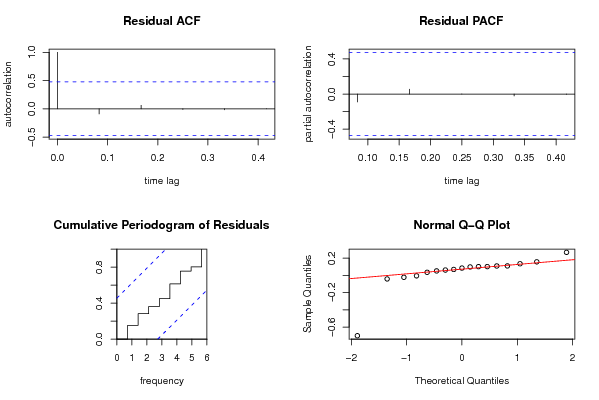
acf(mydemand$resid, lag.max=n/3, main='Residual ACF', ylab='autocorrelation', xlab='time lag')
pacf(mydemand$resid,lag.max=n/3, main='Residual PACF', ylab='partial autocorrelation', xlab='time lag')
cpgram(mydemand$resid, main='Cumulative Periodogram of Residuals')
qqnorm(mydemand$resid); qqline(mydemand$resid, col=2)
par(op)
dev.off()
load(file='createtable')
a<-table.start()
a<-table.row.start(a)
a<-table.element(a,'Demand Forecast',6,TRUE)
a<-table.row.end(a)
a<-table.row.start(a)
a<-table.element(a,'Point',header=TRUE)
a<-table.element(a,'Forecast',header=TRUE)
a<-table.element(a,'95% LB',header=TRUE)
a<-table.element(a,'80% LB',header=TRUE)
a<-table.element(a,'80% UB',header=TRUE)
a<-table.element(a,'95% UB',header=TRUE)
a<-table.row.end(a)
for (i in 1:length(mydemand$mean)) {
a<-table.row.start(a)
a<-table.element(a,i+n,header=TRUE)
a<-table.element(a,as.numeric(mydemand$mean[i]))
a<-table.element(a,as.numeric(mydemand$lower[i,2]))
a<-table.element(a,as.numeric(mydemand$lower[i,1]))
a<-table.element(a,as.numeric(mydemand$upper[i,1]))
a<-table.element(a,as.numeric(mydemand$upper[i,2]))
a<-table.row.end(a)
}
a<-table.end(a)
table.save(a,file='mytable.tab')
a<-table.start()
a<-table.row.start(a)
a<-table.element(a,'Actuals and Interpolation',3,TRUE)
a<-table.row.end(a)
a<-table.row.start(a)
a<-table.element(a,'Time',header=TRUE)
a<-table.element(a,'Actual',header=TRUE)
a<-table.element(a,'Forecast',header=TRUE)
a<-table.row.end(a)
for (i in 1:n) {
a<-table.row.start(a)
a<-table.element(a,i,header=TRUE)
a<-table.element(a,x[i])
a<-table.element(a,x[i] - as.numeric(m$resid[i]))
a<-table.row.end(a)
}
a<-table.end(a)
table.save(a,file='mytable1.tab')
a<-table.start()
a<-table.row.start(a)
a<-table.element(a,'What is next?',1,TRUE)
a<-table.row.end(a)
a<-table.row.start(a)
a<-table.element(a,hyperlink(paste('https://automated.biganalytics.eu/Patrick.Wessa/rwasp_demand_forecasting_simulate.wasp',sep=''),'Simulate Time Series','',target=''))
a<-table.row.end(a)
a<-table.row.start(a)
a<-table.element(a,hyperlink(paste('https://automated.biganalytics.eu/Patrick.Wessa/rwasp_demand_forecasting_croston.wasp',sep=''),'Generate Forecasts','',target=''))
a<-table.row.end(a)
a<-table.row.start(a)
a<-table.element(a,hyperlink(paste('https://automated.biganalytics.eu/Patrick.Wessa/rwasp_demand_forecasting_analysis.wasp',sep=''),'Forecast Analysis','',target=''))
a<-table.row.end(a)
a<-table.end(a)
table.save(a,file='mytable0.tab')
-SERVER-wessa.org