Free Statistics

of Irreproducible Research!

Author's title

Author*Unverified author*
R Software ModulePatrick.Wessarwasp_demand_forecasting_croston.wasp
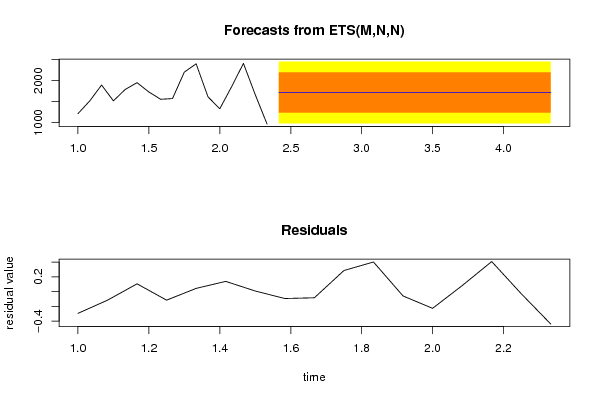
Title produced by softwareCroston Forecasting
Date of computationThu, 13 May 2010 14:21:18 +0000
Cite this page as followsStatistical Computations at FreeStatistics.org, Office for Research Development and Education, URL https://freestatistics.org/blog/index.php?v=date/2010/May/13/t12737605100c44490l1tjq55c.htm/, Retrieved Mon, 06 May 2024 08:33:37 +0000
Statistical Computations at FreeStatistics.org, Office for Research Development and Education, URL https://freestatistics.org/blog/index.php?pk=75964, Retrieved Mon, 06 May 2024 08:33:37 +0000
QR Codes:

Original text written by user:
IsPrivate?No (this computation is public)
User-defined keywordsFM50,steven,coomans,thesis,ETS,per3maand
Estimated Impact123
Family? (F = Feedback message, R = changed R code, M = changed R Module, P = changed Parameters, D = changed Data)
-       [Croston Forecasting] [FM50,steven,cooma...] [2010-05-13 14:21:18] [d41d8cd98f00b204e9800998ecf8427e] [Current]
Feedback Forum

Post a new message
Dataseries X:
1206.771667
1513.683333
1894.13
1514.458333
1788.191667
1951.223333
1727.026667
1552.248333
1569.528333
2203.916667
2402.373333
1611.8
1324.156667
1852.461667
2412.903333
1664
958.0283333


Summary of computational transaction
Raw Inputview raw input (R code)
Raw Outputview raw output of R engine
Computing time4 seconds
R Serverwessa.org @ wessa.org

\begin{tabular}{lllllllll}
\hline
Summary of computational transaction \tabularnewline
Raw Input & view raw input (R code)  \tabularnewline
Raw Output & view raw output of R engine  \tabularnewline
Computing time & 4 seconds \tabularnewline
R Server & wessa.org @ wessa.org \tabularnewline
\hline
\end{tabular}
%Source: https://freestatistics.org/blog/index.php?pk=75964&T=0

[TABLE]
[ROW][C]Summary of computational transaction[/C][/ROW]
[ROW][C]Raw Input[/C][C]view raw input (R code) [/C][/ROW]
[ROW][C]Raw Output[/C][C]view raw output of R engine [/C][/ROW]
[ROW][C]Computing time[/C][C]4 seconds[/C][/ROW]
[ROW][C]R Server[/C][C]wessa.org @ wessa.org[/C][/ROW]
[/TABLE]
Source: https://freestatistics.org/blog/index.php?pk=75964&T=0

Globally Unique Identifier (entire table): ba.freestatistics.org/blog/index.php?pk=75964&T=0

As an alternative you can also use a QR Code:  

The GUIDs for individual cells are displayed in the table below:

Summary of computational transaction
Raw Inputview raw input (R code)
Raw Outputview raw output of R engine
Computing time4 seconds
R Serverwessa.org @ wessa.org


Demand Forecast
PointForecast95% LB80% LB80% UB95% UB
181714.53260795644972.4807406261361229.330971705142199.734244207732456.58447528674
191714.53260795644972.4807367281461229.330969156382199.734246756492456.58447918473
201714.53260795644972.4807328301541229.330966607622199.734249305252456.58448308272
211714.53260795644972.4807289321631229.330964058862199.734251854012456.58448698071
221714.53260795644972.4807250341741229.330961510112199.734254402772456.5844908787
231714.53260795644972.4807211361831229.330958961352199.734256951532456.58449477669
241714.53260795644972.4807172381931229.330956412592199.734259500292456.58449867468
251714.53260795644972.4807133402021229.330953863832199.734262049052456.58450257267
261714.53260795644972.4807094422121229.330951315072199.734264597802456.58450647066
271714.53260795644972.4807055442211229.330948766312199.734267146562456.58451036865
281714.53260795644972.480701646231229.330946217552199.734269695322456.58451426664
291714.53260795644972.480697748241229.330943668792199.734272244082456.58451816463
301714.53260795644972.480693850251229.330941120032199.734274792842456.58452206262
311714.53260795644972.480689952261229.330938571282199.73427734162456.58452596061
321714.53260795644972.480686054271229.330936022522199.734279890362456.58452985861
331714.53260795644972.4806821562781229.330933473762199.734282439122456.58453375660
341714.53260795644972.4806782582881229.330930925002199.734284987882456.58453765459
351714.53260795644972.4806743602971229.330928376242199.734287536642456.58454155258
361714.53260795644972.4806704623081229.330925827482199.734290085392456.58454545057
371714.53260795644972.4806665643171229.330923278722199.734292634152456.58454934856
381714.53260795644972.4806626663271229.330920729962199.734295182912456.58455324655
391714.53260795644972.4806587683371229.330918181202199.734297731672456.58455714454
401714.53260795644972.4806548703461229.330915632452199.734300280432456.58456104253
411714.53260795644972.4806509723571229.330913083692199.734302829192456.58456494052

\begin{tabular}{lllllllll}
\hline
Demand Forecast \tabularnewline
Point & Forecast & 95% LB & 80% LB & 80% UB & 95% UB \tabularnewline
18 & 1714.53260795644 & 972.480740626136 & 1229.33097170514 & 2199.73424420773 & 2456.58447528674 \tabularnewline
19 & 1714.53260795644 & 972.480736728146 & 1229.33096915638 & 2199.73424675649 & 2456.58447918473 \tabularnewline
20 & 1714.53260795644 & 972.480732830154 & 1229.33096660762 & 2199.73424930525 & 2456.58448308272 \tabularnewline
21 & 1714.53260795644 & 972.480728932163 & 1229.33096405886 & 2199.73425185401 & 2456.58448698071 \tabularnewline
22 & 1714.53260795644 & 972.480725034174 & 1229.33096151011 & 2199.73425440277 & 2456.5844908787 \tabularnewline
23 & 1714.53260795644 & 972.480721136183 & 1229.33095896135 & 2199.73425695153 & 2456.58449477669 \tabularnewline
24 & 1714.53260795644 & 972.480717238193 & 1229.33095641259 & 2199.73425950029 & 2456.58449867468 \tabularnewline
25 & 1714.53260795644 & 972.480713340202 & 1229.33095386383 & 2199.73426204905 & 2456.58450257267 \tabularnewline
26 & 1714.53260795644 & 972.480709442212 & 1229.33095131507 & 2199.73426459780 & 2456.58450647066 \tabularnewline
27 & 1714.53260795644 & 972.480705544221 & 1229.33094876631 & 2199.73426714656 & 2456.58451036865 \tabularnewline
28 & 1714.53260795644 & 972.48070164623 & 1229.33094621755 & 2199.73426969532 & 2456.58451426664 \tabularnewline
29 & 1714.53260795644 & 972.48069774824 & 1229.33094366879 & 2199.73427224408 & 2456.58451816463 \tabularnewline
30 & 1714.53260795644 & 972.48069385025 & 1229.33094112003 & 2199.73427479284 & 2456.58452206262 \tabularnewline
31 & 1714.53260795644 & 972.48068995226 & 1229.33093857128 & 2199.7342773416 & 2456.58452596061 \tabularnewline
32 & 1714.53260795644 & 972.48068605427 & 1229.33093602252 & 2199.73427989036 & 2456.58452985861 \tabularnewline
33 & 1714.53260795644 & 972.480682156278 & 1229.33093347376 & 2199.73428243912 & 2456.58453375660 \tabularnewline
34 & 1714.53260795644 & 972.480678258288 & 1229.33093092500 & 2199.73428498788 & 2456.58453765459 \tabularnewline
35 & 1714.53260795644 & 972.480674360297 & 1229.33092837624 & 2199.73428753664 & 2456.58454155258 \tabularnewline
36 & 1714.53260795644 & 972.480670462308 & 1229.33092582748 & 2199.73429008539 & 2456.58454545057 \tabularnewline
37 & 1714.53260795644 & 972.480666564317 & 1229.33092327872 & 2199.73429263415 & 2456.58454934856 \tabularnewline
38 & 1714.53260795644 & 972.480662666327 & 1229.33092072996 & 2199.73429518291 & 2456.58455324655 \tabularnewline
39 & 1714.53260795644 & 972.480658768337 & 1229.33091818120 & 2199.73429773167 & 2456.58455714454 \tabularnewline
40 & 1714.53260795644 & 972.480654870346 & 1229.33091563245 & 2199.73430028043 & 2456.58456104253 \tabularnewline
41 & 1714.53260795644 & 972.480650972357 & 1229.33091308369 & 2199.73430282919 & 2456.58456494052 \tabularnewline
\hline
\end{tabular}
%Source: https://freestatistics.org/blog/index.php?pk=75964&T=1

[TABLE]
[ROW][C]Demand Forecast[/C][/ROW]
[ROW][C]Point[/C][C]Forecast[/C][C]95% LB[/C][C]80% LB[/C][C]80% UB[/C][C]95% UB[/C][/ROW]
[ROW][C]18[/C][C]1714.53260795644[/C][C]972.480740626136[/C][C]1229.33097170514[/C][C]2199.73424420773[/C][C]2456.58447528674[/C][/ROW]
[ROW][C]19[/C][C]1714.53260795644[/C][C]972.480736728146[/C][C]1229.33096915638[/C][C]2199.73424675649[/C][C]2456.58447918473[/C][/ROW]
[ROW][C]20[/C][C]1714.53260795644[/C][C]972.480732830154[/C][C]1229.33096660762[/C][C]2199.73424930525[/C][C]2456.58448308272[/C][/ROW]
[ROW][C]21[/C][C]1714.53260795644[/C][C]972.480728932163[/C][C]1229.33096405886[/C][C]2199.73425185401[/C][C]2456.58448698071[/C][/ROW]
[ROW][C]22[/C][C]1714.53260795644[/C][C]972.480725034174[/C][C]1229.33096151011[/C][C]2199.73425440277[/C][C]2456.5844908787[/C][/ROW]
[ROW][C]23[/C][C]1714.53260795644[/C][C]972.480721136183[/C][C]1229.33095896135[/C][C]2199.73425695153[/C][C]2456.58449477669[/C][/ROW]
[ROW][C]24[/C][C]1714.53260795644[/C][C]972.480717238193[/C][C]1229.33095641259[/C][C]2199.73425950029[/C][C]2456.58449867468[/C][/ROW]
[ROW][C]25[/C][C]1714.53260795644[/C][C]972.480713340202[/C][C]1229.33095386383[/C][C]2199.73426204905[/C][C]2456.58450257267[/C][/ROW]
[ROW][C]26[/C][C]1714.53260795644[/C][C]972.480709442212[/C][C]1229.33095131507[/C][C]2199.73426459780[/C][C]2456.58450647066[/C][/ROW]
[ROW][C]27[/C][C]1714.53260795644[/C][C]972.480705544221[/C][C]1229.33094876631[/C][C]2199.73426714656[/C][C]2456.58451036865[/C][/ROW]
[ROW][C]28[/C][C]1714.53260795644[/C][C]972.48070164623[/C][C]1229.33094621755[/C][C]2199.73426969532[/C][C]2456.58451426664[/C][/ROW]
[ROW][C]29[/C][C]1714.53260795644[/C][C]972.48069774824[/C][C]1229.33094366879[/C][C]2199.73427224408[/C][C]2456.58451816463[/C][/ROW]
[ROW][C]30[/C][C]1714.53260795644[/C][C]972.48069385025[/C][C]1229.33094112003[/C][C]2199.73427479284[/C][C]2456.58452206262[/C][/ROW]
[ROW][C]31[/C][C]1714.53260795644[/C][C]972.48068995226[/C][C]1229.33093857128[/C][C]2199.7342773416[/C][C]2456.58452596061[/C][/ROW]
[ROW][C]32[/C][C]1714.53260795644[/C][C]972.48068605427[/C][C]1229.33093602252[/C][C]2199.73427989036[/C][C]2456.58452985861[/C][/ROW]
[ROW][C]33[/C][C]1714.53260795644[/C][C]972.480682156278[/C][C]1229.33093347376[/C][C]2199.73428243912[/C][C]2456.58453375660[/C][/ROW]
[ROW][C]34[/C][C]1714.53260795644[/C][C]972.480678258288[/C][C]1229.33093092500[/C][C]2199.73428498788[/C][C]2456.58453765459[/C][/ROW]
[ROW][C]35[/C][C]1714.53260795644[/C][C]972.480674360297[/C][C]1229.33092837624[/C][C]2199.73428753664[/C][C]2456.58454155258[/C][/ROW]
[ROW][C]36[/C][C]1714.53260795644[/C][C]972.480670462308[/C][C]1229.33092582748[/C][C]2199.73429008539[/C][C]2456.58454545057[/C][/ROW]
[ROW][C]37[/C][C]1714.53260795644[/C][C]972.480666564317[/C][C]1229.33092327872[/C][C]2199.73429263415[/C][C]2456.58454934856[/C][/ROW]
[ROW][C]38[/C][C]1714.53260795644[/C][C]972.480662666327[/C][C]1229.33092072996[/C][C]2199.73429518291[/C][C]2456.58455324655[/C][/ROW]
[ROW][C]39[/C][C]1714.53260795644[/C][C]972.480658768337[/C][C]1229.33091818120[/C][C]2199.73429773167[/C][C]2456.58455714454[/C][/ROW]
[ROW][C]40[/C][C]1714.53260795644[/C][C]972.480654870346[/C][C]1229.33091563245[/C][C]2199.73430028043[/C][C]2456.58456104253[/C][/ROW]
[ROW][C]41[/C][C]1714.53260795644[/C][C]972.480650972357[/C][C]1229.33091308369[/C][C]2199.73430282919[/C][C]2456.58456494052[/C][/ROW]
[/TABLE]
Source: https://freestatistics.org/blog/index.php?pk=75964&T=1

Globally Unique Identifier (entire table): ba.freestatistics.org/blog/index.php?pk=75964&T=1

As an alternative you can also use a QR Code:  

The GUIDs for individual cells are displayed in the table below:

Demand Forecast
PointForecast95% LB80% LB80% UB95% UB
181714.53260795644972.4807406261361229.330971705142199.734244207732456.58447528674
191714.53260795644972.4807367281461229.330969156382199.734246756492456.58447918473
201714.53260795644972.4807328301541229.330966607622199.734249305252456.58448308272
211714.53260795644972.4807289321631229.330964058862199.734251854012456.58448698071
221714.53260795644972.4807250341741229.330961510112199.734254402772456.5844908787
231714.53260795644972.4807211361831229.330958961352199.734256951532456.58449477669
241714.53260795644972.4807172381931229.330956412592199.734259500292456.58449867468
251714.53260795644972.4807133402021229.330953863832199.734262049052456.58450257267
261714.53260795644972.4807094422121229.330951315072199.734264597802456.58450647066
271714.53260795644972.4807055442211229.330948766312199.734267146562456.58451036865
281714.53260795644972.480701646231229.330946217552199.734269695322456.58451426664
291714.53260795644972.480697748241229.330943668792199.734272244082456.58451816463
301714.53260795644972.480693850251229.330941120032199.734274792842456.58452206262
311714.53260795644972.480689952261229.330938571282199.73427734162456.58452596061
321714.53260795644972.480686054271229.330936022522199.734279890362456.58452985861
331714.53260795644972.4806821562781229.330933473762199.734282439122456.58453375660
341714.53260795644972.4806782582881229.330930925002199.734284987882456.58453765459
351714.53260795644972.4806743602971229.330928376242199.734287536642456.58454155258
361714.53260795644972.4806704623081229.330925827482199.734290085392456.58454545057
371714.53260795644972.4806665643171229.330923278722199.734292634152456.58454934856
381714.53260795644972.4806626663271229.330920729962199.734295182912456.58455324655
391714.53260795644972.4806587683371229.330918181202199.734297731672456.58455714454
401714.53260795644972.4806548703461229.330915632452199.734300280432456.58456104253
411714.53260795644972.4806509723571229.330913083692199.734302829192456.58456494052


Actuals and Interpolation
TimeActualForecast
11206.7716671207.06781822411
21513.6833331513.80045202859
31894.131894.02520423394
41514.4583331514.57499890733
51788.1916671788.14866101310
61951.2233331951.08523975434
71727.0266671727.01935523527
81552.2483331552.34296373546
91569.5283331569.61287627747
102203.9166672203.63118055244
112402.3733332401.97213205228
121611.81611.85994419293
131324.1566671324.38436979650
141852.4616671852.38121813301
152412.9033332412.49601768148
1616641664.02951883963
17958.0283333958.469588591173

\begin{tabular}{lllllllll}
\hline
Actuals and Interpolation \tabularnewline
Time & Actual & Forecast \tabularnewline
1 & 1206.771667 & 1207.06781822411 \tabularnewline
2 & 1513.683333 & 1513.80045202859 \tabularnewline
3 & 1894.13 & 1894.02520423394 \tabularnewline
4 & 1514.458333 & 1514.57499890733 \tabularnewline
5 & 1788.191667 & 1788.14866101310 \tabularnewline
6 & 1951.223333 & 1951.08523975434 \tabularnewline
7 & 1727.026667 & 1727.01935523527 \tabularnewline
8 & 1552.248333 & 1552.34296373546 \tabularnewline
9 & 1569.528333 & 1569.61287627747 \tabularnewline
10 & 2203.916667 & 2203.63118055244 \tabularnewline
11 & 2402.373333 & 2401.97213205228 \tabularnewline
12 & 1611.8 & 1611.85994419293 \tabularnewline
13 & 1324.156667 & 1324.38436979650 \tabularnewline
14 & 1852.461667 & 1852.38121813301 \tabularnewline
15 & 2412.903333 & 2412.49601768148 \tabularnewline
16 & 1664 & 1664.02951883963 \tabularnewline
17 & 958.0283333 & 958.469588591173 \tabularnewline
\hline
\end{tabular}
%Source: https://freestatistics.org/blog/index.php?pk=75964&T=2

[TABLE]
[ROW][C]Actuals and Interpolation[/C][/ROW]
[ROW][C]Time[/C][C]Actual[/C][C]Forecast[/C][/ROW]
[ROW][C]1[/C][C]1206.771667[/C][C]1207.06781822411[/C][/ROW]
[ROW][C]2[/C][C]1513.683333[/C][C]1513.80045202859[/C][/ROW]
[ROW][C]3[/C][C]1894.13[/C][C]1894.02520423394[/C][/ROW]
[ROW][C]4[/C][C]1514.458333[/C][C]1514.57499890733[/C][/ROW]
[ROW][C]5[/C][C]1788.191667[/C][C]1788.14866101310[/C][/ROW]
[ROW][C]6[/C][C]1951.223333[/C][C]1951.08523975434[/C][/ROW]
[ROW][C]7[/C][C]1727.026667[/C][C]1727.01935523527[/C][/ROW]
[ROW][C]8[/C][C]1552.248333[/C][C]1552.34296373546[/C][/ROW]
[ROW][C]9[/C][C]1569.528333[/C][C]1569.61287627747[/C][/ROW]
[ROW][C]10[/C][C]2203.916667[/C][C]2203.63118055244[/C][/ROW]
[ROW][C]11[/C][C]2402.373333[/C][C]2401.97213205228[/C][/ROW]
[ROW][C]12[/C][C]1611.8[/C][C]1611.85994419293[/C][/ROW]
[ROW][C]13[/C][C]1324.156667[/C][C]1324.38436979650[/C][/ROW]
[ROW][C]14[/C][C]1852.461667[/C][C]1852.38121813301[/C][/ROW]
[ROW][C]15[/C][C]2412.903333[/C][C]2412.49601768148[/C][/ROW]
[ROW][C]16[/C][C]1664[/C][C]1664.02951883963[/C][/ROW]
[ROW][C]17[/C][C]958.0283333[/C][C]958.469588591173[/C][/ROW]
[/TABLE]
Source: https://freestatistics.org/blog/index.php?pk=75964&T=2

Globally Unique Identifier (entire table): ba.freestatistics.org/blog/index.php?pk=75964&T=2

As an alternative you can also use a QR Code:  

The GUIDs for individual cells are displayed in the table below:

Actuals and Interpolation
TimeActualForecast
11206.7716671207.06781822411
21513.6833331513.80045202859
31894.131894.02520423394
41514.4583331514.57499890733
51788.1916671788.14866101310
61951.2233331951.08523975434
71727.0266671727.01935523527
81552.2483331552.34296373546
91569.5283331569.61287627747
102203.9166672203.63118055244
112402.3733332401.97213205228
121611.81611.85994419293
131324.1566671324.38436979650
141852.4616671852.38121813301
152412.9033332412.49601768148
1616641664.02951883963
17958.0283333958.469588591173


\begin{tabular}{lllllllll}
\hline
What is next? \tabularnewline
Simulate Time Series \tabularnewline
Generate Forecasts \tabularnewline
Forecast Analysis \tabularnewline
\hline
\end{tabular}
%Source: https://freestatistics.org/blog/index.php?pk=75964&T=3

[TABLE]
[ROW][C]What is next?[/C][/ROW]
[ROW][C]Simulate Time Series[/C][/ROW]
[ROW][C]Generate Forecasts[/C][/ROW]
[ROW][C]Forecast Analysis[/C][/ROW]
[/TABLE]
Source: https://freestatistics.org/blog/index.php?pk=75964&T=3

Globally Unique Identifier (entire table): ba.freestatistics.org/blog/index.php?pk=75964&T=3

As an alternative you can also use a QR Code:  

The GUIDs for individual cells are displayed in the table below:

What is next?
Simulate Time Series
Generate Forecasts
Forecast Analysis


Parameters (Session):
par1 = Input box ; par2 = ARIMA ; par3 = NA ; par4 = NA ; par5 = ZZZ ; par6 = 12 ; par7 = dum ; par8 = dumresult ; par9 = 3 ; par10 = 0.1 ;
Parameters (R input):
par1 = Input box ; par2 = ETS ; par3 = NA ; par4 = NA ; par5 = ZZZ ; par6 = 12 ; par7 = dum ; par8 = dumresult ; par9 = 3 ; par10 = 0.1 ;
R code (references can be found in the software module):
if(par3!='NA') par3 <- as.numeric(par3) else par3 <- NA
if(par4!='NA') par4 <- as.numeric(par4) else par4 <- NA
par6 <- as.numeric(par6) #Seasonal Period
par9 <- as.numeric(par9) #Forecast Horizon
par10 <- as.numeric(par10) #Alpha
library(forecast)
if (par1 == 'CSV') {
xarr <- read.csv(file=paste('tmp/',par7,'.csv',sep=''),header=T)
numseries <- length(xarr[1,])-1
n <- length(xarr[,1])
nmh <- n - par9
nmhp1 <- nmh + 1
rarr <- array(NA,dim=c(n,numseries))
farr <- array(NA,dim=c(n,numseries))
parr <- array(NA,dim=c(numseries,8))
colnames(parr) = list('ME','RMSE','MAE','MPE','MAPE','MASE','ACF1','TheilU')
for(i in 1:numseries) {
sindex <- i+1
x <- xarr[,sindex]
if(par2=='Croston') {
if (i==1) m <- croston(x,alpha=par10)
if (i==1) mydemand <- m$model$demand[]
fit <- croston(x[1:nmh],h=par9,alpha=par10)
}
if(par2=='ARIMA') {
m <- auto.arima(ts(x,freq=par6),d=par3,D=par4)
mydemand <- forecast(m)
fit <- auto.arima(ts(x[1:nmh],freq=par6),d=par3,D=par4)
}
if(par2=='ETS') {
m <- ets(ts(x,freq=par6),model=par5)
mydemand <- forecast(m)
fit <- ets(ts(x[1:nmh],freq=par6),model=par5)
}
try(rarr[,i] <- mydemand$resid,silent=T)
try(farr[,i] <- mydemand$mean,silent=T)
if (par2!='Croston') parr[i,] <- accuracy(forecast(fit,par9),x[nmhp1:n])
if (par2=='Croston') parr[i,] <- accuracy(fit,x[nmhp1:n])
}
write.csv(farr,file=paste('tmp/',par8,'_f.csv',sep=''))
write.csv(rarr,file=paste('tmp/',par8,'_r.csv',sep=''))
write.csv(parr,file=paste('tmp/',par8,'_p.csv',sep=''))
}
if (par1 == 'Input box') {
numseries <- 1
n <- length(x)
if(par2=='Croston') {
m <- croston(x)
mydemand <- m$model$demand[]
}
if(par2=='ARIMA') {
m <- auto.arima(ts(x,freq=par6),d=par3,D=par4)
mydemand <- forecast(m)
}
if(par2=='ETS') {
m <- ets(ts(x,freq=par6),model=par5)
mydemand <- forecast(m)
}
summary(m)
}
bitmap(file='test1.png')
op <- par(mfrow=c(2,1))
if (par2=='Croston') plot(m)
if ((par2=='ARIMA') | par2=='ETS') plot(forecast(m))
plot(mydemand$resid,type='l',main='Residuals', ylab='residual value', xlab='time')
par(op)
dev.off()
bitmap(file='pic2.png')
op <- par(mfrow=c(2,2))
acf(mydemand$resid, lag.max=n/3, main='Residual ACF', ylab='autocorrelation', xlab='time lag')
pacf(mydemand$resid,lag.max=n/3, main='Residual PACF', ylab='partial autocorrelation', xlab='time lag')
cpgram(mydemand$resid, main='Cumulative Periodogram of Residuals')
qqnorm(mydemand$resid); qqline(mydemand$resid, col=2)
par(op)
dev.off()
load(file='createtable')
a<-table.start()
a<-table.row.start(a)
a<-table.element(a,'Demand Forecast',6,TRUE)
a<-table.row.end(a)
a<-table.row.start(a)
a<-table.element(a,'Point',header=TRUE)
a<-table.element(a,'Forecast',header=TRUE)
a<-table.element(a,'95% LB',header=TRUE)
a<-table.element(a,'80% LB',header=TRUE)
a<-table.element(a,'80% UB',header=TRUE)
a<-table.element(a,'95% UB',header=TRUE)
a<-table.row.end(a)
for (i in 1:length(mydemand$mean)) {
a<-table.row.start(a)
a<-table.element(a,i+n,header=TRUE)
a<-table.element(a,as.numeric(mydemand$mean[i]))
a<-table.element(a,as.numeric(mydemand$lower[i,2]))
a<-table.element(a,as.numeric(mydemand$lower[i,1]))
a<-table.element(a,as.numeric(mydemand$upper[i,1]))
a<-table.element(a,as.numeric(mydemand$upper[i,2]))
a<-table.row.end(a)
}
a<-table.end(a)
table.save(a,file='mytable.tab')
a<-table.start()
a<-table.row.start(a)
a<-table.element(a,'Actuals and Interpolation',3,TRUE)
a<-table.row.end(a)
a<-table.row.start(a)
a<-table.element(a,'Time',header=TRUE)
a<-table.element(a,'Actual',header=TRUE)
a<-table.element(a,'Forecast',header=TRUE)
a<-table.row.end(a)
for (i in 1:n) {
a<-table.row.start(a)
a<-table.element(a,i,header=TRUE)
a<-table.element(a,x[i])
a<-table.element(a,x[i] - as.numeric(m$resid[i]))
a<-table.row.end(a)
}
a<-table.end(a)
table.save(a,file='mytable1.tab')
a<-table.start()
a<-table.row.start(a)
a<-table.element(a,'What is next?',1,TRUE)
a<-table.row.end(a)
a<-table.row.start(a)
a<-table.element(a,hyperlink(paste('https://automated.biganalytics.eu/Patrick.Wessa/rwasp_demand_forecasting_simulate.wasp',sep=''),'Simulate Time Series','',target=''))
a<-table.row.end(a)
a<-table.row.start(a)
a<-table.element(a,hyperlink(paste('https://automated.biganalytics.eu/Patrick.Wessa/rwasp_demand_forecasting_croston.wasp',sep=''),'Generate Forecasts','',target=''))
a<-table.row.end(a)
a<-table.row.start(a)
a<-table.element(a,hyperlink(paste('https://automated.biganalytics.eu/Patrick.Wessa/rwasp_demand_forecasting_analysis.wasp',sep=''),'Forecast Analysis','',target=''))
a<-table.row.end(a)
a<-table.end(a)
table.save(a,file='mytable0.tab')
-SERVER-wessa.org