Free Statistics

of Irreproducible Research!

Author's title

Author*Unverified author*
R Software Modulerwasp_smp.wasp
Title produced by softwareStandard Deviation-Mean Plot
Date of computationThu, 27 May 2010 19:24:22 +0000
Cite this page as followsStatistical Computations at FreeStatistics.org, Office for Research Development and Education, URL https://freestatistics.org/blog/index.php?v=date/2010/May/27/t1274988311tqfpa77cbemrsov.htm/, Retrieved Thu, 02 May 2024 10:11:26 +0000
Statistical Computations at FreeStatistics.org, Office for Research Development and Education, URL https://freestatistics.org/blog/index.php?pk=76615, Retrieved Thu, 02 May 2024 10:11:26 +0000
QR Codes:

Original text written by user:
IsPrivate?No (this computation is public)
User-defined keywordsKDGP2W83
Estimated Impact174
Family? (F = Feedback message, R = changed R code, M = changed R Module, P = changed Parameters, D = changed Data)
-       [Standard Deviation-Mean Plot] [Spreidings en gem...] [2010-05-27 19:24:22] [03859715711bd3369851d387eaa83ba4] [Current]
Feedback Forum

Post a new message
Dataseries X:
1954
2302
3054
2414
2226
2725
2589
3470
2400
3180
4009
3924
2072
2434
2956
2828
2687
2629
3150
4119
3030
3055
3821
4001
2529
2472
3134
2789
2758
2993
3282
3437
2804
3076
3782
3889
2271
2452
3084
2522
2769
3438
2839
3746
2632
2851
3871
3618
2389
2344
2678
2492
2858
2246
2800
3869
3007
3023
3907
4209
2353
2570
2903
2910
3782
2759
2931
3641
2794
3070
3576
4106
2452
2206
2488
2416
2534
2521
3093
3903
2907
3025
3812
4209


Summary of computational transaction
Raw Inputview raw input (R code)
Raw Outputview raw output of R engine
Computing time2 seconds
R Server'Sir Ronald Aylmer Fisher' @ 193.190.124.24

\begin{tabular}{lllllllll}
\hline
Summary of computational transaction \tabularnewline
Raw Input & view raw input (R code)  \tabularnewline
Raw Output & view raw output of R engine  \tabularnewline
Computing time & 2 seconds \tabularnewline
R Server & 'Sir Ronald Aylmer Fisher' @ 193.190.124.24 \tabularnewline
\hline
\end{tabular}
%Source: https://freestatistics.org/blog/index.php?pk=76615&T=0

[TABLE]
[ROW][C]Summary of computational transaction[/C][/ROW]
[ROW][C]Raw Input[/C][C]view raw input (R code) [/C][/ROW]
[ROW][C]Raw Output[/C][C]view raw output of R engine [/C][/ROW]
[ROW][C]Computing time[/C][C]2 seconds[/C][/ROW]
[ROW][C]R Server[/C][C]'Sir Ronald Aylmer Fisher' @ 193.190.124.24[/C][/ROW]
[/TABLE]
Source: https://freestatistics.org/blog/index.php?pk=76615&T=0

Globally Unique Identifier (entire table): ba.freestatistics.org/blog/index.php?pk=76615&T=0

As an alternative you can also use a QR Code:  

The GUIDs for individual cells are displayed in the table below:

Summary of computational transaction
Raw Inputview raw input (R code)
Raw Outputview raw output of R engine
Computing time2 seconds
R Server'Sir Ronald Aylmer Fisher' @ 193.190.124.24


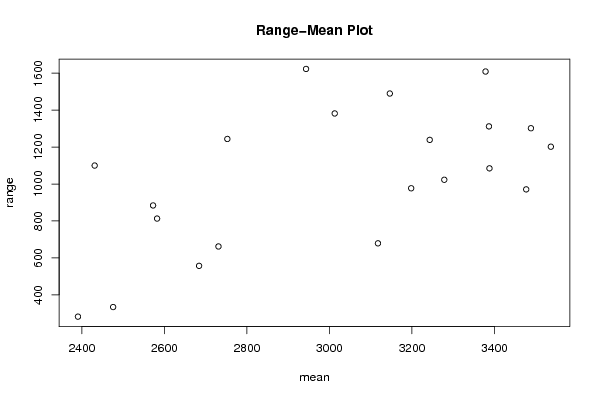
Standard Deviation-Mean Plot
SectionMeanStandard DeviationRange
12431459.1978513306291100
22752.5522.6525295707151244
33378.25750.9915112702671609
42572.5400.847019863356884
53146.25689.133453451991490
63476.75506.887479295619971
72731302.025385246561662
83117.5302.148418275964679
93387.75530.6086913473371085
102582.25350.820348136574813
113198472.872780636258977
123243594.9773104917531239
132475.75148.383231307764334
142943.25676.0075813184351623
153536.5614.7029092713541202
162684271.780548727584557
173278.25508.4468998823771023
183386.5578.7397227309241312
192390.5126.463433450148282
203012.75650.6419266129931382
213488.25626.2977859346681302

\begin{tabular}{lllllllll}
\hline
Standard Deviation-Mean Plot \tabularnewline
Section & Mean & Standard Deviation & Range \tabularnewline
1 & 2431 & 459.197851330629 & 1100 \tabularnewline
2 & 2752.5 & 522.652529570715 & 1244 \tabularnewline
3 & 3378.25 & 750.991511270267 & 1609 \tabularnewline
4 & 2572.5 & 400.847019863356 & 884 \tabularnewline
5 & 3146.25 & 689.13345345199 & 1490 \tabularnewline
6 & 3476.75 & 506.887479295619 & 971 \tabularnewline
7 & 2731 & 302.025385246561 & 662 \tabularnewline
8 & 3117.5 & 302.148418275964 & 679 \tabularnewline
9 & 3387.75 & 530.608691347337 & 1085 \tabularnewline
10 & 2582.25 & 350.820348136574 & 813 \tabularnewline
11 & 3198 & 472.872780636258 & 977 \tabularnewline
12 & 3243 & 594.977310491753 & 1239 \tabularnewline
13 & 2475.75 & 148.383231307764 & 334 \tabularnewline
14 & 2943.25 & 676.007581318435 & 1623 \tabularnewline
15 & 3536.5 & 614.702909271354 & 1202 \tabularnewline
16 & 2684 & 271.780548727584 & 557 \tabularnewline
17 & 3278.25 & 508.446899882377 & 1023 \tabularnewline
18 & 3386.5 & 578.739722730924 & 1312 \tabularnewline
19 & 2390.5 & 126.463433450148 & 282 \tabularnewline
20 & 3012.75 & 650.641926612993 & 1382 \tabularnewline
21 & 3488.25 & 626.297785934668 & 1302 \tabularnewline
\hline
\end{tabular}
%Source: https://freestatistics.org/blog/index.php?pk=76615&T=1

[TABLE]
[ROW][C]Standard Deviation-Mean Plot[/C][/ROW]
[ROW][C]Section[/C][C]Mean[/C][C]Standard Deviation[/C][C]Range[/C][/ROW]
[ROW][C]1[/C][C]2431[/C][C]459.197851330629[/C][C]1100[/C][/ROW]
[ROW][C]2[/C][C]2752.5[/C][C]522.652529570715[/C][C]1244[/C][/ROW]
[ROW][C]3[/C][C]3378.25[/C][C]750.991511270267[/C][C]1609[/C][/ROW]
[ROW][C]4[/C][C]2572.5[/C][C]400.847019863356[/C][C]884[/C][/ROW]
[ROW][C]5[/C][C]3146.25[/C][C]689.13345345199[/C][C]1490[/C][/ROW]
[ROW][C]6[/C][C]3476.75[/C][C]506.887479295619[/C][C]971[/C][/ROW]
[ROW][C]7[/C][C]2731[/C][C]302.025385246561[/C][C]662[/C][/ROW]
[ROW][C]8[/C][C]3117.5[/C][C]302.148418275964[/C][C]679[/C][/ROW]
[ROW][C]9[/C][C]3387.75[/C][C]530.608691347337[/C][C]1085[/C][/ROW]
[ROW][C]10[/C][C]2582.25[/C][C]350.820348136574[/C][C]813[/C][/ROW]
[ROW][C]11[/C][C]3198[/C][C]472.872780636258[/C][C]977[/C][/ROW]
[ROW][C]12[/C][C]3243[/C][C]594.977310491753[/C][C]1239[/C][/ROW]
[ROW][C]13[/C][C]2475.75[/C][C]148.383231307764[/C][C]334[/C][/ROW]
[ROW][C]14[/C][C]2943.25[/C][C]676.007581318435[/C][C]1623[/C][/ROW]
[ROW][C]15[/C][C]3536.5[/C][C]614.702909271354[/C][C]1202[/C][/ROW]
[ROW][C]16[/C][C]2684[/C][C]271.780548727584[/C][C]557[/C][/ROW]
[ROW][C]17[/C][C]3278.25[/C][C]508.446899882377[/C][C]1023[/C][/ROW]
[ROW][C]18[/C][C]3386.5[/C][C]578.739722730924[/C][C]1312[/C][/ROW]
[ROW][C]19[/C][C]2390.5[/C][C]126.463433450148[/C][C]282[/C][/ROW]
[ROW][C]20[/C][C]3012.75[/C][C]650.641926612993[/C][C]1382[/C][/ROW]
[ROW][C]21[/C][C]3488.25[/C][C]626.297785934668[/C][C]1302[/C][/ROW]
[/TABLE]
Source: https://freestatistics.org/blog/index.php?pk=76615&T=1

Globally Unique Identifier (entire table): ba.freestatistics.org/blog/index.php?pk=76615&T=1

As an alternative you can also use a QR Code:  

The GUIDs for individual cells are displayed in the table below:

Standard Deviation-Mean Plot
SectionMeanStandard DeviationRange
12431459.1978513306291100
22752.5522.6525295707151244
33378.25750.9915112702671609
42572.5400.847019863356884
53146.25689.133453451991490
63476.75506.887479295619971
72731302.025385246561662
83117.5302.148418275964679
93387.75530.6086913473371085
102582.25350.820348136574813
113198472.872780636258977
123243594.9773104917531239
132475.75148.383231307764334
142943.25676.0075813184351623
153536.5614.7029092713541202
162684271.780548727584557
173278.25508.4468998823771023
183386.5578.7397227309241312
192390.5126.463433450148282
203012.75650.6419266129931382
213488.25626.2977859346681302


Regression: S.E.(k) = alpha + beta * Mean(k)
alpha-476.800610924133
beta0.317934580147282
S.D.0.0750846408538148
T-STAT4.23434908300728
p-value0.000448745583144832

\begin{tabular}{lllllllll}
\hline
Regression: S.E.(k) = alpha + beta * Mean(k) \tabularnewline
alpha & -476.800610924133 \tabularnewline
beta & 0.317934580147282 \tabularnewline
S.D. & 0.0750846408538148 \tabularnewline
T-STAT & 4.23434908300728 \tabularnewline
p-value & 0.000448745583144832 \tabularnewline
\hline
\end{tabular}
%Source: https://freestatistics.org/blog/index.php?pk=76615&T=2

[TABLE]
[ROW][C]Regression: S.E.(k) = alpha + beta * Mean(k)[/C][/ROW]
[ROW][C]alpha[/C][C]-476.800610924133[/C][/ROW]
[ROW][C]beta[/C][C]0.317934580147282[/C][/ROW]
[ROW][C]S.D.[/C][C]0.0750846408538148[/C][/ROW]
[ROW][C]T-STAT[/C][C]4.23434908300728[/C][/ROW]
[ROW][C]p-value[/C][C]0.000448745583144832[/C][/ROW]
[/TABLE]
Source: https://freestatistics.org/blog/index.php?pk=76615&T=2

Globally Unique Identifier (entire table): ba.freestatistics.org/blog/index.php?pk=76615&T=2

As an alternative you can also use a QR Code:  

The GUIDs for individual cells are displayed in the table below:

Regression: S.E.(k) = alpha + beta * Mean(k)
alpha-476.800610924133
beta0.317934580147282
S.D.0.0750846408538148
T-STAT4.23434908300728
p-value0.000448745583144832


Regression: ln S.E.(k) = alpha + beta * ln Mean(k)
alpha-14.7195176171425
beta2.59988562628623
S.D.0.596052553962124
T-STAT4.36183958780829
p-value0.000335627883011102
Lambda-1.59988562628623

\begin{tabular}{lllllllll}
\hline
Regression: ln S.E.(k) = alpha + beta * ln Mean(k) \tabularnewline
alpha & -14.7195176171425 \tabularnewline
beta & 2.59988562628623 \tabularnewline
S.D. & 0.596052553962124 \tabularnewline
T-STAT & 4.36183958780829 \tabularnewline
p-value & 0.000335627883011102 \tabularnewline
Lambda & -1.59988562628623 \tabularnewline
\hline
\end{tabular}
%Source: https://freestatistics.org/blog/index.php?pk=76615&T=3

[TABLE]
[ROW][C]Regression: ln S.E.(k) = alpha + beta * ln Mean(k)[/C][/ROW]
[ROW][C]alpha[/C][C]-14.7195176171425[/C][/ROW]
[ROW][C]beta[/C][C]2.59988562628623[/C][/ROW]
[ROW][C]S.D.[/C][C]0.596052553962124[/C][/ROW]
[ROW][C]T-STAT[/C][C]4.36183958780829[/C][/ROW]
[ROW][C]p-value[/C][C]0.000335627883011102[/C][/ROW]
[ROW][C]Lambda[/C][C]-1.59988562628623[/C][/ROW]
[/TABLE]
Source: https://freestatistics.org/blog/index.php?pk=76615&T=3

Globally Unique Identifier (entire table): ba.freestatistics.org/blog/index.php?pk=76615&T=3

As an alternative you can also use a QR Code:  

The GUIDs for individual cells are displayed in the table below:

Regression: ln S.E.(k) = alpha + beta * ln Mean(k)
alpha-14.7195176171425
beta2.59988562628623
S.D.0.596052553962124
T-STAT4.36183958780829
p-value0.000335627883011102
Lambda-1.59988562628623


Parameters (Session):
par1 = 4 ;
Parameters (R input):
par1 = 4 ;
R code (references can be found in the software module):
par1 <- as.numeric(par1)
(n <- length(x))
(np <- floor(n / par1))
arr <- array(NA,dim=c(par1,np))
j <- 0
k <- 1
for (i in 1:(np*par1))
{
j = j + 1
arr[j,k] <- x[i]
if (j == par1) {
j = 0
k=k+1
}
}
arr
arr.mean <- array(NA,dim=np)
arr.sd <- array(NA,dim=np)
arr.range <- array(NA,dim=np)
for (j in 1:np)
{
arr.mean[j] <- mean(arr[,j],na.rm=TRUE)
arr.sd[j] <- sd(arr[,j],na.rm=TRUE)
arr.range[j] <- max(arr[,j],na.rm=TRUE) - min(arr[,j],na.rm=TRUE)
}
arr.mean
arr.sd
arr.range
(lm1 <- lm(arr.sd~arr.mean))
(lnlm1 <- lm(log(arr.sd)~log(arr.mean)))
(lm2 <- lm(arr.range~arr.mean))
bitmap(file='test1.png')
plot(arr.mean,arr.sd,main='Standard Deviation-Mean Plot',xlab='mean',ylab='standard deviation')
dev.off()
bitmap(file='test2.png')
plot(arr.mean,arr.range,main='Range-Mean Plot',xlab='mean',ylab='range')
dev.off()
load(file='createtable')
a<-table.start()
a<-table.row.start(a)
a<-table.element(a,'Standard Deviation-Mean Plot',4,TRUE)
a<-table.row.end(a)
a<-table.row.start(a)
a<-table.element(a,'Section',header=TRUE)
a<-table.element(a,'Mean',header=TRUE)
a<-table.element(a,'Standard Deviation',header=TRUE)
a<-table.element(a,'Range',header=TRUE)
a<-table.row.end(a)
for (j in 1:np) {
a<-table.row.start(a)
a<-table.element(a,j,header=TRUE)
a<-table.element(a,arr.mean[j])
a<-table.element(a,arr.sd[j] )
a<-table.element(a,arr.range[j] )
a<-table.row.end(a)
}
a<-table.end(a)
table.save(a,file='mytable.tab')
a<-table.start()
a<-table.row.start(a)
a<-table.element(a,'Regression: S.E.(k) = alpha + beta * Mean(k)',2,TRUE)
a<-table.row.end(a)
a<-table.row.start(a)
a<-table.element(a,'alpha',header=TRUE)
a<-table.element(a,lm1$coefficients[[1]])
a<-table.row.end(a)
a<-table.row.start(a)
a<-table.element(a,'beta',header=TRUE)
a<-table.element(a,lm1$coefficients[[2]])
a<-table.row.end(a)
a<-table.row.start(a)
a<-table.element(a,'S.D.',header=TRUE)
a<-table.element(a,summary(lm1)$coefficients[2,2])
a<-table.row.end(a)
a<-table.row.start(a)
a<-table.element(a,'T-STAT',header=TRUE)
a<-table.element(a,summary(lm1)$coefficients[2,3])
a<-table.row.end(a)
a<-table.row.start(a)
a<-table.element(a,'p-value',header=TRUE)
a<-table.element(a,summary(lm1)$coefficients[2,4])
a<-table.row.end(a)
a<-table.end(a)
table.save(a,file='mytable1.tab')
a<-table.start()
a<-table.row.start(a)
a<-table.element(a,'Regression: ln S.E.(k) = alpha + beta * ln Mean(k)',2,TRUE)
a<-table.row.end(a)
a<-table.row.start(a)
a<-table.element(a,'alpha',header=TRUE)
a<-table.element(a,lnlm1$coefficients[[1]])
a<-table.row.end(a)
a<-table.row.start(a)
a<-table.element(a,'beta',header=TRUE)
a<-table.element(a,lnlm1$coefficients[[2]])
a<-table.row.end(a)
a<-table.row.start(a)
a<-table.element(a,'S.D.',header=TRUE)
a<-table.element(a,summary(lnlm1)$coefficients[2,2])
a<-table.row.end(a)
a<-table.row.start(a)
a<-table.element(a,'T-STAT',header=TRUE)
a<-table.element(a,summary(lnlm1)$coefficients[2,3])
a<-table.row.end(a)
a<-table.row.start(a)
a<-table.element(a,'p-value',header=TRUE)
a<-table.element(a,summary(lnlm1)$coefficients[2,4])
a<-table.row.end(a)
a<-table.row.start(a)
a<-table.element(a,'Lambda',header=TRUE)
a<-table.element(a,1-lnlm1$coefficients[[2]])
a<-table.row.end(a)
a<-table.end(a)
table.save(a,file='mytable2.tab')