Free Statistics

of Irreproducible Research!

Author's title

Author*The author of this computation has been verified*
R Software Modulerwasp_Two Factor ANOVA.wasp
Title produced by softwareTwo-Way ANOVA
Date of computationMon, 01 Nov 2010 10:16:21 +0000
Cite this page as followsStatistical Computations at FreeStatistics.org, Office for Research Development and Education, URL https://freestatistics.org/blog/index.php?v=date/2010/Nov/01/t1288606578c4v6b4s9jskea4w.htm/, Retrieved Mon, 29 Apr 2024 14:12:24 +0000
Statistical Computations at FreeStatistics.org, Office for Research Development and Education, URL https://freestatistics.org/blog/index.php?pk=90702, Retrieved Mon, 29 Apr 2024 14:12:24 +0000
QR Codes:

Original text written by user:
IsPrivate?No (this computation is public)
User-defined keywords
Estimated Impact170
Family? (F = Feedback message, R = changed R code, M = changed R Module, P = changed Parameters, D = changed Data)
-     [Two-Way ANOVA] [Golfballs] [2010-10-25 12:43:22] [b98453cac15ba1066b407e146608df68]
F   PD    [Two-Way ANOVA] [Q8] [2010-11-01 10:16:21] [dcc54e7e6e8c80b7c45e040080afe6ab] [Current]
-           [Two-Way ANOVA] [] [2010-11-02 08:42:13] [049b50ae610f671f7417ed8e2d1295c1]
Feedback Forum
2010-11-06 10:27:49 [48eb36e2c01435ad7e4ea7854a9d98fe] [reply
Het is voor mij als reviewer niet geheel duidelijk op welke manier de student de gegevens gerangschikt heeft of welke gegevens gebruikt werden.
Een voorbeeld dat gebruik maakt van alle gegevens is hier te vinden: http://www.freestatistics.org/blog/date/2010/Nov/02/t1288708918q70bwprmfyu7j1p.htm/

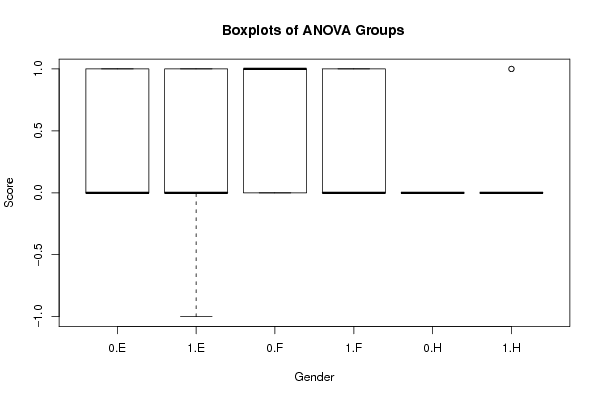
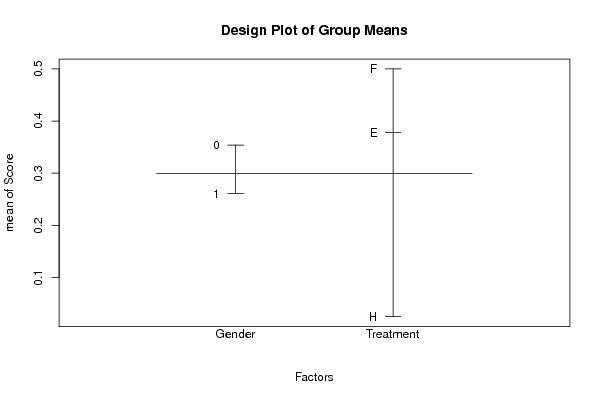
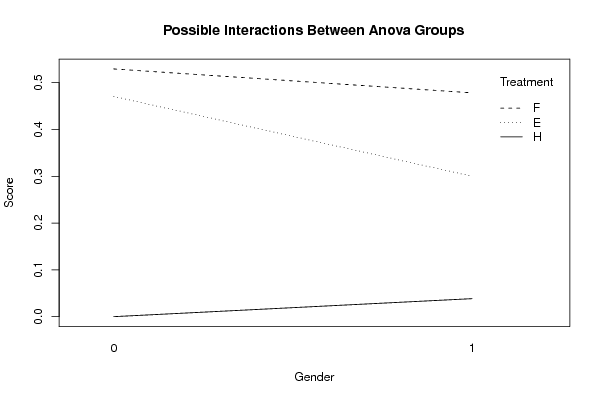
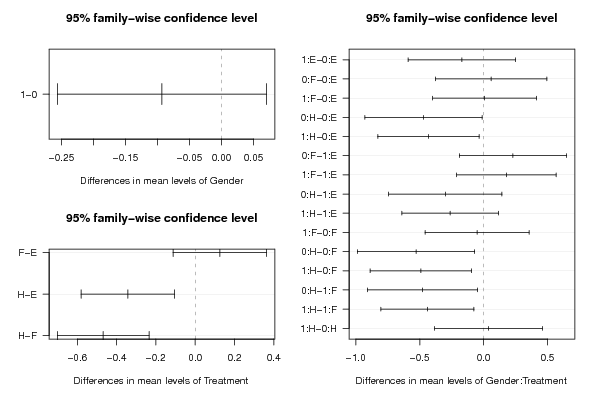
De algemene conclusie - namelijk dat F de beste treatment is - klopt dan weer wel. Wanneer we de P-waarde bekijken voor het geslacht zien we dat deze groot is, op basis hiervan kunnen we de nulhypothese dus aanvaarden en stellen dat het geslacht van de student - algemeen - van weinig invloed is. Echter is het wel zo dat het geslacht in combinatie met een bepaalde treatment wel effect kan hebben.

Post a new message
Dataseries X:
-1	1	'E'
0	1	'E'
0	1	'E'
0	0	'E'
0	1	'E'
0	0	'E'
0	1	'E'
0	1	'E'
0	0	'E'
0	1	'E'
0	1	'E'
0	1	'E'
0	1	'E'
0	0	'E'
0	0	'E'
0	1	'E'
0	0	'E'
0	0	'E'
0	1	'E'
0	0	'E'
0	1	'E'
0	0	'E'
1	1	'E'
1	0	'E'
1	0	'E'
1	0	'E'
1	1	'E'
1	1	'E'
1	0	'E'
1	0	'E'
1	1	'E'
1	1	'E'
1	0	'E'
1	1	'E'
1	0	'E'
1	0	'E'
1	1	'E'
0	1	'F'
0	1	'F'
0	1	'F'
0	0	'F'
0	0	'F'
0	1	'F'
0	0	'F'
0	1	'F'
0	0	'F'
0	0	'F'
0	1	'F'
0	1	'F'
0	1	'F'
0	0	'F'
0	1	'F'
0	1	'F'
0	0	'F'
0	0	'F'
0	1	'F'
0	1	'F'
1	0	'F'
1	1	'F'
1	0	'F'
1	1	'F'
1	0	'F'
1	0	'F'
1	1	'F'
1	0	'F'
1	0	'F'
1	0	'F'
1	0	'F'
1	1	'F'
1	0	'F'
1	1	'F'
1	1	'F'
1	1	'F'
1	1	'F'
1	1	'F'
1	1	'F'
1	1	'F'
0	1	'H'
0	1	'H'
0	1	'H'
0	0	'H'
0	0	'H'
0	0	'H'
0	0	'H'
0	0	'H'
0	1	'H'
0	0	'H'
0	0	'H'
0	1	'H'
0	0	'H'
0	0	'H'
0	0	'H'
0	1	'H'
0	1	'H'
0	1	'H'
0	0	'H'
0	1	'H'
0	1	'H'
0	1	'H'
0	0	'H'
0	1	'H'
0	1	'H'
0	1	'H'
0	1	'H'
0	1	'H'
0	1	'H'
0	1	'H'
0	0	'H'
0	1	'H'
0	1	'H'
0	1	'H'
0	1	'H'
0	0	'H'
0	1	'H'
0	1	'H'
0	1	'H'
1	1	'H'


Summary of computational transaction
Raw Inputview raw input (R code)
Raw Outputview raw output of R engine
Computing time3 seconds
R Server'RServer@AstonUniversity' @ vre.aston.ac.uk

\begin{tabular}{lllllllll}
\hline
Summary of computational transaction \tabularnewline
Raw Input & view raw input (R code)  \tabularnewline
Raw Output & view raw output of R engine  \tabularnewline
Computing time & 3 seconds \tabularnewline
R Server & 'RServer@AstonUniversity' @ vre.aston.ac.uk \tabularnewline
\hline
\end{tabular}
%Source: https://freestatistics.org/blog/index.php?pk=90702&T=0

[TABLE]
[ROW][C]Summary of computational transaction[/C][/ROW]
[ROW][C]Raw Input[/C][C]view raw input (R code) [/C][/ROW]
[ROW][C]Raw Output[/C][C]view raw output of R engine [/C][/ROW]
[ROW][C]Computing time[/C][C]3 seconds[/C][/ROW]
[ROW][C]R Server[/C][C]'RServer@AstonUniversity' @ vre.aston.ac.uk[/C][/ROW]
[/TABLE]
Source: https://freestatistics.org/blog/index.php?pk=90702&T=0

Globally Unique Identifier (entire table): ba.freestatistics.org/blog/index.php?pk=90702&T=0

As an alternative you can also use a QR Code:  

The GUIDs for individual cells are displayed in the table below:

Summary of computational transaction
Raw Inputview raw input (R code)
Raw Outputview raw output of R engine
Computing time3 seconds
R Server'RServer@AstonUniversity' @ vre.aston.ac.uk


ANOVA Model
Response ~ Treatment_A * Treatment_B
means0.471-0.1710.059-0.4710.1190.209

\begin{tabular}{lllllllll}
\hline
ANOVA Model \tabularnewline
Response ~ Treatment_A * Treatment_B \tabularnewline
means & 0.471 & -0.171 & 0.059 & -0.471 & 0.119 & 0.209 \tabularnewline
\hline
\end{tabular}
%Source: https://freestatistics.org/blog/index.php?pk=90702&T=1

[TABLE]
[ROW][C]ANOVA Model[/C][/ROW]
[ROW][C]Response ~ Treatment_A * Treatment_B[/C][/ROW]
[ROW][C]means[/C][C]0.471[/C][C]-0.171[/C][C]0.059[/C][C]-0.471[/C][C]0.119[/C][C]0.209[/C][/ROW]
[/TABLE]
Source: https://freestatistics.org/blog/index.php?pk=90702&T=1

Globally Unique Identifier (entire table): ba.freestatistics.org/blog/index.php?pk=90702&T=1

As an alternative you can also use a QR Code:  

The GUIDs for individual cells are displayed in the table below:

ANOVA Model
Response ~ Treatment_A * Treatment_B
means0.471-0.1710.059-0.4710.1190.209


ANOVA Statistics
DfSum SqMean SqF valuePr(>F)
1
Treatment_A10.2460.2461.280.26
Treatment_B14.7112.35512.2340
Treatment_A:Treatment_B10.2010.1010.5230.594
Residuals11121.3710.193

\begin{tabular}{lllllllll}
\hline
ANOVA Statistics \tabularnewline
  & Df & Sum Sq & Mean Sq & F value & Pr(>F) \tabularnewline
 & 1 &  &  &  &  \tabularnewline
Treatment_A & 1 & 0.246 & 0.246 & 1.28 & 0.26 \tabularnewline
Treatment_B & 1 & 4.711 & 2.355 & 12.234 & 0 \tabularnewline
Treatment_A:Treatment_B & 1 & 0.201 & 0.101 & 0.523 & 0.594 \tabularnewline
Residuals & 111 & 21.371 & 0.193 &   &   \tabularnewline
\hline
\end{tabular}
%Source: https://freestatistics.org/blog/index.php?pk=90702&T=2

[TABLE]
[ROW][C]ANOVA Statistics[/C][/ROW]
[ROW][C] [/C][C]Df[/C][C]Sum Sq[/C][C]Mean Sq[/C][C]F value[/C][C]Pr(>F)[/C][/ROW]
[ROW][C][/C][C]1[/C][C][/C][C][/C][C][/C][C][/C][/ROW]
[ROW][C]Treatment_A[/C][C]1[/C][C]0.246[/C][C]0.246[/C][C]1.28[/C][C]0.26[/C][/ROW]
[ROW][C]Treatment_B[/C][C]1[/C][C]4.711[/C][C]2.355[/C][C]12.234[/C][C]0[/C][/ROW]
[ROW][C]Treatment_A:Treatment_B[/C][C]1[/C][C]0.201[/C][C]0.101[/C][C]0.523[/C][C]0.594[/C][/ROW]
[ROW][C]Residuals[/C][C]111[/C][C]21.371[/C][C]0.193[/C][C] [/C][C] [/C][/ROW]
[/TABLE]
Source: https://freestatistics.org/blog/index.php?pk=90702&T=2

Globally Unique Identifier (entire table): ba.freestatistics.org/blog/index.php?pk=90702&T=2

As an alternative you can also use a QR Code:  

The GUIDs for individual cells are displayed in the table below:

ANOVA Statistics
DfSum SqMean SqF valuePr(>F)
1
Treatment_A10.2460.2461.280.26
Treatment_B14.7112.35512.2340
Treatment_A:Treatment_B10.2010.1010.5230.594
Residuals11121.3710.193


Tukey Honest Significant Difference Comparisons
difflwruprp adj
1-0-0.093-0.2570.070.26
F-E0.125-0.1130.3630.428
H-E-0.343-0.581-0.1050.002
H-F-0.468-0.701-0.2350
1:E-0:E-0.171-0.590.2490.846
0:F-0:E0.059-0.3780.4950.999
1:F-0:E0.008-0.3990.4151
0:H-0:E-0.471-0.93-0.0110.041
1:H-0:E-0.432-0.829-0.0350.024
0:F-1:E0.229-0.190.6490.61
1:F-1:E0.178-0.2110.5670.768
0:H-1:E-0.3-0.7430.1430.371
1:H-1:E-0.262-0.640.1170.347
1:F-0:F-0.051-0.4580.3560.999
0:H-0:F-0.529-0.989-0.070.014
1:H-0:F-0.491-0.888-0.0940.006
0:H-1:F-0.478-0.91-0.0470.021
1:H-1:F-0.44-0.804-0.0760.009
1:H-0:H0.038-0.3830.461

\begin{tabular}{lllllllll}
\hline
Tukey Honest Significant Difference Comparisons \tabularnewline
  & diff & lwr & upr & p adj \tabularnewline
1-0 & -0.093 & -0.257 & 0.07 & 0.26 \tabularnewline
F-E & 0.125 & -0.113 & 0.363 & 0.428 \tabularnewline
H-E & -0.343 & -0.581 & -0.105 & 0.002 \tabularnewline
H-F & -0.468 & -0.701 & -0.235 & 0 \tabularnewline
1:E-0:E & -0.171 & -0.59 & 0.249 & 0.846 \tabularnewline
0:F-0:E & 0.059 & -0.378 & 0.495 & 0.999 \tabularnewline
1:F-0:E & 0.008 & -0.399 & 0.415 & 1 \tabularnewline
0:H-0:E & -0.471 & -0.93 & -0.011 & 0.041 \tabularnewline
1:H-0:E & -0.432 & -0.829 & -0.035 & 0.024 \tabularnewline
0:F-1:E & 0.229 & -0.19 & 0.649 & 0.61 \tabularnewline
1:F-1:E & 0.178 & -0.211 & 0.567 & 0.768 \tabularnewline
0:H-1:E & -0.3 & -0.743 & 0.143 & 0.371 \tabularnewline
1:H-1:E & -0.262 & -0.64 & 0.117 & 0.347 \tabularnewline
1:F-0:F & -0.051 & -0.458 & 0.356 & 0.999 \tabularnewline
0:H-0:F & -0.529 & -0.989 & -0.07 & 0.014 \tabularnewline
1:H-0:F & -0.491 & -0.888 & -0.094 & 0.006 \tabularnewline
0:H-1:F & -0.478 & -0.91 & -0.047 & 0.021 \tabularnewline
1:H-1:F & -0.44 & -0.804 & -0.076 & 0.009 \tabularnewline
1:H-0:H & 0.038 & -0.383 & 0.46 & 1 \tabularnewline
\hline
\end{tabular}
%Source: https://freestatistics.org/blog/index.php?pk=90702&T=3

[TABLE]
[ROW][C]Tukey Honest Significant Difference Comparisons[/C][/ROW]
[ROW][C] [/C][C]diff[/C][C]lwr[/C][C]upr[/C][C]p adj[/C][/ROW]
[ROW][C]1-0[/C][C]-0.093[/C][C]-0.257[/C][C]0.07[/C][C]0.26[/C][/ROW]
[ROW][C]F-E[/C][C]0.125[/C][C]-0.113[/C][C]0.363[/C][C]0.428[/C][/ROW]
[ROW][C]H-E[/C][C]-0.343[/C][C]-0.581[/C][C]-0.105[/C][C]0.002[/C][/ROW]
[ROW][C]H-F[/C][C]-0.468[/C][C]-0.701[/C][C]-0.235[/C][C]0[/C][/ROW]
[ROW][C]1:E-0:E[/C][C]-0.171[/C][C]-0.59[/C][C]0.249[/C][C]0.846[/C][/ROW]
[ROW][C]0:F-0:E[/C][C]0.059[/C][C]-0.378[/C][C]0.495[/C][C]0.999[/C][/ROW]
[ROW][C]1:F-0:E[/C][C]0.008[/C][C]-0.399[/C][C]0.415[/C][C]1[/C][/ROW]
[ROW][C]0:H-0:E[/C][C]-0.471[/C][C]-0.93[/C][C]-0.011[/C][C]0.041[/C][/ROW]
[ROW][C]1:H-0:E[/C][C]-0.432[/C][C]-0.829[/C][C]-0.035[/C][C]0.024[/C][/ROW]
[ROW][C]0:F-1:E[/C][C]0.229[/C][C]-0.19[/C][C]0.649[/C][C]0.61[/C][/ROW]
[ROW][C]1:F-1:E[/C][C]0.178[/C][C]-0.211[/C][C]0.567[/C][C]0.768[/C][/ROW]
[ROW][C]0:H-1:E[/C][C]-0.3[/C][C]-0.743[/C][C]0.143[/C][C]0.371[/C][/ROW]
[ROW][C]1:H-1:E[/C][C]-0.262[/C][C]-0.64[/C][C]0.117[/C][C]0.347[/C][/ROW]
[ROW][C]1:F-0:F[/C][C]-0.051[/C][C]-0.458[/C][C]0.356[/C][C]0.999[/C][/ROW]
[ROW][C]0:H-0:F[/C][C]-0.529[/C][C]-0.989[/C][C]-0.07[/C][C]0.014[/C][/ROW]
[ROW][C]1:H-0:F[/C][C]-0.491[/C][C]-0.888[/C][C]-0.094[/C][C]0.006[/C][/ROW]
[ROW][C]0:H-1:F[/C][C]-0.478[/C][C]-0.91[/C][C]-0.047[/C][C]0.021[/C][/ROW]
[ROW][C]1:H-1:F[/C][C]-0.44[/C][C]-0.804[/C][C]-0.076[/C][C]0.009[/C][/ROW]
[ROW][C]1:H-0:H[/C][C]0.038[/C][C]-0.383[/C][C]0.46[/C][C]1[/C][/ROW]
[/TABLE]
Source: https://freestatistics.org/blog/index.php?pk=90702&T=3

Globally Unique Identifier (entire table): ba.freestatistics.org/blog/index.php?pk=90702&T=3

As an alternative you can also use a QR Code:  

The GUIDs for individual cells are displayed in the table below:

Tukey Honest Significant Difference Comparisons
difflwruprp adj
1-0-0.093-0.2570.070.26
F-E0.125-0.1130.3630.428
H-E-0.343-0.581-0.1050.002
H-F-0.468-0.701-0.2350
1:E-0:E-0.171-0.590.2490.846
0:F-0:E0.059-0.3780.4950.999
1:F-0:E0.008-0.3990.4151
0:H-0:E-0.471-0.93-0.0110.041
1:H-0:E-0.432-0.829-0.0350.024
0:F-1:E0.229-0.190.6490.61
1:F-1:E0.178-0.2110.5670.768
0:H-1:E-0.3-0.7430.1430.371
1:H-1:E-0.262-0.640.1170.347
1:F-0:F-0.051-0.4580.3560.999
0:H-0:F-0.529-0.989-0.070.014
1:H-0:F-0.491-0.888-0.0940.006
0:H-1:F-0.478-0.91-0.0470.021
1:H-1:F-0.44-0.804-0.0760.009
1:H-0:H0.038-0.3830.461


Levenes Test for Homogeneity of Variance
DfF valuePr(>F)
Group55.5040
111

\begin{tabular}{lllllllll}
\hline
Levenes Test for Homogeneity of Variance \tabularnewline
  & Df & F value & Pr(>F) \tabularnewline
Group & 5 & 5.504 & 0 \tabularnewline
  & 111 &   &   \tabularnewline
\hline
\end{tabular}
%Source: https://freestatistics.org/blog/index.php?pk=90702&T=4

[TABLE]
[ROW][C]Levenes Test for Homogeneity of Variance[/C][/ROW]
[ROW][C] [/C][C]Df[/C][C]F value[/C][C]Pr(>F)[/C][/ROW]
[ROW][C]Group[/C][C]5[/C][C]5.504[/C][C]0[/C][/ROW]
[ROW][C] [/C][C]111[/C][C] [/C][C] [/C][/ROW]
[/TABLE]
Source: https://freestatistics.org/blog/index.php?pk=90702&T=4

Globally Unique Identifier (entire table): ba.freestatistics.org/blog/index.php?pk=90702&T=4

As an alternative you can also use a QR Code:  

The GUIDs for individual cells are displayed in the table below:

Levenes Test for Homogeneity of Variance
DfF valuePr(>F)
Group55.5040
111


Parameters (Session):
par1 = 1 ; par2 = 2 ; par3 = 3 ; par4 = TRUE ;
Parameters (R input):
par1 = 1 ; par2 = 2 ; par3 = 3 ; par4 = TRUE ;
R code (references can be found in the software module):
cat1 <- as.numeric(par1) #
cat2<- as.numeric(par2) #
cat3 <- as.numeric(par3)
intercept<-as.logical(par4)
x <- t(x)
x1<-as.numeric(x[,cat1])
f1<-as.character(x[,cat2])
f2 <- as.character(x[,cat3])
xdf<-data.frame(x1,f1, f2)
(V1<-dimnames(y)[[1]][cat1])
(V2<-dimnames(y)[[1]][cat2])
(V3 <-dimnames(y)[[1]][cat3])
names(xdf)<-c('Response', 'Treatment_A', 'Treatment_B')
if(intercept == FALSE) (lmxdf<-lm(Response ~ Treatment_A * Treatment_B- 1, data = xdf) ) else (lmxdf<-lm(Response ~ Treatment_A * Treatment_B, data = xdf) )
(aov.xdf<-aov(lmxdf) )
(anova.xdf<-anova(lmxdf) )
load(file='createtable')
a<-table.start()
a<-table.row.start(a)
a<-table.element(a,'ANOVA Model', length(lmxdf$coefficients)+1,TRUE)
a<-table.row.end(a)
a<-table.row.start(a)
a<-table.element(a, lmxdf$call['formula'],length(lmxdf$coefficients)+1,TRUE)
a<-table.row.end(a)
a<-table.row.start(a)
a<-table.element(a, 'means',,TRUE)
for(i in 1:length(lmxdf$coefficients)){
a<-table.element(a, round(lmxdf$coefficients[i], digits=3),,FALSE)
}
a<-table.row.end(a)
a<-table.end(a)
table.save(a,file='mytable.tab')
a<-table.start()
a<-table.row.start(a)
a<-table.element(a,'ANOVA Statistics', 5+1,TRUE)
a<-table.row.end(a)
a<-table.row.start(a)
a<-table.element(a, ' ',,TRUE)
a<-table.element(a, 'Df',,FALSE)
a<-table.element(a, 'Sum Sq',,FALSE)
a<-table.element(a, 'Mean Sq',,FALSE)
a<-table.element(a, 'F value',,FALSE)
a<-table.element(a, 'Pr(>F)',,FALSE)
a<-table.row.end(a)
for(i in 1 : length(rownames(anova.xdf))-1){
a<-table.row.start(a)
a<-table.element(a,rownames(anova.xdf)[i] ,,TRUE)
a<-table.element(a, anova.xdf$Df[1],,FALSE)
a<-table.element(a, round(anova.xdf$'Sum Sq'[i], digits=3),,FALSE)
a<-table.element(a, round(anova.xdf$'Mean Sq'[i], digits=3),,FALSE)
a<-table.element(a, round(anova.xdf$'F value'[i], digits=3),,FALSE)
a<-table.element(a, round(anova.xdf$'Pr(>F)'[i], digits=3),,FALSE)
a<-table.row.end(a)
}
a<-table.row.start(a)
a<-table.element(a, 'Residuals',,TRUE)
a<-table.element(a, anova.xdf$'Df'[i+1],,FALSE)
a<-table.element(a, round(anova.xdf$'Sum Sq'[i+1], digits=3),,FALSE)
a<-table.element(a, round(anova.xdf$'Mean Sq'[i+1], digits=3),,FALSE)
a<-table.element(a, ' ',,FALSE)
a<-table.row.end(a)
a<-table.end(a)
table.save(a,file='mytable1.tab')
bitmap(file='anovaplot.png')
boxplot(Response ~ Treatment_A + Treatment_B, data=xdf, xlab=V2, ylab=V1, main='Boxplots of ANOVA Groups')
dev.off()
bitmap(file='designplot.png')
xdf2 <- xdf # to preserve xdf make copy for function
names(xdf2) <- c(V1, V2, V3)
plot.design(xdf2, main='Design Plot of Group Means')
dev.off()
bitmap(file='interactionplot.png')
interaction.plot(xdf$Treatment_A, xdf$Treatment_B, xdf$Response, xlab=V2, ylab=V1, trace.label=V3, main='Possible Interactions Between Anova Groups')
dev.off()
if(intercept==TRUE){
thsd<-TukeyHSD(aov.xdf)
names(thsd) <- c(V2, V3, paste(V2, ':', V3, sep=''))
bitmap(file='TukeyHSDPlot.png')
layout(matrix(c(1,2,3,3), 2,2))
plot(thsd, las=1)
dev.off()
}
if(intercept==TRUE){
ntables<-length(names(thsd))
a<-table.start()
a<-table.row.start(a)
a<-table.element(a,'Tukey Honest Significant Difference Comparisons', 5,TRUE)
a<-table.row.end(a)
a<-table.row.start(a)
a<-table.element(a, ' ', 1, TRUE)
for(i in 1:4){
a<-table.element(a,colnames(thsd[[1]])[i], 1, TRUE)
}
a<-table.row.end(a)
for(nt in 1:ntables){
for(i in 1:length(rownames(thsd[[nt]]))){
a<-table.row.start(a)
a<-table.element(a,rownames(thsd[[nt]])[i], 1, TRUE)
for(j in 1:4){
a<-table.element(a,round(thsd[[nt]][i,j], digits=3), 1, FALSE)
}
a<-table.row.end(a)
}
} # end nt
a<-table.end(a)
table.save(a,file='hsdtable.tab')
}#end if hsd tables
if(intercept==FALSE){
a<-table.start()
a<-table.row.start(a)
a<-table.element(a,'TukeyHSD Message', 1,TRUE)
a<-table.row.end(a)
a<-table.start()
a<-table.row.start(a)
a<-table.element(a,'Must Include Intercept to use Tukey Test ', 1, FALSE)
a<-table.row.end(a)
a<-table.end(a)
table.save(a,file='mytable2.tab')
}
library(car)
lt.lmxdf<-levene.test(lmxdf)
a<-table.start()
a<-table.row.start(a)
a<-table.element(a,'Levenes Test for Homogeneity of Variance', 4,TRUE)
a<-table.row.end(a)
a<-table.row.start(a)
a<-table.element(a,' ', 1, TRUE)
for (i in 1:3){
a<-table.element(a,names(lt.lmxdf)[i], 1, FALSE)
}
a<-table.row.end(a)
a<-table.row.start(a)
a<-table.element(a,'Group', 1, TRUE)
for (i in 1:3){
a<-table.element(a,round(lt.lmxdf[[i]][1], digits=3), 1, FALSE)
}
a<-table.row.end(a)
a<-table.row.start(a)
a<-table.element(a,' ', 1, TRUE)
a<-table.element(a,lt.lmxdf[[1]][2], 1, FALSE)
a<-table.element(a,' ', 1, FALSE)
a<-table.row.end(a)
a<-table.end(a)
table.save(a,file='mytable3.tab')