Free Statistics
of Irreproducible Research!
Description of Statistical Computation | ||||||||||||||||||||||||||||||
|---|---|---|---|---|---|---|---|---|---|---|---|---|---|---|---|---|---|---|---|---|---|---|---|---|---|---|---|---|---|---|
| Author's title | ||||||||||||||||||||||||||||||
| Author | *Unverified author* | |||||||||||||||||||||||||||||
| R Software Module | Ian.Hollidayrwasp_Reddy-Moores DAta.wasp | |||||||||||||||||||||||||||||
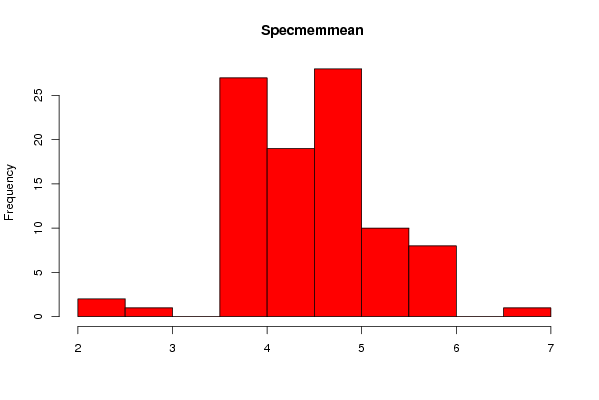
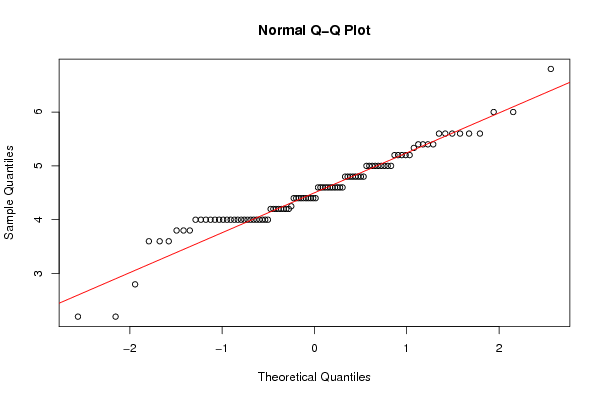
| Title produced by software | Histogram and QQPlot (Reddy-Moores Data) | |||||||||||||||||||||||||||||
| Date of computation | Mon, 01 Nov 2010 22:17:35 +0000 | |||||||||||||||||||||||||||||
| Cite this page as follows | Statistical Computations at FreeStatistics.org, Office for Research Development and Education, URL https://freestatistics.org/blog/index.php?v=date/2010/Nov/01/t1288649967u4653mdom48md91.htm/, Retrieved Mon, 29 Apr 2024 09:04:16 +0000 | |||||||||||||||||||||||||||||
| Statistical Computations at FreeStatistics.org, Office for Research Development and Education, URL https://freestatistics.org/blog/index.php?pk=91152, Retrieved Mon, 29 Apr 2024 09:04:16 +0000 | ||||||||||||||||||||||||||||||
| QR Codes: | ||||||||||||||||||||||||||||||
|
| ||||||||||||||||||||||||||||||
| Original text written by user: | ||||||||||||||||||||||||||||||
| IsPrivate? | No (this computation is public) | |||||||||||||||||||||||||||||
| User-defined keywords | ||||||||||||||||||||||||||||||
| Estimated Impact | 125 | |||||||||||||||||||||||||||||
Tree of Dependent Computations | ||||||||||||||||||||||||||||||
| Family? (F = Feedback message, R = changed R code, M = changed R Module, P = changed Parameters, D = changed Data) | ||||||||||||||||||||||||||||||
| - [Histogram and QQplot] [PY2224 Aston Work...] [2009-10-06 09:57:09] [98fd0e87c3eb04e0cc2efde01dbafab6] - P [Histogram and QQplot] [olivia friday] [2009-10-09 12:41:21] [3fdd735c61ad38cbc9b3393dc997cdb7] - RMPD [Histogram and QQplot] [Reddy Moores Hist...] [2009-10-09 13:23:16] [98fd0e87c3eb04e0cc2efde01dbafab6] - R [Histogram and QQPlot (Reddy-Moores Data)] [Reddy Moores Hist...] [2010-10-13 14:59:57] [98fd0e87c3eb04e0cc2efde01dbafab6] - D [Histogram and QQPlot (Reddy-Moores Data)] [Compmemomean] [2010-11-01 21:59:23] [d7417c1ee55adc92d15c33d2d3bf4f0d] - D [Histogram and QQPlot (Reddy-Moores Data)] [specmemmean] [2010-11-01 22:17:35] [a08017df8be4c6d954e6ccf4dbcf8c69] [Current] | ||||||||||||||||||||||||||||||
| Feedback Forum | ||||||||||||||||||||||||||||||
Post a new message | ||||||||||||||||||||||||||||||
Dataset | ||||||||||||||||||||||||||||||
| Dataseries X: | ||||||||||||||||||||||||||||||
4.6 5.6 4 5 4.4 6 4 4.4 4.6 4 4.8 5.333333333 4.4 5.2 5.2 4 5.2 4.8 4 4.4 5.6 6 4.8 4.2 4 2.8 4.8 4.2 4.8 5.2 4.6 4.4 4 3.6 4.6 4 2.2 4 5.6 3.6 4 5.4 5 4.4 4.6 3.8 4.25 4.6 5.2 4 4.2 4.2 4.6 5.6 5.4 4 3.6 4.4 4.6 4.4 4 5 4.8 4 4.6 4 5 4.2 4.8 6.8 4 4.2 5 5 4.6 4.8 5 4.2 4 4 3.8 4.6 4 4.2 5.6 4 5.6 3.8 5 5.4 5 4.4 4.4 4 5.4 2.2 | ||||||||||||||||||||||||||||||
Tables (Output of Computation) | ||||||||||||||||||||||||||||||
| ||||||||||||||||||||||||||||||
Figures (Output of Computation) | ||||||||||||||||||||||||||||||
Input Parameters & R Code | ||||||||||||||||||||||||||||||
| Parameters (Session): | ||||||||||||||||||||||||||||||
| par1 = 10 ; | ||||||||||||||||||||||||||||||
| Parameters (R input): | ||||||||||||||||||||||||||||||
| par1 = 10 ; | ||||||||||||||||||||||||||||||
| R code (references can be found in the software module): | ||||||||||||||||||||||||||||||
bitmap(file='test1.png') | ||||||||||||||||||||||||||||||