Free Statistics

of Irreproducible Research!

Author's title

Author*The author of this computation has been verified*
R Software Modulerwasp_twosampletests_mean.wasp
Title produced by softwarePaired and Unpaired Two Samples Tests about the Mean
Date of computationTue, 02 Nov 2010 19:57:40 +0000
Cite this page as followsStatistical Computations at FreeStatistics.org, Office for Research Development and Education, URL https://freestatistics.org/blog/index.php?v=date/2010/Nov/02/t1288727953oviknjgrxyr7ex2.htm/, Retrieved Sat, 27 Apr 2024 18:06:41 +0000
Statistical Computations at FreeStatistics.org, Office for Research Development and Education, URL https://freestatistics.org/blog/index.php?pk=92025, Retrieved Sat, 27 Apr 2024 18:06:41 +0000
QR Codes:

Original text written by user:
IsPrivate?No (this computation is public)
User-defined keywords
Estimated Impact160
Family? (F = Feedback message, R = changed R code, M = changed R Module, P = changed Parameters, D = changed Data)
-     [Paired and Unpaired Two Samples Tests about the Mean] [Dagelijkse omzet ...] [2010-10-25 11:22:12] [b98453cac15ba1066b407e146608df68]
-   PD  [Paired and Unpaired Two Samples Tests about the Mean] [W5 Q1] [2010-10-29 08:22:53] [56d90b683fcd93137645f9226b43c62b]
-    D    [Paired and Unpaired Two Samples Tests about the Mean] [W5 Q2] [2010-10-29 09:22:40] [56d90b683fcd93137645f9226b43c62b]
-    D      [Paired and Unpaired Two Samples Tests about the Mean] [W5 Q3] [2010-10-29 09:28:23] [56d90b683fcd93137645f9226b43c62b]
F    D        [Paired and Unpaired Two Samples Tests about the Mean] [Taak 1: Treatment E] [2010-10-29 09:44:14] [74deae64b71f9d77c839af86f7c687b5]
F R PD            [Paired and Unpaired Two Samples Tests about the Mean] [Workshop 5 opdrac...] [2010-11-02 19:57:40] [97dee3ad7274585c4a7ecb4c981cc7fb] [Current]
Feedback Forum
2010-11-07 07:51:44 [48eb36e2c01435ad7e4ea7854a9d98fe] [reply
De student heeft hier verkeerdelijk gebruik gemaakt van een T-test voor unpaired gegevens. Uit de opgave kunnen we afleiden dat de gegevens wel degelijk paired zijn, omdat het om dezelfde studenten gaat voor en na de treatment. Een voorbeeld van de T-test voor paired gegevens is hier te vinden: http://www.freestatistics.org/blog/index.php?v=date/2010/Nov/01/t1288616900dyflx4ebar1wbv4.htm/

We zien een zeer kleine P- waarde (die kleiner is dan de α – fout 0,05), dus mogen we aannemen dat we de nulhypothese kunnen verwerpen. Er is dus wel degelijk een significant verschil tussen het gemiddelde bij de post – test en het gemiddelde bij de pre – test. De E- treatment heeft dus wel degelijk effect.

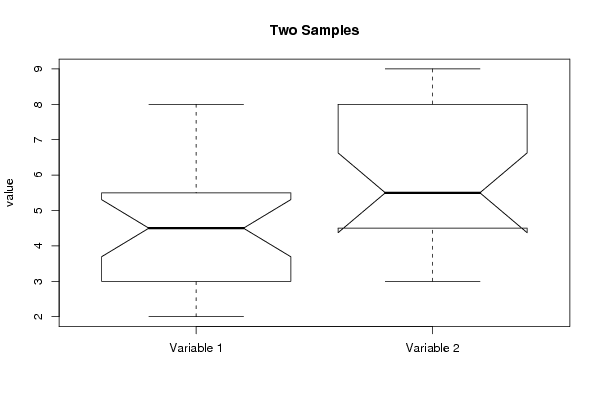
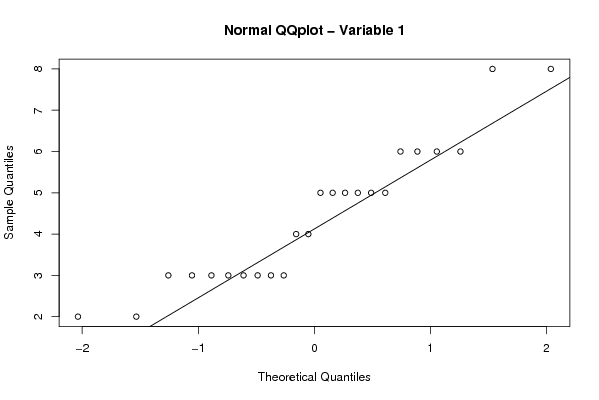
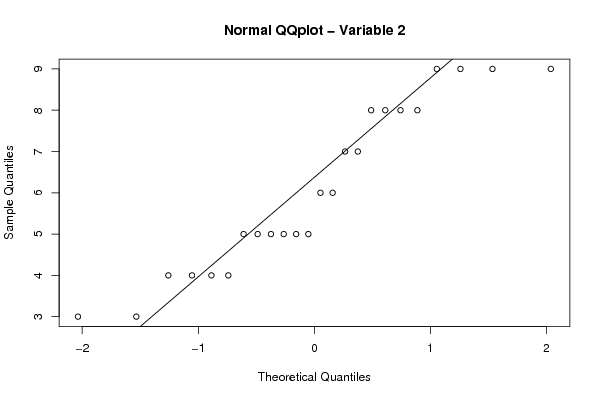
Om deze T-test te mogen gebruiken moet er bovendien voldaan zijn aan een aantal voorwaarden: Eerst en vooral dienen we na te gaan of de varianties gelijk zijn, dit kunnen we zien adhv de F- stat. Deze is 1,3 en moet zo dicht mogelijk bij 1 liggen. We zien een P-waarde die zeer groot is wat betekent dat we de nulhypothese - de varianties zijn gelijk aan elkaar - zullen aanvaarden. Een tweede belangrijke voorwaarde is dat de centrale limietstelling van toepassing moet zijn. Om dit te bepalen moet er voldaan zijn aan een aantal voorwaarden, de belangrijkste is het feit dat het moet gaan om random trekkingen, en dat is hier het geval dus kunnen we concluderen dat de CLT van toepassing is. De belangrijkste voorwaarden zijn vervuld en we mogen de T- test dus gebruiken.
2010-11-07 08:04:17 [48eb36e2c01435ad7e4ea7854a9d98fe] [reply
Daarnaast is het ook niet geheeld duidelijk welke gegevens de student precies gebruikt heeft. Om te kunnen antwoorden op de gestelde vraag dienen we de score in de kolom 'Post 1' van het excel bestand vergelijken met de score in de kolom 'pre' van datzelfde bestand.

Post a new message
Dataseries X:
3	9
5	5
6	6
3	7
2	8
6	5
8	8
5	4
3	3
3	5
4	4
5	9
3	9
5	5
6	6
3	7
2	8
6	5
8	8
5	4
3	3
3	5
4	4
5	9


Summary of computational transaction
Raw Inputview raw input (R code)
Raw Outputview raw output of R engine
Computing time2 seconds
R Server'Sir Ronald Aylmer Fisher' @ 193.190.124.24

\begin{tabular}{lllllllll}
\hline
Summary of computational transaction \tabularnewline
Raw Input & view raw input (R code)  \tabularnewline
Raw Output & view raw output of R engine  \tabularnewline
Computing time & 2 seconds \tabularnewline
R Server & 'Sir Ronald Aylmer Fisher' @ 193.190.124.24 \tabularnewline
\hline
\end{tabular}
%Source: https://freestatistics.org/blog/index.php?pk=92025&T=0

[TABLE]
[ROW][C]Summary of computational transaction[/C][/ROW]
[ROW][C]Raw Input[/C][C]view raw input (R code) [/C][/ROW]
[ROW][C]Raw Output[/C][C]view raw output of R engine [/C][/ROW]
[ROW][C]Computing time[/C][C]2 seconds[/C][/ROW]
[ROW][C]R Server[/C][C]'Sir Ronald Aylmer Fisher' @ 193.190.124.24[/C][/ROW]
[/TABLE]
Source: https://freestatistics.org/blog/index.php?pk=92025&T=0

Globally Unique Identifier (entire table): ba.freestatistics.org/blog/index.php?pk=92025&T=0

As an alternative you can also use a QR Code:  

The GUIDs for individual cells are displayed in the table below:

Summary of computational transaction
Raw Inputview raw input (R code)
Raw Outputview raw output of R engine
Computing time2 seconds
R Server'Sir Ronald Aylmer Fisher' @ 193.190.124.24


Two Sample t-test (unpaired)
Mean of Sample 14.41666666666667
Mean of Sample 26.08333333333333
t-stat-3.09892566743308
df46
p-value0.00330870756296067
H0 value0
Alternativetwo.sided
CI Level0.95
CI[-2.74924377829449,-0.584089555038837]
F-test to compare two variances
F-stat0.701598579040853
df23
p-value0.401770956469905
H0 value1
Alternativetwo.sided
CI Level0.95
CI[0.303506773926056,1.62184375572477]

\begin{tabular}{lllllllll}
\hline
Two Sample t-test (unpaired) \tabularnewline
Mean of Sample 1 & 4.41666666666667 \tabularnewline
Mean of Sample 2 & 6.08333333333333 \tabularnewline
t-stat & -3.09892566743308 \tabularnewline
df & 46 \tabularnewline
p-value & 0.00330870756296067 \tabularnewline
H0 value & 0 \tabularnewline
Alternative & two.sided \tabularnewline
CI Level & 0.95 \tabularnewline
CI & [-2.74924377829449,-0.584089555038837] \tabularnewline
F-test to compare two variances \tabularnewline
F-stat & 0.701598579040853 \tabularnewline
df & 23 \tabularnewline
p-value & 0.401770956469905 \tabularnewline
H0 value & 1 \tabularnewline
Alternative & two.sided \tabularnewline
CI Level & 0.95 \tabularnewline
CI & [0.303506773926056,1.62184375572477] \tabularnewline
\hline
\end{tabular}
%Source: https://freestatistics.org/blog/index.php?pk=92025&T=1

[TABLE]
[ROW][C]Two Sample t-test (unpaired)[/C][/ROW]
[ROW][C]Mean of Sample 1[/C][C]4.41666666666667[/C][/ROW]
[ROW][C]Mean of Sample 2[/C][C]6.08333333333333[/C][/ROW]
[ROW][C]t-stat[/C][C]-3.09892566743308[/C][/ROW]
[ROW][C]df[/C][C]46[/C][/ROW]
[ROW][C]p-value[/C][C]0.00330870756296067[/C][/ROW]
[ROW][C]H0 value[/C][C]0[/C][/ROW]
[ROW][C]Alternative[/C][C]two.sided[/C][/ROW]
[ROW][C]CI Level[/C][C]0.95[/C][/ROW]
[ROW][C]CI[/C][C][-2.74924377829449,-0.584089555038837][/C][/ROW]
[ROW][C]F-test to compare two variances[/C][/ROW]
[ROW][C]F-stat[/C][C]0.701598579040853[/C][/ROW]
[ROW][C]df[/C][C]23[/C][/ROW]
[ROW][C]p-value[/C][C]0.401770956469905[/C][/ROW]
[ROW][C]H0 value[/C][C]1[/C][/ROW]
[ROW][C]Alternative[/C][C]two.sided[/C][/ROW]
[ROW][C]CI Level[/C][C]0.95[/C][/ROW]
[ROW][C]CI[/C][C][0.303506773926056,1.62184375572477][/C][/ROW]
[/TABLE]
Source: https://freestatistics.org/blog/index.php?pk=92025&T=1

Globally Unique Identifier (entire table): ba.freestatistics.org/blog/index.php?pk=92025&T=1

As an alternative you can also use a QR Code:  

The GUIDs for individual cells are displayed in the table below:

Two Sample t-test (unpaired)
Mean of Sample 14.41666666666667
Mean of Sample 26.08333333333333
t-stat-3.09892566743308
df46
p-value0.00330870756296067
H0 value0
Alternativetwo.sided
CI Level0.95
CI[-2.74924377829449,-0.584089555038837]
F-test to compare two variances
F-stat0.701598579040853
df23
p-value0.401770956469905
H0 value1
Alternativetwo.sided
CI Level0.95
CI[0.303506773926056,1.62184375572477]


Welch Two Sample t-test (unpaired)
Mean of Sample 14.41666666666667
Mean of Sample 26.08333333333333
t-stat-3.09892566743308
df44.6275682143959
p-value0.00335690397130077
H0 value0
Alternativetwo.sided
CI Level0.95
CI[-2.75014291473209,-0.583190418601246]

\begin{tabular}{lllllllll}
\hline
Welch Two Sample t-test (unpaired) \tabularnewline
Mean of Sample 1 & 4.41666666666667 \tabularnewline
Mean of Sample 2 & 6.08333333333333 \tabularnewline
t-stat & -3.09892566743308 \tabularnewline
df & 44.6275682143959 \tabularnewline
p-value & 0.00335690397130077 \tabularnewline
H0 value & 0 \tabularnewline
Alternative & two.sided \tabularnewline
CI Level & 0.95 \tabularnewline
CI & [-2.75014291473209,-0.583190418601246] \tabularnewline
\hline
\end{tabular}
%Source: https://freestatistics.org/blog/index.php?pk=92025&T=2

[TABLE]
[ROW][C]Welch Two Sample t-test (unpaired)[/C][/ROW]
[ROW][C]Mean of Sample 1[/C][C]4.41666666666667[/C][/ROW]
[ROW][C]Mean of Sample 2[/C][C]6.08333333333333[/C][/ROW]
[ROW][C]t-stat[/C][C]-3.09892566743308[/C][/ROW]
[ROW][C]df[/C][C]44.6275682143959[/C][/ROW]
[ROW][C]p-value[/C][C]0.00335690397130077[/C][/ROW]
[ROW][C]H0 value[/C][C]0[/C][/ROW]
[ROW][C]Alternative[/C][C]two.sided[/C][/ROW]
[ROW][C]CI Level[/C][C]0.95[/C][/ROW]
[ROW][C]CI[/C][C][-2.75014291473209,-0.583190418601246][/C][/ROW]
[/TABLE]
Source: https://freestatistics.org/blog/index.php?pk=92025&T=2

Globally Unique Identifier (entire table): ba.freestatistics.org/blog/index.php?pk=92025&T=2

As an alternative you can also use a QR Code:  

The GUIDs for individual cells are displayed in the table below:

Welch Two Sample t-test (unpaired)
Mean of Sample 14.41666666666667
Mean of Sample 26.08333333333333
t-stat-3.09892566743308
df44.6275682143959
p-value0.00335690397130077
H0 value0
Alternativetwo.sided
CI Level0.95
CI[-2.75014291473209,-0.583190418601246]


Wicoxon rank sum test with continuity correction (unpaired)
W158
p-value0.00668013970063876
H0 value0
Alternativetwo.sided
Kolmogorov-Smirnov Test to compare Distributions of two Samples
KS Statistic0.333333333333333
p-value0.13892028431882
Kolmogorov-Smirnov Test to compare Distributional Shape of two Samples
KS Statistic0.25
p-value0.44130663446759

\begin{tabular}{lllllllll}
\hline
Wicoxon rank sum test with continuity correction (unpaired) \tabularnewline
W & 158 \tabularnewline
p-value & 0.00668013970063876 \tabularnewline
H0 value & 0 \tabularnewline
Alternative & two.sided \tabularnewline
Kolmogorov-Smirnov Test to compare Distributions of two Samples \tabularnewline
KS Statistic & 0.333333333333333 \tabularnewline
p-value & 0.13892028431882 \tabularnewline
Kolmogorov-Smirnov Test to compare Distributional Shape of two Samples \tabularnewline
KS Statistic & 0.25 \tabularnewline
p-value & 0.44130663446759 \tabularnewline
\hline
\end{tabular}
%Source: https://freestatistics.org/blog/index.php?pk=92025&T=3

[TABLE]
[ROW][C]Wicoxon rank sum test with continuity correction (unpaired)[/C][/ROW]
[ROW][C]W[/C][C]158[/C][/ROW]
[ROW][C]p-value[/C][C]0.00668013970063876[/C][/ROW]
[ROW][C]H0 value[/C][C]0[/C][/ROW]
[ROW][C]Alternative[/C][C]two.sided[/C][/ROW]
[ROW][C]Kolmogorov-Smirnov Test to compare Distributions of two Samples[/C][/ROW]
[ROW][C]KS Statistic[/C][C]0.333333333333333[/C][/ROW]
[ROW][C]p-value[/C][C]0.13892028431882[/C][/ROW]
[ROW][C]Kolmogorov-Smirnov Test to compare Distributional Shape of two Samples[/C][/ROW]
[ROW][C]KS Statistic[/C][C]0.25[/C][/ROW]
[ROW][C]p-value[/C][C]0.44130663446759[/C][/ROW]
[/TABLE]
Source: https://freestatistics.org/blog/index.php?pk=92025&T=3

Globally Unique Identifier (entire table): ba.freestatistics.org/blog/index.php?pk=92025&T=3

As an alternative you can also use a QR Code:  

The GUIDs for individual cells are displayed in the table below:

Wicoxon rank sum test with continuity correction (unpaired)
W158
p-value0.00668013970063876
H0 value0
Alternativetwo.sided
Kolmogorov-Smirnov Test to compare Distributions of two Samples
KS Statistic0.333333333333333
p-value0.13892028431882
Kolmogorov-Smirnov Test to compare Distributional Shape of two Samples
KS Statistic0.25
p-value0.44130663446759


Parameters (Session):
par1 = 1 ; par2 = 2 ; par3 = 0.95 ; par4 = two.sided ; par5 = unpaired ; par6 = 0 ;
Parameters (R input):
par1 = 1 ; par2 = 2 ; par3 = 0.95 ; par4 = two.sided ; par5 = unpaired ; par6 = 0 ;
R code (references can be found in the software module):
par1 <- as.numeric(par1) #column number of first sample
par2 <- as.numeric(par2) #column number of second sample
par3 <- as.numeric(par3) #confidence (= 1 - alpha)
if (par5 == 'unpaired') paired <- FALSE else paired <- TRUE
par6 <- as.numeric(par6) #H0
z <- t(y)
if (par1 == par2) stop('Please, select two different column numbers')
if (par1 < 1) stop('Please, select a column number greater than zero for the first sample')
if (par2 < 1) stop('Please, select a column number greater than zero for the second sample')
if (par1 > length(z[1,])) stop('The column number for the first sample should be smaller')
if (par2 > length(z[1,])) stop('The column number for the second sample should be smaller')
if (par3 <= 0) stop('The confidence level should be larger than zero')
if (par3 >= 1) stop('The confidence level should be smaller than zero')
(r.t <- t.test(z[,par1],z[,par2],var.equal=TRUE,alternative=par4,paired=paired,mu=par6,conf.level=par3))
(v.t <- var.test(z[,par1],z[,par2],conf.level=par3))
(r.w <- t.test(z[,par1],z[,par2],var.equal=FALSE,alternative=par4,paired=paired,mu=par6,conf.level=par3))
(w.t <- wilcox.test(z[,par1],z[,par2],alternative=par4,paired=paired,mu=par6,conf.level=par3))
(ks.t <- ks.test(z[,par1],z[,par2],alternative=par4))
m1 <- mean(z[,par1],na.rm=T)
m2 <- mean(z[,par2],na.rm=T)
mdiff <- m1 - m2
newsam1 <- z[!is.na(z[,par1]),par1]
newsam2 <- z[,par2]+mdiff
newsam2 <- newsam2[!is.na(newsam2)]
(ks1.t <- ks.test(newsam1,newsam2,alternative=par4))
mydf <- data.frame(cbind(z[,par1],z[,par2]))
colnames(mydf) <- c('Variable 1','Variable 2')
bitmap(file='test1.png')
boxplot(mydf, notch=TRUE, ylab='value',main=main)
dev.off()
bitmap(file='test2.png')
qqnorm(z[,par1],main='Normal QQplot - Variable 1')
qqline(z[,par1])
dev.off()
bitmap(file='test3.png')
qqnorm(z[,par2],main='Normal QQplot - Variable 2')
qqline(z[,par2])
dev.off()
load(file='createtable')
a<-table.start()
a<-table.row.start(a)
a<-table.element(a,paste('Two Sample t-test (',par5,')',sep=''),2,TRUE)
a<-table.row.end(a)
if(!paired){
a<-table.row.start(a)
a<-table.element(a,'Mean of Sample 1',header=TRUE)
a<-table.element(a,r.t$estimate[[1]])
a<-table.row.end(a)
a<-table.row.start(a)
a<-table.element(a,'Mean of Sample 2',header=TRUE)
a<-table.element(a,r.t$estimate[[2]])
a<-table.row.end(a)
} else {
a<-table.row.start(a)
a<-table.element(a,'Difference: Mean1 - Mean2',header=TRUE)
a<-table.element(a,r.t$estimate)
a<-table.row.end(a)
}
a<-table.row.start(a)
a<-table.element(a,'t-stat',header=TRUE)
a<-table.element(a,r.t$statistic[[1]])
a<-table.row.end(a)
a<-table.row.start(a)
a<-table.element(a,'df',header=TRUE)
a<-table.element(a,r.t$parameter[[1]])
a<-table.row.end(a)
a<-table.row.start(a)
a<-table.element(a,'p-value',header=TRUE)
a<-table.element(a,r.t$p.value)
a<-table.row.end(a)
a<-table.row.start(a)
a<-table.element(a,'H0 value',header=TRUE)
a<-table.element(a,r.t$null.value[[1]])
a<-table.row.end(a)
a<-table.row.start(a)
a<-table.element(a,'Alternative',header=TRUE)
a<-table.element(a,r.t$alternative)
a<-table.row.end(a)
a<-table.row.start(a)
a<-table.element(a,'CI Level',header=TRUE)
a<-table.element(a,attr(r.t$conf.int,'conf.level'))
a<-table.row.end(a)
a<-table.row.start(a)
a<-table.element(a,'CI',header=TRUE)
a<-table.element(a,paste('[',r.t$conf.int[1],',',r.t$conf.int[2],']',sep=''))
a<-table.row.end(a)
a<-table.row.start(a)
a<-table.element(a,'F-test to compare two variances',2,TRUE)
a<-table.row.end(a)
a<-table.row.start(a)
a<-table.element(a,'F-stat',header=TRUE)
a<-table.element(a,v.t$statistic[[1]])
a<-table.row.end(a)
a<-table.row.start(a)
a<-table.element(a,'df',header=TRUE)
a<-table.element(a,v.t$parameter[[1]])
a<-table.row.end(a)
a<-table.row.start(a)
a<-table.element(a,'p-value',header=TRUE)
a<-table.element(a,v.t$p.value)
a<-table.row.end(a)
a<-table.row.start(a)
a<-table.element(a,'H0 value',header=TRUE)
a<-table.element(a,v.t$null.value[[1]])
a<-table.row.end(a)
a<-table.row.start(a)
a<-table.element(a,'Alternative',header=TRUE)
a<-table.element(a,v.t$alternative)
a<-table.row.end(a)
a<-table.row.start(a)
a<-table.element(a,'CI Level',header=TRUE)
a<-table.element(a,attr(v.t$conf.int,'conf.level'))
a<-table.row.end(a)
a<-table.row.start(a)
a<-table.element(a,'CI',header=TRUE)
a<-table.element(a,paste('[',v.t$conf.int[1],',',v.t$conf.int[2],']',sep=''))
a<-table.row.end(a)
a<-table.end(a)
table.save(a,file='mytable.tab')
a<-table.start()
a<-table.row.start(a)
a<-table.element(a,paste('Welch Two Sample t-test (',par5,')',sep=''),2,TRUE)
a<-table.row.end(a)
if(!paired){
a<-table.row.start(a)
a<-table.element(a,'Mean of Sample 1',header=TRUE)
a<-table.element(a,r.w$estimate[[1]])
a<-table.row.end(a)
a<-table.row.start(a)
a<-table.element(a,'Mean of Sample 2',header=TRUE)
a<-table.element(a,r.w$estimate[[2]])
a<-table.row.end(a)
} else {
a<-table.row.start(a)
a<-table.element(a,'Difference: Mean1 - Mean2',header=TRUE)
a<-table.element(a,r.w$estimate)
a<-table.row.end(a)
}
a<-table.row.start(a)
a<-table.element(a,'t-stat',header=TRUE)
a<-table.element(a,r.w$statistic[[1]])
a<-table.row.end(a)
a<-table.row.start(a)
a<-table.element(a,'df',header=TRUE)
a<-table.element(a,r.w$parameter[[1]])
a<-table.row.end(a)
a<-table.row.start(a)
a<-table.element(a,'p-value',header=TRUE)
a<-table.element(a,r.w$p.value)
a<-table.row.end(a)
a<-table.row.start(a)
a<-table.element(a,'H0 value',header=TRUE)
a<-table.element(a,r.w$null.value[[1]])
a<-table.row.end(a)
a<-table.row.start(a)
a<-table.element(a,'Alternative',header=TRUE)
a<-table.element(a,r.w$alternative)
a<-table.row.end(a)
a<-table.row.start(a)
a<-table.element(a,'CI Level',header=TRUE)
a<-table.element(a,attr(r.w$conf.int,'conf.level'))
a<-table.row.end(a)
a<-table.row.start(a)
a<-table.element(a,'CI',header=TRUE)
a<-table.element(a,paste('[',r.w$conf.int[1],',',r.w$conf.int[2],']',sep=''))
a<-table.row.end(a)
a<-table.end(a)
table.save(a,file='mytable1.tab')
a<-table.start()
a<-table.row.start(a)
a<-table.element(a,paste('Wicoxon rank sum test with continuity correction (',par5,')',sep=''),2,TRUE)
a<-table.row.end(a)
a<-table.row.start(a)
a<-table.element(a,'W',header=TRUE)
a<-table.element(a,w.t$statistic[[1]])
a<-table.row.end(a)
a<-table.row.start(a)
a<-table.element(a,'p-value',header=TRUE)
a<-table.element(a,w.t$p.value)
a<-table.row.end(a)
a<-table.row.start(a)
a<-table.element(a,'H0 value',header=TRUE)
a<-table.element(a,w.t$null.value[[1]])
a<-table.row.end(a)
a<-table.row.start(a)
a<-table.element(a,'Alternative',header=TRUE)
a<-table.element(a,w.t$alternative)
a<-table.row.end(a)
a<-table.row.start(a)
a<-table.element(a,'Kolmogorov-Smirnov Test to compare Distributions of two Samples',2,TRUE)
a<-table.row.end(a)
a<-table.row.start(a)
a<-table.element(a,'KS Statistic',header=TRUE)
a<-table.element(a,ks.t$statistic[[1]])
a<-table.row.end(a)
a<-table.row.start(a)
a<-table.element(a,'p-value',header=TRUE)
a<-table.element(a,ks.t$p.value)
a<-table.row.end(a)
a<-table.row.start(a)
a<-table.element(a,'Kolmogorov-Smirnov Test to compare Distributional Shape of two Samples',2,TRUE)
a<-table.row.end(a)
a<-table.row.start(a)
a<-table.element(a,'KS Statistic',header=TRUE)
a<-table.element(a,ks1.t$statistic[[1]])
a<-table.row.end(a)
a<-table.row.start(a)
a<-table.element(a,'p-value',header=TRUE)
a<-table.element(a,ks1.t$p.value)
a<-table.row.end(a)
a<-table.end(a)
table.save(a,file='mytable2.tab')