Free Statistics

of Irreproducible Research!

Author's title

Author*The author of this computation has been verified*
R Software Modulerwasp_twosampletests_mean.wasp
Title produced by softwarePaired and Unpaired Two Samples Tests about the Mean
Date of computationTue, 02 Nov 2010 20:28:58 +0000
Cite this page as followsStatistical Computations at FreeStatistics.org, Office for Research Development and Education, URL https://freestatistics.org/blog/index.php?v=date/2010/Nov/02/t1288729804ioev2g2ewqosqcl.htm/, Retrieved Sun, 28 Apr 2024 08:22:30 +0000
Statistical Computations at FreeStatistics.org, Office for Research Development and Education, URL https://freestatistics.org/blog/index.php?pk=92047, Retrieved Sun, 28 Apr 2024 08:22:30 +0000
QR Codes:

Original text written by user:
IsPrivate?No (this computation is public)
User-defined keywords
Estimated Impact169
Family? (F = Feedback message, R = changed R code, M = changed R Module, P = changed Parameters, D = changed Data)
-     [Paired and Unpaired Two Samples Tests about the Mean] [Question 2] [2010-10-30 16:44:58] [9894f466352df31a128e82ec8d720241]
F   PD    [Paired and Unpaired Two Samples Tests about the Mean] [workshop 5 opdrac...] [2010-11-02 20:28:58] [97dee3ad7274585c4a7ecb4c981cc7fb] [Current]
Feedback Forum
2010-11-07 08:09:16 [48eb36e2c01435ad7e4ea7854a9d98fe] [reply
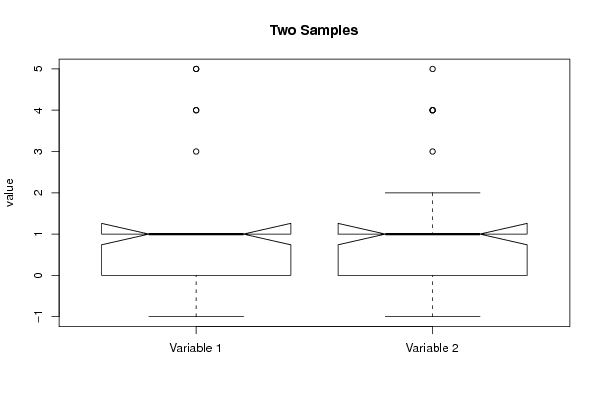
De student heeft hier opnieuw verkeerdelijk gebruik gemaakt van de 'unpaired T- test', om dezelfde reden dan bij de vragen 1 en 2 dient het ook hier een 'paired T- test' te zijn. Bovendien werden foutieve gegevens ingevuld in de software. Om een vergelijking te maken met de korte termijn dient men hier de kolommen 'Post 3' en 'Pre' in te vullen. Dit geeft dan volgend resultaat: http://www.freestatistics.org/blog/date/2010/Nov/01/t1288618123oxlax507nsphxca.htm/

Gezien de P – waarde (0,81) veel groter is dan de α – fout (0,05) kunnen we besluiten dat we de nulhypothese mogen aanvaarden. Dit kunnen we ook concluderen wanneer we naar het betrouwbaarheidsinterval kijken, de nulhypothese – 0 – valt namelijk in dit betrouwbaarheidsinterval. Dus kunnen we concluderen dat er geen significant verschil is tussen het gemiddelde van de pre – test en het gemiddelde van de post 3 – test.

Men kan daarom stellen dat de T- treatment geen invloed heeft op het resultaat van de studenten op lange termijn. Wanneer we dit vergelijken met de invloed op korte termijn, zien we dat dit dezelfde resultaten oplevert, namelijk geen invloed van de treatment.

Post a new message
Dataseries X:
4	0
0	0
5	1
0	0
0	1
0	1
0	1
1	1
5	1
1	0
4	0
1	1
3	1
1	0
0	
0	1
1	0
0	1
1	1
2	1
2	1
1	1
2	
-1	
3	1
-1	1
0	
0	
1	0
0	1
-1	0
4	0
0	1
1	
0	1
0	
4	0


Summary of computational transaction
Raw Inputview raw input (R code)
Raw Outputview raw output of R engine
Computing time1 seconds
R Server'George Udny Yule' @ 72.249.76.132

\begin{tabular}{lllllllll}
\hline
Summary of computational transaction \tabularnewline
Raw Input & view raw input (R code)  \tabularnewline
Raw Output & view raw output of R engine  \tabularnewline
Computing time & 1 seconds \tabularnewline
R Server & 'George Udny Yule' @ 72.249.76.132 \tabularnewline
\hline
\end{tabular}
%Source: https://freestatistics.org/blog/index.php?pk=92047&T=0

[TABLE]
[ROW][C]Summary of computational transaction[/C][/ROW]
[ROW][C]Raw Input[/C][C]view raw input (R code) [/C][/ROW]
[ROW][C]Raw Output[/C][C]view raw output of R engine [/C][/ROW]
[ROW][C]Computing time[/C][C]1 seconds[/C][/ROW]
[ROW][C]R Server[/C][C]'George Udny Yule' @ 72.249.76.132[/C][/ROW]
[/TABLE]
Source: https://freestatistics.org/blog/index.php?pk=92047&T=0

Globally Unique Identifier (entire table): ba.freestatistics.org/blog/index.php?pk=92047&T=0

As an alternative you can also use a QR Code:  

The GUIDs for individual cells are displayed in the table below:

Summary of computational transaction
Raw Inputview raw input (R code)
Raw Outputview raw output of R engine
Computing time1 seconds
R Server'George Udny Yule' @ 72.249.76.132


Two Sample t-test (unpaired)
Mean of Sample 10.945945945945946
Mean of Sample 21.02702702702703
t-stat-0.245861264118669
df72
p-value0.806489148789038
H0 value0
Alternativetwo.sided
CI Level0.95
CI[-0.738493226341499,0.576331064179337]
F-test to compare two variances
F-stat1.04112718964204
df36
p-value0.90442674424904
H0 value1
Alternativetwo.sided
CI Level0.95
CI[0.536078763918908,2.02198986038533]

\begin{tabular}{lllllllll}
\hline
Two Sample t-test (unpaired) \tabularnewline
Mean of Sample 1 & 0.945945945945946 \tabularnewline
Mean of Sample 2 & 1.02702702702703 \tabularnewline
t-stat & -0.245861264118669 \tabularnewline
df & 72 \tabularnewline
p-value & 0.806489148789038 \tabularnewline
H0 value & 0 \tabularnewline
Alternative & two.sided \tabularnewline
CI Level & 0.95 \tabularnewline
CI & [-0.738493226341499,0.576331064179337] \tabularnewline
F-test to compare two variances \tabularnewline
F-stat & 1.04112718964204 \tabularnewline
df & 36 \tabularnewline
p-value & 0.90442674424904 \tabularnewline
H0 value & 1 \tabularnewline
Alternative & two.sided \tabularnewline
CI Level & 0.95 \tabularnewline
CI & [0.536078763918908,2.02198986038533] \tabularnewline
\hline
\end{tabular}
%Source: https://freestatistics.org/blog/index.php?pk=92047&T=1

[TABLE]
[ROW][C]Two Sample t-test (unpaired)[/C][/ROW]
[ROW][C]Mean of Sample 1[/C][C]0.945945945945946[/C][/ROW]
[ROW][C]Mean of Sample 2[/C][C]1.02702702702703[/C][/ROW]
[ROW][C]t-stat[/C][C]-0.245861264118669[/C][/ROW]
[ROW][C]df[/C][C]72[/C][/ROW]
[ROW][C]p-value[/C][C]0.806489148789038[/C][/ROW]
[ROW][C]H0 value[/C][C]0[/C][/ROW]
[ROW][C]Alternative[/C][C]two.sided[/C][/ROW]
[ROW][C]CI Level[/C][C]0.95[/C][/ROW]
[ROW][C]CI[/C][C][-0.738493226341499,0.576331064179337][/C][/ROW]
[ROW][C]F-test to compare two variances[/C][/ROW]
[ROW][C]F-stat[/C][C]1.04112718964204[/C][/ROW]
[ROW][C]df[/C][C]36[/C][/ROW]
[ROW][C]p-value[/C][C]0.90442674424904[/C][/ROW]
[ROW][C]H0 value[/C][C]1[/C][/ROW]
[ROW][C]Alternative[/C][C]two.sided[/C][/ROW]
[ROW][C]CI Level[/C][C]0.95[/C][/ROW]
[ROW][C]CI[/C][C][0.536078763918908,2.02198986038533][/C][/ROW]
[/TABLE]
Source: https://freestatistics.org/blog/index.php?pk=92047&T=1

Globally Unique Identifier (entire table): ba.freestatistics.org/blog/index.php?pk=92047&T=1

As an alternative you can also use a QR Code:  

The GUIDs for individual cells are displayed in the table below:

Two Sample t-test (unpaired)
Mean of Sample 10.945945945945946
Mean of Sample 21.02702702702703
t-stat-0.245861264118669
df72
p-value0.806489148789038
H0 value0
Alternativetwo.sided
CI Level0.95
CI[-0.738493226341499,0.576331064179337]
F-test to compare two variances
F-stat1.04112718964204
df36
p-value0.90442674424904
H0 value1
Alternativetwo.sided
CI Level0.95
CI[0.536078763918908,2.02198986038533]


Welch Two Sample t-test (unpaired)
Mean of Sample 10.945945945945946
Mean of Sample 21.02702702702703
t-stat-0.245861264118669
df71.970780408266
p-value0.80648943225518
H0 value0
Alternativetwo.sided
CI Level0.95
CI[-0.738497786378817,0.576335624216655]

\begin{tabular}{lllllllll}
\hline
Welch Two Sample t-test (unpaired) \tabularnewline
Mean of Sample 1 & 0.945945945945946 \tabularnewline
Mean of Sample 2 & 1.02702702702703 \tabularnewline
t-stat & -0.245861264118669 \tabularnewline
df & 71.970780408266 \tabularnewline
p-value & 0.80648943225518 \tabularnewline
H0 value & 0 \tabularnewline
Alternative & two.sided \tabularnewline
CI Level & 0.95 \tabularnewline
CI & [-0.738497786378817,0.576335624216655] \tabularnewline
\hline
\end{tabular}
%Source: https://freestatistics.org/blog/index.php?pk=92047&T=2

[TABLE]
[ROW][C]Welch Two Sample t-test (unpaired)[/C][/ROW]
[ROW][C]Mean of Sample 1[/C][C]0.945945945945946[/C][/ROW]
[ROW][C]Mean of Sample 2[/C][C]1.02702702702703[/C][/ROW]
[ROW][C]t-stat[/C][C]-0.245861264118669[/C][/ROW]
[ROW][C]df[/C][C]71.970780408266[/C][/ROW]
[ROW][C]p-value[/C][C]0.80648943225518[/C][/ROW]
[ROW][C]H0 value[/C][C]0[/C][/ROW]
[ROW][C]Alternative[/C][C]two.sided[/C][/ROW]
[ROW][C]CI Level[/C][C]0.95[/C][/ROW]
[ROW][C]CI[/C][C][-0.738497786378817,0.576335624216655][/C][/ROW]
[/TABLE]
Source: https://freestatistics.org/blog/index.php?pk=92047&T=2

Globally Unique Identifier (entire table): ba.freestatistics.org/blog/index.php?pk=92047&T=2

As an alternative you can also use a QR Code:  

The GUIDs for individual cells are displayed in the table below:

Welch Two Sample t-test (unpaired)
Mean of Sample 10.945945945945946
Mean of Sample 21.02702702702703
t-stat-0.245861264118669
df71.970780408266
p-value0.80648943225518
H0 value0
Alternativetwo.sided
CI Level0.95
CI[-0.738497786378817,0.576335624216655]


Wicoxon rank sum test with continuity correction (unpaired)
W641.5
p-value0.624139827378037
H0 value0
Alternativetwo.sided
Kolmogorov-Smirnov Test to compare Distributions of two Samples
KS Statistic0.0810810810810811
p-value0.9997173782955
Kolmogorov-Smirnov Test to compare Distributional Shape of two Samples
KS Statistic0.378378378378378
p-value0.0100102046418725

\begin{tabular}{lllllllll}
\hline
Wicoxon rank sum test with continuity correction (unpaired) \tabularnewline
W & 641.5 \tabularnewline
p-value & 0.624139827378037 \tabularnewline
H0 value & 0 \tabularnewline
Alternative & two.sided \tabularnewline
Kolmogorov-Smirnov Test to compare Distributions of two Samples \tabularnewline
KS Statistic & 0.0810810810810811 \tabularnewline
p-value & 0.9997173782955 \tabularnewline
Kolmogorov-Smirnov Test to compare Distributional Shape of two Samples \tabularnewline
KS Statistic & 0.378378378378378 \tabularnewline
p-value & 0.0100102046418725 \tabularnewline
\hline
\end{tabular}
%Source: https://freestatistics.org/blog/index.php?pk=92047&T=3

[TABLE]
[ROW][C]Wicoxon rank sum test with continuity correction (unpaired)[/C][/ROW]
[ROW][C]W[/C][C]641.5[/C][/ROW]
[ROW][C]p-value[/C][C]0.624139827378037[/C][/ROW]
[ROW][C]H0 value[/C][C]0[/C][/ROW]
[ROW][C]Alternative[/C][C]two.sided[/C][/ROW]
[ROW][C]Kolmogorov-Smirnov Test to compare Distributions of two Samples[/C][/ROW]
[ROW][C]KS Statistic[/C][C]0.0810810810810811[/C][/ROW]
[ROW][C]p-value[/C][C]0.9997173782955[/C][/ROW]
[ROW][C]Kolmogorov-Smirnov Test to compare Distributional Shape of two Samples[/C][/ROW]
[ROW][C]KS Statistic[/C][C]0.378378378378378[/C][/ROW]
[ROW][C]p-value[/C][C]0.0100102046418725[/C][/ROW]
[/TABLE]
Source: https://freestatistics.org/blog/index.php?pk=92047&T=3

Globally Unique Identifier (entire table): ba.freestatistics.org/blog/index.php?pk=92047&T=3

As an alternative you can also use a QR Code:  

The GUIDs for individual cells are displayed in the table below:

Wicoxon rank sum test with continuity correction (unpaired)
W641.5
p-value0.624139827378037
H0 value0
Alternativetwo.sided
Kolmogorov-Smirnov Test to compare Distributions of two Samples
KS Statistic0.0810810810810811
p-value0.9997173782955
Kolmogorov-Smirnov Test to compare Distributional Shape of two Samples
KS Statistic0.378378378378378
p-value0.0100102046418725


Parameters (Session):
par1 = 1 ; par2 = 2 ; par3 = 0.95 ; par4 = two.sided ; par5 = unpaired ; par6 = 0 ;
Parameters (R input):
par1 = 1 ; par2 = 2 ; par3 = 0.95 ; par4 = two.sided ; par5 = unpaired ; par6 = 0 ;
R code (references can be found in the software module):
par1 <- as.numeric(par1) #column number of first sample
par2 <- as.numeric(par2) #column number of second sample
par3 <- as.numeric(par3) #confidence (= 1 - alpha)
if (par5 == 'unpaired') paired <- FALSE else paired <- TRUE
par6 <- as.numeric(par6) #H0
z <- t(y)
if (par1 == par2) stop('Please, select two different column numbers')
if (par1 < 1) stop('Please, select a column number greater than zero for the first sample')
if (par2 < 1) stop('Please, select a column number greater than zero for the second sample')
if (par1 > length(z[1,])) stop('The column number for the first sample should be smaller')
if (par2 > length(z[1,])) stop('The column number for the second sample should be smaller')
if (par3 <= 0) stop('The confidence level should be larger than zero')
if (par3 >= 1) stop('The confidence level should be smaller than zero')
(r.t <- t.test(z[,par1],z[,par2],var.equal=TRUE,alternative=par4,paired=paired,mu=par6,conf.level=par3))
(v.t <- var.test(z[,par1],z[,par2],conf.level=par3))
(r.w <- t.test(z[,par1],z[,par2],var.equal=FALSE,alternative=par4,paired=paired,mu=par6,conf.level=par3))
(w.t <- wilcox.test(z[,par1],z[,par2],alternative=par4,paired=paired,mu=par6,conf.level=par3))
(ks.t <- ks.test(z[,par1],z[,par2],alternative=par4))
m1 <- mean(z[,par1],na.rm=T)
m2 <- mean(z[,par2],na.rm=T)
mdiff <- m1 - m2
newsam1 <- z[!is.na(z[,par1]),par1]
newsam2 <- z[,par2]+mdiff
newsam2 <- newsam2[!is.na(newsam2)]
(ks1.t <- ks.test(newsam1,newsam2,alternative=par4))
mydf <- data.frame(cbind(z[,par1],z[,par2]))
colnames(mydf) <- c('Variable 1','Variable 2')
bitmap(file='test1.png')
boxplot(mydf, notch=TRUE, ylab='value',main=main)
dev.off()
bitmap(file='test2.png')
qqnorm(z[,par1],main='Normal QQplot - Variable 1')
qqline(z[,par1])
dev.off()
bitmap(file='test3.png')
qqnorm(z[,par2],main='Normal QQplot - Variable 2')
qqline(z[,par2])
dev.off()
load(file='createtable')
a<-table.start()
a<-table.row.start(a)
a<-table.element(a,paste('Two Sample t-test (',par5,')',sep=''),2,TRUE)
a<-table.row.end(a)
if(!paired){
a<-table.row.start(a)
a<-table.element(a,'Mean of Sample 1',header=TRUE)
a<-table.element(a,r.t$estimate[[1]])
a<-table.row.end(a)
a<-table.row.start(a)
a<-table.element(a,'Mean of Sample 2',header=TRUE)
a<-table.element(a,r.t$estimate[[2]])
a<-table.row.end(a)
} else {
a<-table.row.start(a)
a<-table.element(a,'Difference: Mean1 - Mean2',header=TRUE)
a<-table.element(a,r.t$estimate)
a<-table.row.end(a)
}
a<-table.row.start(a)
a<-table.element(a,'t-stat',header=TRUE)
a<-table.element(a,r.t$statistic[[1]])
a<-table.row.end(a)
a<-table.row.start(a)
a<-table.element(a,'df',header=TRUE)
a<-table.element(a,r.t$parameter[[1]])
a<-table.row.end(a)
a<-table.row.start(a)
a<-table.element(a,'p-value',header=TRUE)
a<-table.element(a,r.t$p.value)
a<-table.row.end(a)
a<-table.row.start(a)
a<-table.element(a,'H0 value',header=TRUE)
a<-table.element(a,r.t$null.value[[1]])
a<-table.row.end(a)
a<-table.row.start(a)
a<-table.element(a,'Alternative',header=TRUE)
a<-table.element(a,r.t$alternative)
a<-table.row.end(a)
a<-table.row.start(a)
a<-table.element(a,'CI Level',header=TRUE)
a<-table.element(a,attr(r.t$conf.int,'conf.level'))
a<-table.row.end(a)
a<-table.row.start(a)
a<-table.element(a,'CI',header=TRUE)
a<-table.element(a,paste('[',r.t$conf.int[1],',',r.t$conf.int[2],']',sep=''))
a<-table.row.end(a)
a<-table.row.start(a)
a<-table.element(a,'F-test to compare two variances',2,TRUE)
a<-table.row.end(a)
a<-table.row.start(a)
a<-table.element(a,'F-stat',header=TRUE)
a<-table.element(a,v.t$statistic[[1]])
a<-table.row.end(a)
a<-table.row.start(a)
a<-table.element(a,'df',header=TRUE)
a<-table.element(a,v.t$parameter[[1]])
a<-table.row.end(a)
a<-table.row.start(a)
a<-table.element(a,'p-value',header=TRUE)
a<-table.element(a,v.t$p.value)
a<-table.row.end(a)
a<-table.row.start(a)
a<-table.element(a,'H0 value',header=TRUE)
a<-table.element(a,v.t$null.value[[1]])
a<-table.row.end(a)
a<-table.row.start(a)
a<-table.element(a,'Alternative',header=TRUE)
a<-table.element(a,v.t$alternative)
a<-table.row.end(a)
a<-table.row.start(a)
a<-table.element(a,'CI Level',header=TRUE)
a<-table.element(a,attr(v.t$conf.int,'conf.level'))
a<-table.row.end(a)
a<-table.row.start(a)
a<-table.element(a,'CI',header=TRUE)
a<-table.element(a,paste('[',v.t$conf.int[1],',',v.t$conf.int[2],']',sep=''))
a<-table.row.end(a)
a<-table.end(a)
table.save(a,file='mytable.tab')
a<-table.start()
a<-table.row.start(a)
a<-table.element(a,paste('Welch Two Sample t-test (',par5,')',sep=''),2,TRUE)
a<-table.row.end(a)
if(!paired){
a<-table.row.start(a)
a<-table.element(a,'Mean of Sample 1',header=TRUE)
a<-table.element(a,r.w$estimate[[1]])
a<-table.row.end(a)
a<-table.row.start(a)
a<-table.element(a,'Mean of Sample 2',header=TRUE)
a<-table.element(a,r.w$estimate[[2]])
a<-table.row.end(a)
} else {
a<-table.row.start(a)
a<-table.element(a,'Difference: Mean1 - Mean2',header=TRUE)
a<-table.element(a,r.w$estimate)
a<-table.row.end(a)
}
a<-table.row.start(a)
a<-table.element(a,'t-stat',header=TRUE)
a<-table.element(a,r.w$statistic[[1]])
a<-table.row.end(a)
a<-table.row.start(a)
a<-table.element(a,'df',header=TRUE)
a<-table.element(a,r.w$parameter[[1]])
a<-table.row.end(a)
a<-table.row.start(a)
a<-table.element(a,'p-value',header=TRUE)
a<-table.element(a,r.w$p.value)
a<-table.row.end(a)
a<-table.row.start(a)
a<-table.element(a,'H0 value',header=TRUE)
a<-table.element(a,r.w$null.value[[1]])
a<-table.row.end(a)
a<-table.row.start(a)
a<-table.element(a,'Alternative',header=TRUE)
a<-table.element(a,r.w$alternative)
a<-table.row.end(a)
a<-table.row.start(a)
a<-table.element(a,'CI Level',header=TRUE)
a<-table.element(a,attr(r.w$conf.int,'conf.level'))
a<-table.row.end(a)
a<-table.row.start(a)
a<-table.element(a,'CI',header=TRUE)
a<-table.element(a,paste('[',r.w$conf.int[1],',',r.w$conf.int[2],']',sep=''))
a<-table.row.end(a)
a<-table.end(a)
table.save(a,file='mytable1.tab')
a<-table.start()
a<-table.row.start(a)
a<-table.element(a,paste('Wicoxon rank sum test with continuity correction (',par5,')',sep=''),2,TRUE)
a<-table.row.end(a)
a<-table.row.start(a)
a<-table.element(a,'W',header=TRUE)
a<-table.element(a,w.t$statistic[[1]])
a<-table.row.end(a)
a<-table.row.start(a)
a<-table.element(a,'p-value',header=TRUE)
a<-table.element(a,w.t$p.value)
a<-table.row.end(a)
a<-table.row.start(a)
a<-table.element(a,'H0 value',header=TRUE)
a<-table.element(a,w.t$null.value[[1]])
a<-table.row.end(a)
a<-table.row.start(a)
a<-table.element(a,'Alternative',header=TRUE)
a<-table.element(a,w.t$alternative)
a<-table.row.end(a)
a<-table.row.start(a)
a<-table.element(a,'Kolmogorov-Smirnov Test to compare Distributions of two Samples',2,TRUE)
a<-table.row.end(a)
a<-table.row.start(a)
a<-table.element(a,'KS Statistic',header=TRUE)
a<-table.element(a,ks.t$statistic[[1]])
a<-table.row.end(a)
a<-table.row.start(a)
a<-table.element(a,'p-value',header=TRUE)
a<-table.element(a,ks.t$p.value)
a<-table.row.end(a)
a<-table.row.start(a)
a<-table.element(a,'Kolmogorov-Smirnov Test to compare Distributional Shape of two Samples',2,TRUE)
a<-table.row.end(a)
a<-table.row.start(a)
a<-table.element(a,'KS Statistic',header=TRUE)
a<-table.element(a,ks1.t$statistic[[1]])
a<-table.row.end(a)
a<-table.row.start(a)
a<-table.element(a,'p-value',header=TRUE)
a<-table.element(a,ks1.t$p.value)
a<-table.row.end(a)
a<-table.end(a)
table.save(a,file='mytable2.tab')