Free Statistics

of Irreproducible Research!

Author's title

Author*The author of this computation has been verified*
R Software Modulerwasp_One Factor ANOVA.wasp
Title produced by softwareOne-Way-Between-Groups ANOVA- Free Statistics Software (Calculator)
Date of computationTue, 02 Nov 2010 20:53:17 +0000
Cite this page as followsStatistical Computations at FreeStatistics.org, Office for Research Development and Education, URL https://freestatistics.org/blog/index.php?v=date/2010/Nov/02/t1288731187iyvnxhew0a8tcor.htm/, Retrieved Sun, 28 Apr 2024 06:35:43 +0000
Statistical Computations at FreeStatistics.org, Office for Research Development and Education, URL https://freestatistics.org/blog/index.php?pk=92071, Retrieved Sun, 28 Apr 2024 06:35:43 +0000
QR Codes:

Original text written by user:
IsPrivate?No (this computation is public)
User-defined keywords
Estimated Impact161
Family? (F = Feedback message, R = changed R code, M = changed R Module, P = changed Parameters, D = changed Data)
-     [Factor Analysis] [Sleep in Mammals ...] [2010-03-21 11:39:53] [b98453cac15ba1066b407e146608df68]
- RMPD  [Testing Mean with unknown Variance - Critical Value] [Hypothesis Test a...] [2010-10-19 11:45:26] [b98453cac15ba1066b407e146608df68]
F RMPD    [Paired and Unpaired Two Samples Tests about the Mean] [Q1, W5] [2010-11-02 19:21:54] [b3140021f9a1a3896de9ecbfce0f1101]
-    D      [Paired and Unpaired Two Samples Tests about the Mean] [Q2, W5] [2010-11-02 19:28:48] [b3140021f9a1a3896de9ecbfce0f1101]
F    D        [Paired and Unpaired Two Samples Tests about the Mean] [Q3, W5] [2010-11-02 19:32:03] [b3140021f9a1a3896de9ecbfce0f1101]
F    D          [Paired and Unpaired Two Samples Tests about the Mean] [Q5 a, W5] [2010-11-02 20:03:56] [b3140021f9a1a3896de9ecbfce0f1101]
F    D            [Paired and Unpaired Two Samples Tests about the Mean] [Q5 b,W5] [2010-11-02 20:06:39] [b3140021f9a1a3896de9ecbfce0f1101]
F RM D              [One-Way-Between-Groups ANOVA- Free Statistics Software (Calculator)] [Q6, KT] [2010-11-02 20:27:53] [b3140021f9a1a3896de9ecbfce0f1101]
F    D                  [One-Way-Between-Groups ANOVA- Free Statistics Software (Calculator)] [Q7, KT] [2010-11-02 20:53:17] [0605ea080d54454c99180f574351b8e4] [Current]
Feedback Forum
2010-11-03 16:31:49 [Pascal Wijnen] [reply
De student komt tot de juiste gegevens. Er is echter geen interpretatie. Je zou kunnen zeggen: Dat hier CSWE het beste naar voren komt adh van de p-value.
2010-11-07 23:02:40 [] [reply
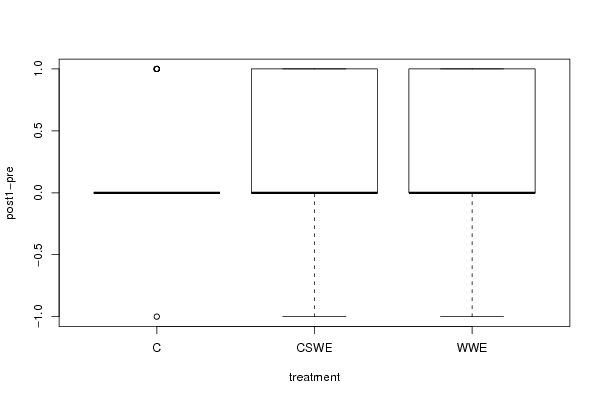
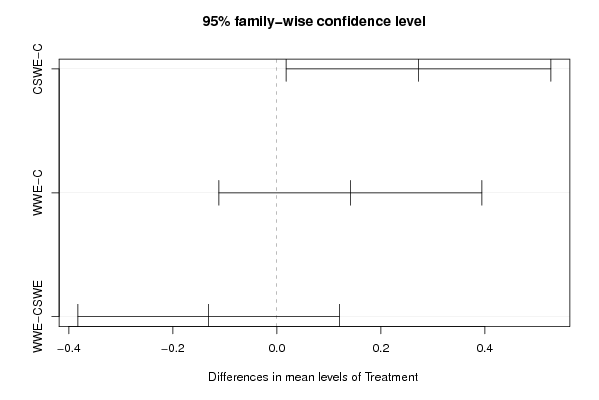
Op korte termijn bestaat er inderdaad een positief verschil tussen CSWE en C, namelijk een verschil van 0.272. Dus de Computer-Supported Worked Examples leiden tot betere resultaten op korte temijn. We mogen dit significant verschil aanvaarden omdat p zeer klein is.
Ook kan dit op lange termijn berekend worden aan de hand van de data: kolom treatment en kolom post 2 - pre. Maar bij al de 3 koppels is de p-value zeer groot. Er bestaat dus een kans dat ik me vergis bij het verwerpen van de nulhypothese als de nulhypothese waar is. Dus we moeten de nulhypothese aanvaarden en concluderen dat er op lange termijn geen significante verschillen zijn tussen de testen.

Post a new message
Dataseries X:
0	'WWE'
0	'WWE'
1	'WWE'
0	'WWE'
1	'WWE'
0	'WWE'
0	'WWE'
1	'WWE'
0	'WWE'
0	'WWE'
0	'WWE'
0	'WWE'
0	'WWE'
0	'WWE'
0	'WWE'
0	'WWE'
-1	'WWE'
0	'WWE'
0	'WWE'
1	'WWE'
0	'WWE'
0	'WWE'
0	'WWE'
1	'WWE'
1	'WWE'
1	'WWE'
0	'WWE'
0	'WWE'
1	'WWE'
1	'WWE'
0	'WWE'
1	'WWE'
1	'WWE'
0	'WWE'
0	'WWE'
0	'WWE'
0	'WWE'
0	'WWE'
0	'WWE'
0	'WWE'
0	'WWE'
0	'CSWE'
-1	'CSWE'
0	'CSWE'
1	'CSWE'
1	'CSWE'
0	'CSWE'
0	'CSWE'
0	'CSWE'
0	'CSWE'
0	'CSWE'
0	'CSWE'
1	'CSWE'
0	'CSWE'
1	'CSWE'
1	'CSWE'
1	'CSWE'
0	'CSWE'
1	'CSWE'
0	'CSWE'
1	'CSWE'
0	'CSWE'
0	'CSWE'
0	'CSWE'
1	'CSWE'
0	'CSWE'
0	'CSWE'
1	'CSWE'
1	'CSWE'
0	'CSWE'
0	'CSWE'
1	'CSWE'
1	'CSWE'
0	'CSWE'
0	'CSWE'
1	'CSWE'
0	'CSWE'
0	'CSWE'
0	'CSWE'
1	'CSWE'
1	'CSWE'
0	'C'
0	'C'
-1	'C'
0	'C'
0	'C'
0	'C'
0	'C'
1	'C'
0	'C'
0	'C'
0	'C'
1	'C'
1	'C'
0	'C'
0	'C'
0	'C'
0	'C'
0	'C'
0	'C'
1	'C'
0	'C'
1	'C'
0	'C'
0	'C'
0	'C'
0	'C'
0	'C'
0	'C'
0	'C'
0	'C'
0	'C'
0	'C'
0	'C'
0	'C'
0	'C'
0	'C'
0	'C'
0	'C'
0	'C'


Summary of computational transaction
Raw Inputview raw input (R code)
Raw Outputview raw output of R engine
Computing time21 seconds
R Server'Gwilym Jenkins' @ 72.249.127.135

\begin{tabular}{lllllllll}
\hline
Summary of computational transaction \tabularnewline
Raw Input & view raw input (R code)  \tabularnewline
Raw Output & view raw output of R engine  \tabularnewline
Computing time & 21 seconds \tabularnewline
R Server & 'Gwilym Jenkins' @ 72.249.127.135 \tabularnewline
\hline
\end{tabular}
%Source: https://freestatistics.org/blog/index.php?pk=92071&T=0

[TABLE]
[ROW][C]Summary of computational transaction[/C][/ROW]
[ROW][C]Raw Input[/C][C]view raw input (R code) [/C][/ROW]
[ROW][C]Raw Output[/C][C]view raw output of R engine [/C][/ROW]
[ROW][C]Computing time[/C][C]21 seconds[/C][/ROW]
[ROW][C]R Server[/C][C]'Gwilym Jenkins' @ 72.249.127.135[/C][/ROW]
[/TABLE]
Source: https://freestatistics.org/blog/index.php?pk=92071&T=0

Globally Unique Identifier (entire table): ba.freestatistics.org/blog/index.php?pk=92071&T=0

As an alternative you can also use a QR Code:  

The GUIDs for individual cells are displayed in the table below:

Summary of computational transaction
Raw Inputview raw input (R code)
Raw Outputview raw output of R engine
Computing time21 seconds
R Server'Gwilym Jenkins' @ 72.249.127.135


ANOVA Model
post1-pre ~ treatment
means0.1030.2720.141

\begin{tabular}{lllllllll}
\hline
ANOVA Model \tabularnewline
post1-pre  ~  treatment \tabularnewline
means & 0.103 & 0.272 & 0.141 \tabularnewline
\hline
\end{tabular}
%Source: https://freestatistics.org/blog/index.php?pk=92071&T=1

[TABLE]
[ROW][C]ANOVA Model[/C][/ROW]
[ROW][C]post1-pre  ~  treatment[/C][/ROW]
[ROW][C]means[/C][C]0.103[/C][C]0.272[/C][C]0.141[/C][/ROW]
[/TABLE]
Source: https://freestatistics.org/blog/index.php?pk=92071&T=1

Globally Unique Identifier (entire table): ba.freestatistics.org/blog/index.php?pk=92071&T=1

As an alternative you can also use a QR Code:  

The GUIDs for individual cells are displayed in the table below:

ANOVA Model
post1-pre ~ treatment
means0.1030.2720.141


ANOVA Statistics
DfSum SqMean SqF valuePr(>F)
treatment21.4660.7333.2330.043
Residuals11726.5260.227

\begin{tabular}{lllllllll}
\hline
ANOVA Statistics \tabularnewline
  & Df & Sum Sq & Mean Sq & F value & Pr(>F) \tabularnewline
treatment & 2 & 1.466 & 0.733 & 3.233 & 0.043 \tabularnewline
Residuals & 117 & 26.526 & 0.227 &   &   \tabularnewline
\hline
\end{tabular}
%Source: https://freestatistics.org/blog/index.php?pk=92071&T=2

[TABLE]
[ROW][C]ANOVA Statistics[/C][/ROW]
[ROW][C] [/C][C]Df[/C][C]Sum Sq[/C][C]Mean Sq[/C][C]F value[/C][C]Pr(>F)[/C][/ROW]
[ROW][C]treatment[/C][C]2[/C][C]1.466[/C][C]0.733[/C][C]3.233[/C][C]0.043[/C][/ROW]
[ROW][C]Residuals[/C][C]117[/C][C]26.526[/C][C]0.227[/C][C] [/C][C] [/C][/ROW]
[/TABLE]
Source: https://freestatistics.org/blog/index.php?pk=92071&T=2

Globally Unique Identifier (entire table): ba.freestatistics.org/blog/index.php?pk=92071&T=2

As an alternative you can also use a QR Code:  

The GUIDs for individual cells are displayed in the table below:

ANOVA Statistics
DfSum SqMean SqF valuePr(>F)
treatment21.4660.7333.2330.043
Residuals11726.5260.227


Tukey Honest Significant Difference Comparisons
difflwruprp adj
CSWE-C0.2720.0180.5270.033
WWE-C0.141-0.1110.3940.383
WWE-CSWE-0.131-0.3820.120.433

\begin{tabular}{lllllllll}
\hline
Tukey Honest Significant Difference Comparisons \tabularnewline
  & diff & lwr & upr & p adj \tabularnewline
CSWE-C & 0.272 & 0.018 & 0.527 & 0.033 \tabularnewline
WWE-C & 0.141 & -0.111 & 0.394 & 0.383 \tabularnewline
WWE-CSWE & -0.131 & -0.382 & 0.12 & 0.433 \tabularnewline
\hline
\end{tabular}
%Source: https://freestatistics.org/blog/index.php?pk=92071&T=3

[TABLE]
[ROW][C]Tukey Honest Significant Difference Comparisons[/C][/ROW]
[ROW][C] [/C][C]diff[/C][C]lwr[/C][C]upr[/C][C]p adj[/C][/ROW]
[ROW][C]CSWE-C[/C][C]0.272[/C][C]0.018[/C][C]0.527[/C][C]0.033[/C][/ROW]
[ROW][C]WWE-C[/C][C]0.141[/C][C]-0.111[/C][C]0.394[/C][C]0.383[/C][/ROW]
[ROW][C]WWE-CSWE[/C][C]-0.131[/C][C]-0.382[/C][C]0.12[/C][C]0.433[/C][/ROW]
[/TABLE]
Source: https://freestatistics.org/blog/index.php?pk=92071&T=3

Globally Unique Identifier (entire table): ba.freestatistics.org/blog/index.php?pk=92071&T=3

As an alternative you can also use a QR Code:  

The GUIDs for individual cells are displayed in the table below:

Tukey Honest Significant Difference Comparisons
difflwruprp adj
CSWE-C0.2720.0180.5270.033
WWE-C0.141-0.1110.3940.383
WWE-CSWE-0.131-0.3820.120.433


Levenes Test for Homogeneity of Variance
DfF valuePr(>F)
Group23.6390.029
117

\begin{tabular}{lllllllll}
\hline
Levenes Test for Homogeneity of Variance \tabularnewline
  & Df & F value & Pr(>F) \tabularnewline
Group & 2 & 3.639 & 0.029 \tabularnewline
  & 117 &   &   \tabularnewline
\hline
\end{tabular}
%Source: https://freestatistics.org/blog/index.php?pk=92071&T=4

[TABLE]
[ROW][C]Levenes Test for Homogeneity of Variance[/C][/ROW]
[ROW][C] [/C][C]Df[/C][C]F value[/C][C]Pr(>F)[/C][/ROW]
[ROW][C]Group[/C][C]2[/C][C]3.639[/C][C]0.029[/C][/ROW]
[ROW][C] [/C][C]117[/C][C] [/C][C] [/C][/ROW]
[/TABLE]
Source: https://freestatistics.org/blog/index.php?pk=92071&T=4

Globally Unique Identifier (entire table): ba.freestatistics.org/blog/index.php?pk=92071&T=4

As an alternative you can also use a QR Code:  

The GUIDs for individual cells are displayed in the table below:

Levenes Test for Homogeneity of Variance
DfF valuePr(>F)
Group23.6390.029
117


Parameters (Session):
par1 = 1 ; par2 = 2 ; par3 = 0.95 ; par4 = two.sided ; par5 = unpaired ; par6 = 0.0 ;
Parameters (R input):
par1 = 1 ; par2 = 2 ; par3 = TRUE ;
R code (references can be found in the software module):
cat1 <- as.numeric(par1) #
cat2<- as.numeric(par2) #
intercept<-as.logical(par3)
x <- t(x)
x1<-as.numeric(x[,cat1])
f1<-as.character(x[,cat2])
xdf<-data.frame(x1,f1)
(V1<-dimnames(y)[[1]][cat1])
(V2<-dimnames(y)[[1]][cat2])
names(xdf)<-c('Response', 'Treatment')
if(intercept == FALSE) (lmxdf<-lm(Response ~ Treatment - 1, data = xdf) ) else (lmxdf<-lm(Response ~ Treatment, data = xdf) )
(aov.xdf<-aov(lmxdf) )
(anova.xdf<-anova(lmxdf) )
load(file='createtable')
a<-table.start()
a<-table.row.start(a)
a<-table.element(a,'ANOVA Model', length(lmxdf$coefficients)+1,TRUE)
a<-table.row.end(a)
a<-table.row.start(a)
a<-table.element(a, paste(V1, ' ~ ', V2), length(lmxdf$coefficients)+1,TRUE)
a<-table.row.end(a)
a<-table.row.start(a)
a<-table.element(a, 'means',,TRUE)
for(i in 1:length(lmxdf$coefficients)){
a<-table.element(a, round(lmxdf$coefficients[i], digits=3),,FALSE)
}
a<-table.row.end(a)
a<-table.end(a)
table.save(a,file='mytable.tab')
a<-table.start()
a<-table.row.start(a)
a<-table.element(a,'ANOVA Statistics', 5+1,TRUE)
a<-table.row.end(a)
a<-table.row.start(a)
a<-table.element(a, ' ',,TRUE)
a<-table.element(a, 'Df',,FALSE)
a<-table.element(a, 'Sum Sq',,FALSE)
a<-table.element(a, 'Mean Sq',,FALSE)
a<-table.element(a, 'F value',,FALSE)
a<-table.element(a, 'Pr(>F)',,FALSE)
a<-table.row.end(a)
a<-table.row.start(a)
a<-table.element(a, V2,,TRUE)
a<-table.element(a, anova.xdf$Df[1],,FALSE)
a<-table.element(a, round(anova.xdf$'Sum Sq'[1], digits=3),,FALSE)
a<-table.element(a, round(anova.xdf$'Mean Sq'[1], digits=3),,FALSE)
a<-table.element(a, round(anova.xdf$'F value'[1], digits=3),,FALSE)
a<-table.element(a, round(anova.xdf$'Pr(>F)'[1], digits=3),,FALSE)
a<-table.row.end(a)
a<-table.row.start(a)
a<-table.element(a, 'Residuals',,TRUE)
a<-table.element(a, anova.xdf$Df[2],,FALSE)
a<-table.element(a, round(anova.xdf$'Sum Sq'[2], digits=3),,FALSE)
a<-table.element(a, round(anova.xdf$'Mean Sq'[2], digits=3),,FALSE)
a<-table.element(a, ' ',,FALSE)
a<-table.row.end(a)
a<-table.end(a)
table.save(a,file='mytable1.tab')
bitmap(file='anovaplot.png')
boxplot(Response ~ Treatment, data=xdf, xlab=V2, ylab=V1)
dev.off()
if(intercept==TRUE){
thsd<-TukeyHSD(aov.xdf)
bitmap(file='TukeyHSDPlot.png')
plot(thsd)
dev.off()
}
if(intercept==TRUE){
a<-table.start()
a<-table.row.start(a)
a<-table.element(a,'Tukey Honest Significant Difference Comparisons', 5,TRUE)
a<-table.row.end(a)
a<-table.row.start(a)
a<-table.element(a, ' ', 1, TRUE)
for(i in 1:4){
a<-table.element(a,colnames(thsd[[1]])[i], 1, TRUE)
}
a<-table.row.end(a)
for(i in 1:length(rownames(thsd[[1]]))){
a<-table.row.start(a)
a<-table.element(a,rownames(thsd[[1]])[i], 1, TRUE)
for(j in 1:4){
a<-table.element(a,round(thsd[[1]][i,j], digits=3), 1, FALSE)
}
a<-table.row.end(a)
}
a<-table.end(a)
table.save(a,file='mytable2.tab')
}
if(intercept==FALSE){
a<-table.start()
a<-table.row.start(a)
a<-table.element(a,'TukeyHSD Message', 1,TRUE)
a<-table.row.end(a)
a<-table.start()
a<-table.row.start(a)
a<-table.element(a,'Must Include Intercept to use Tukey Test ', 1, FALSE)
a<-table.row.end(a)
a<-table.end(a)
table.save(a,file='mytable2.tab')
}
library(car)
lt.lmxdf<-levene.test(lmxdf)
a<-table.start()
a<-table.row.start(a)
a<-table.element(a,'Levenes Test for Homogeneity of Variance', 4,TRUE)
a<-table.row.end(a)
a<-table.row.start(a)
a<-table.element(a,' ', 1, TRUE)
for (i in 1:3){
a<-table.element(a,names(lt.lmxdf)[i], 1, FALSE)
}
a<-table.row.end(a)
a<-table.row.start(a)
a<-table.element(a,'Group', 1, TRUE)
for (i in 1:3){
a<-table.element(a,round(lt.lmxdf[[i]][1], digits=3), 1, FALSE)
}
a<-table.row.end(a)
a<-table.row.start(a)
a<-table.element(a,' ', 1, TRUE)
a<-table.element(a,lt.lmxdf[[1]][2], 1, FALSE)
a<-table.element(a,' ', 1, FALSE)
a<-table.row.end(a)
a<-table.end(a)
table.save(a,file='mytable3.tab')