Free Statistics

of Irreproducible Research!

Author's title

Author*Unverified author*
R Software Modulerwasp_autocorrelation.wasp
Title produced by software(Partial) Autocorrelation Function
Date of computationMon, 15 Nov 2010 15:01:14 +0000
Cite this page as followsStatistical Computations at FreeStatistics.org, Office for Research Development and Education, URL https://freestatistics.org/blog/index.php?v=date/2010/Nov/15/t1289833399qnn2rkxzm15f6z3.htm/, Retrieved Sun, 28 Apr 2024 08:24:42 +0000
Statistical Computations at FreeStatistics.org, Office for Research Development and Education, URL https://freestatistics.org/blog/index.php?pk=94866, Retrieved Sun, 28 Apr 2024 08:24:42 +0000
QR Codes:

Original text written by user:
IsPrivate?No (this computation is public)
User-defined keywordsKDGP2W12
Estimated Impact107
Family? (F = Feedback message, R = changed R code, M = changed R Module, P = changed Parameters, D = changed Data)
-       [(Partial) Autocorrelation Function] [opdracht 6 bis 2 ...] [2010-11-15 15:01:14] [208cd78e8ef15d69f7248238ad0efe72] [Current]
Feedback Forum

Post a new message
Dataseries X:
78.1
66.7
79
65.2
66.5
77.2
80.2
77.9
78
86.8
92.9
185.8
91
79.1
84.2
70.1
71.3
79.6
92.3
78.7
82.5
98.2
115.4
205.6
94
83.2
80.3
70.4
71.1
78.8
86.3
77.5
80.1
89.8
99.9
218
85.4
77.5
78.6
68.8
64.8
79.8
94.3
79.9
87.5
99.1
109.9
273.6
91.3
80.6
80.4
71.8
75.5
86.6
91.5
86.8
84.6
88.6
102.1
260.3
79
70.6
79.3
66.8
61.2
72.5
83.5
75.8
83.4
89.4
104.9
251.6
80
76.3
81.1
63.1
63.5
78.8
91.7
83.8
83.8
95.8
108.9
258.2
88.7
79.5
74.3
70.5
59.1
73.2
81.2
75
74.6
89.5
107
246.4
83.6
72.1
68.7
60.1
61.1
72.7
85.3
71.4
75.2
89.8
100.9
222.7


Summary of computational transaction
Raw Inputview raw input (R code)
Raw Outputview raw output of R engine
Computing time1 seconds
R Server'Gwilym Jenkins' @ 72.249.127.135

\begin{tabular}{lllllllll}
\hline
Summary of computational transaction \tabularnewline
Raw Input & view raw input (R code)  \tabularnewline
Raw Output & view raw output of R engine  \tabularnewline
Computing time & 1 seconds \tabularnewline
R Server & 'Gwilym Jenkins' @ 72.249.127.135 \tabularnewline
\hline
\end{tabular}
%Source: https://freestatistics.org/blog/index.php?pk=94866&T=0

[TABLE]
[ROW][C]Summary of computational transaction[/C][/ROW]
[ROW][C]Raw Input[/C][C]view raw input (R code) [/C][/ROW]
[ROW][C]Raw Output[/C][C]view raw output of R engine [/C][/ROW]
[ROW][C]Computing time[/C][C]1 seconds[/C][/ROW]
[ROW][C]R Server[/C][C]'Gwilym Jenkins' @ 72.249.127.135[/C][/ROW]
[/TABLE]
Source: https://freestatistics.org/blog/index.php?pk=94866&T=0

Globally Unique Identifier (entire table): ba.freestatistics.org/blog/index.php?pk=94866&T=0

As an alternative you can also use a QR Code:  

The GUIDs for individual cells are displayed in the table below:

Summary of computational transaction
Raw Inputview raw input (R code)
Raw Outputview raw output of R engine
Computing time1 seconds
R Server'Gwilym Jenkins' @ 72.249.127.135


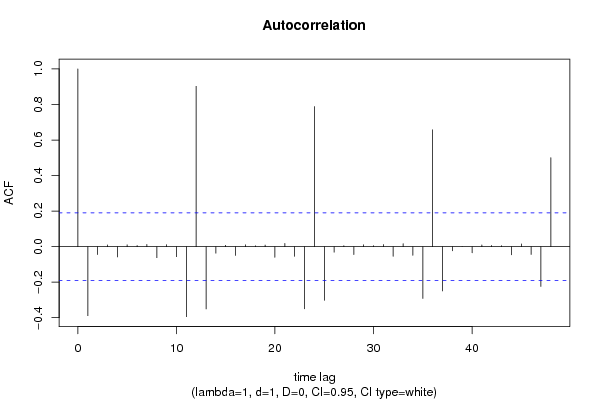
Autocorrelation Function
Time lag kACF(k)T-STATP-value
1-0.388429-4.01795.5e-05
2-0.044757-0.4630.322165
30.0095760.09910.460641
4-0.057605-0.59590.27626
50.0103130.10670.457622
60.0058330.06030.475998
70.0123980.12820.449098
8-0.061745-0.63870.262193
90.0113250.11720.45348
10-0.056611-0.58560.279692
11-0.393861-4.07414.4e-05
120.9020149.33050
13-0.350129-3.62180.000225
14-0.036828-0.38090.351999
150.0076440.07910.468564
16-0.04962-0.51330.304408
170.0100950.10440.458514
180.0048820.05050.479907
190.0086490.08950.464441
20-0.059793-0.61850.26878
210.0178090.18420.427097
22-0.054136-0.560.288329
23-0.349662-3.61690.000228
240.7882918.15410
25-0.301743-3.12130.001158
26-0.030875-0.31940.375032
270.0055860.05780.477015
28-0.044545-0.46080.322946
290.0102450.1060.457899
300.0057990.060.476139
310.0121660.12580.450046
32-0.054215-0.56080.288051
330.0169890.17570.430417
34-0.048398-0.50060.308829
35-0.291584-3.01620.001599
360.6578466.80480
37-0.249214-2.57790.00565
38-0.023276-0.24080.4051
390.0001090.00110.499552
40-0.034562-0.35750.360706
410.0099260.10270.459208
420.0066040.06830.472833
430.005730.05930.476424
44-0.045754-0.47330.318488
450.0152310.15760.437554
46-0.04349-0.44990.326858
47-0.22353-2.31220.01134
480.5007235.17951e-06

\begin{tabular}{lllllllll}
\hline
Autocorrelation Function \tabularnewline
Time lag k & ACF(k) & T-STAT & P-value \tabularnewline
1 & -0.388429 & -4.0179 & 5.5e-05 \tabularnewline
2 & -0.044757 & -0.463 & 0.322165 \tabularnewline
3 & 0.009576 & 0.0991 & 0.460641 \tabularnewline
4 & -0.057605 & -0.5959 & 0.27626 \tabularnewline
5 & 0.010313 & 0.1067 & 0.457622 \tabularnewline
6 & 0.005833 & 0.0603 & 0.475998 \tabularnewline
7 & 0.012398 & 0.1282 & 0.449098 \tabularnewline
8 & -0.061745 & -0.6387 & 0.262193 \tabularnewline
9 & 0.011325 & 0.1172 & 0.45348 \tabularnewline
10 & -0.056611 & -0.5856 & 0.279692 \tabularnewline
11 & -0.393861 & -4.0741 & 4.4e-05 \tabularnewline
12 & 0.902014 & 9.3305 & 0 \tabularnewline
13 & -0.350129 & -3.6218 & 0.000225 \tabularnewline
14 & -0.036828 & -0.3809 & 0.351999 \tabularnewline
15 & 0.007644 & 0.0791 & 0.468564 \tabularnewline
16 & -0.04962 & -0.5133 & 0.304408 \tabularnewline
17 & 0.010095 & 0.1044 & 0.458514 \tabularnewline
18 & 0.004882 & 0.0505 & 0.479907 \tabularnewline
19 & 0.008649 & 0.0895 & 0.464441 \tabularnewline
20 & -0.059793 & -0.6185 & 0.26878 \tabularnewline
21 & 0.017809 & 0.1842 & 0.427097 \tabularnewline
22 & -0.054136 & -0.56 & 0.288329 \tabularnewline
23 & -0.349662 & -3.6169 & 0.000228 \tabularnewline
24 & 0.788291 & 8.1541 & 0 \tabularnewline
25 & -0.301743 & -3.1213 & 0.001158 \tabularnewline
26 & -0.030875 & -0.3194 & 0.375032 \tabularnewline
27 & 0.005586 & 0.0578 & 0.477015 \tabularnewline
28 & -0.044545 & -0.4608 & 0.322946 \tabularnewline
29 & 0.010245 & 0.106 & 0.457899 \tabularnewline
30 & 0.005799 & 0.06 & 0.476139 \tabularnewline
31 & 0.012166 & 0.1258 & 0.450046 \tabularnewline
32 & -0.054215 & -0.5608 & 0.288051 \tabularnewline
33 & 0.016989 & 0.1757 & 0.430417 \tabularnewline
34 & -0.048398 & -0.5006 & 0.308829 \tabularnewline
35 & -0.291584 & -3.0162 & 0.001599 \tabularnewline
36 & 0.657846 & 6.8048 & 0 \tabularnewline
37 & -0.249214 & -2.5779 & 0.00565 \tabularnewline
38 & -0.023276 & -0.2408 & 0.4051 \tabularnewline
39 & 0.000109 & 0.0011 & 0.499552 \tabularnewline
40 & -0.034562 & -0.3575 & 0.360706 \tabularnewline
41 & 0.009926 & 0.1027 & 0.459208 \tabularnewline
42 & 0.006604 & 0.0683 & 0.472833 \tabularnewline
43 & 0.00573 & 0.0593 & 0.476424 \tabularnewline
44 & -0.045754 & -0.4733 & 0.318488 \tabularnewline
45 & 0.015231 & 0.1576 & 0.437554 \tabularnewline
46 & -0.04349 & -0.4499 & 0.326858 \tabularnewline
47 & -0.22353 & -2.3122 & 0.01134 \tabularnewline
48 & 0.500723 & 5.1795 & 1e-06 \tabularnewline
\hline
\end{tabular}
%Source: https://freestatistics.org/blog/index.php?pk=94866&T=1

[TABLE]
[ROW][C]Autocorrelation Function[/C][/ROW]
[ROW][C]Time lag k[/C][C]ACF(k)[/C][C]T-STAT[/C][C]P-value[/C][/ROW]
[ROW][C]1[/C][C]-0.388429[/C][C]-4.0179[/C][C]5.5e-05[/C][/ROW]
[ROW][C]2[/C][C]-0.044757[/C][C]-0.463[/C][C]0.322165[/C][/ROW]
[ROW][C]3[/C][C]0.009576[/C][C]0.0991[/C][C]0.460641[/C][/ROW]
[ROW][C]4[/C][C]-0.057605[/C][C]-0.5959[/C][C]0.27626[/C][/ROW]
[ROW][C]5[/C][C]0.010313[/C][C]0.1067[/C][C]0.457622[/C][/ROW]
[ROW][C]6[/C][C]0.005833[/C][C]0.0603[/C][C]0.475998[/C][/ROW]
[ROW][C]7[/C][C]0.012398[/C][C]0.1282[/C][C]0.449098[/C][/ROW]
[ROW][C]8[/C][C]-0.061745[/C][C]-0.6387[/C][C]0.262193[/C][/ROW]
[ROW][C]9[/C][C]0.011325[/C][C]0.1172[/C][C]0.45348[/C][/ROW]
[ROW][C]10[/C][C]-0.056611[/C][C]-0.5856[/C][C]0.279692[/C][/ROW]
[ROW][C]11[/C][C]-0.393861[/C][C]-4.0741[/C][C]4.4e-05[/C][/ROW]
[ROW][C]12[/C][C]0.902014[/C][C]9.3305[/C][C]0[/C][/ROW]
[ROW][C]13[/C][C]-0.350129[/C][C]-3.6218[/C][C]0.000225[/C][/ROW]
[ROW][C]14[/C][C]-0.036828[/C][C]-0.3809[/C][C]0.351999[/C][/ROW]
[ROW][C]15[/C][C]0.007644[/C][C]0.0791[/C][C]0.468564[/C][/ROW]
[ROW][C]16[/C][C]-0.04962[/C][C]-0.5133[/C][C]0.304408[/C][/ROW]
[ROW][C]17[/C][C]0.010095[/C][C]0.1044[/C][C]0.458514[/C][/ROW]
[ROW][C]18[/C][C]0.004882[/C][C]0.0505[/C][C]0.479907[/C][/ROW]
[ROW][C]19[/C][C]0.008649[/C][C]0.0895[/C][C]0.464441[/C][/ROW]
[ROW][C]20[/C][C]-0.059793[/C][C]-0.6185[/C][C]0.26878[/C][/ROW]
[ROW][C]21[/C][C]0.017809[/C][C]0.1842[/C][C]0.427097[/C][/ROW]
[ROW][C]22[/C][C]-0.054136[/C][C]-0.56[/C][C]0.288329[/C][/ROW]
[ROW][C]23[/C][C]-0.349662[/C][C]-3.6169[/C][C]0.000228[/C][/ROW]
[ROW][C]24[/C][C]0.788291[/C][C]8.1541[/C][C]0[/C][/ROW]
[ROW][C]25[/C][C]-0.301743[/C][C]-3.1213[/C][C]0.001158[/C][/ROW]
[ROW][C]26[/C][C]-0.030875[/C][C]-0.3194[/C][C]0.375032[/C][/ROW]
[ROW][C]27[/C][C]0.005586[/C][C]0.0578[/C][C]0.477015[/C][/ROW]
[ROW][C]28[/C][C]-0.044545[/C][C]-0.4608[/C][C]0.322946[/C][/ROW]
[ROW][C]29[/C][C]0.010245[/C][C]0.106[/C][C]0.457899[/C][/ROW]
[ROW][C]30[/C][C]0.005799[/C][C]0.06[/C][C]0.476139[/C][/ROW]
[ROW][C]31[/C][C]0.012166[/C][C]0.1258[/C][C]0.450046[/C][/ROW]
[ROW][C]32[/C][C]-0.054215[/C][C]-0.5608[/C][C]0.288051[/C][/ROW]
[ROW][C]33[/C][C]0.016989[/C][C]0.1757[/C][C]0.430417[/C][/ROW]
[ROW][C]34[/C][C]-0.048398[/C][C]-0.5006[/C][C]0.308829[/C][/ROW]
[ROW][C]35[/C][C]-0.291584[/C][C]-3.0162[/C][C]0.001599[/C][/ROW]
[ROW][C]36[/C][C]0.657846[/C][C]6.8048[/C][C]0[/C][/ROW]
[ROW][C]37[/C][C]-0.249214[/C][C]-2.5779[/C][C]0.00565[/C][/ROW]
[ROW][C]38[/C][C]-0.023276[/C][C]-0.2408[/C][C]0.4051[/C][/ROW]
[ROW][C]39[/C][C]0.000109[/C][C]0.0011[/C][C]0.499552[/C][/ROW]
[ROW][C]40[/C][C]-0.034562[/C][C]-0.3575[/C][C]0.360706[/C][/ROW]
[ROW][C]41[/C][C]0.009926[/C][C]0.1027[/C][C]0.459208[/C][/ROW]
[ROW][C]42[/C][C]0.006604[/C][C]0.0683[/C][C]0.472833[/C][/ROW]
[ROW][C]43[/C][C]0.00573[/C][C]0.0593[/C][C]0.476424[/C][/ROW]
[ROW][C]44[/C][C]-0.045754[/C][C]-0.4733[/C][C]0.318488[/C][/ROW]
[ROW][C]45[/C][C]0.015231[/C][C]0.1576[/C][C]0.437554[/C][/ROW]
[ROW][C]46[/C][C]-0.04349[/C][C]-0.4499[/C][C]0.326858[/C][/ROW]
[ROW][C]47[/C][C]-0.22353[/C][C]-2.3122[/C][C]0.01134[/C][/ROW]
[ROW][C]48[/C][C]0.500723[/C][C]5.1795[/C][C]1e-06[/C][/ROW]
[/TABLE]
Source: https://freestatistics.org/blog/index.php?pk=94866&T=1

Globally Unique Identifier (entire table): ba.freestatistics.org/blog/index.php?pk=94866&T=1

As an alternative you can also use a QR Code:  

The GUIDs for individual cells are displayed in the table below:

Autocorrelation Function
Time lag kACF(k)T-STATP-value
1-0.388429-4.01795.5e-05
2-0.044757-0.4630.322165
30.0095760.09910.460641
4-0.057605-0.59590.27626
50.0103130.10670.457622
60.0058330.06030.475998
70.0123980.12820.449098
8-0.061745-0.63870.262193
90.0113250.11720.45348
10-0.056611-0.58560.279692
11-0.393861-4.07414.4e-05
120.9020149.33050
13-0.350129-3.62180.000225
14-0.036828-0.38090.351999
150.0076440.07910.468564
16-0.04962-0.51330.304408
170.0100950.10440.458514
180.0048820.05050.479907
190.0086490.08950.464441
20-0.059793-0.61850.26878
210.0178090.18420.427097
22-0.054136-0.560.288329
23-0.349662-3.61690.000228
240.7882918.15410
25-0.301743-3.12130.001158
26-0.030875-0.31940.375032
270.0055860.05780.477015
28-0.044545-0.46080.322946
290.0102450.1060.457899
300.0057990.060.476139
310.0121660.12580.450046
32-0.054215-0.56080.288051
330.0169890.17570.430417
34-0.048398-0.50060.308829
35-0.291584-3.01620.001599
360.6578466.80480
37-0.249214-2.57790.00565
38-0.023276-0.24080.4051
390.0001090.00110.499552
40-0.034562-0.35750.360706
410.0099260.10270.459208
420.0066040.06830.472833
430.005730.05930.476424
44-0.045754-0.47330.318488
450.0152310.15760.437554
46-0.04349-0.44990.326858
47-0.22353-2.31220.01134
480.5007235.17951e-06


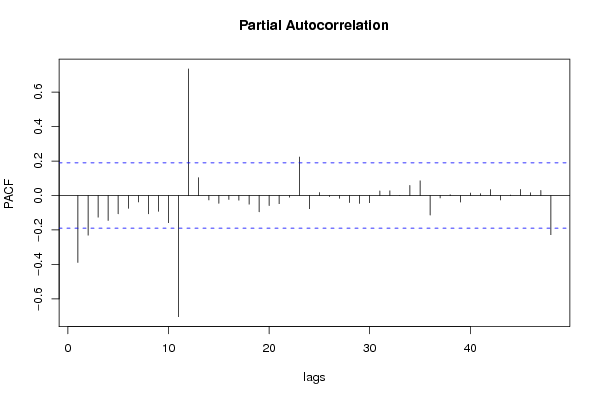
Partial Autocorrelation Function
Time lag kPACF(k)T-STATP-value
1-0.388429-4.01795.5e-05
2-0.230395-2.38320.009462
3-0.125995-1.30330.097634
4-0.144951-1.49940.06836
5-0.105836-1.09480.138037
6-0.07417-0.76720.222321
7-0.03714-0.38420.350805
8-0.106182-1.09840.137257
9-0.091608-0.94760.172733
10-0.157729-1.63160.052856
11-0.702937-7.27120
120.7345587.59830
130.1033371.06890.143755
14-0.025735-0.26620.395296
15-0.045037-0.46590.321129
16-0.022743-0.23530.407232
17-0.027141-0.28070.389723
18-0.05004-0.51760.302896
19-0.094226-0.97470.165958
20-0.057961-0.59950.275037
21-0.047498-0.49130.312102
22-0.009894-0.10230.459337
230.2229242.30590.011521
24-0.076575-0.79210.215027
250.0172890.17880.429202
26-0.006199-0.06410.474496
27-0.016534-0.1710.432262
28-0.040709-0.42110.337264
29-0.046202-0.47790.316843
30-0.041797-0.43240.333177
310.0269590.27890.390441
320.0274580.2840.38847
330.0001540.00160.499365
340.058230.60230.274113
350.0851470.88080.19021
36-0.113202-1.1710.122106
37-0.014071-0.14550.442275
380.0050590.05230.479181
39-0.037994-0.3930.347546
400.0145070.15010.4405
410.0103720.10730.457378
420.0343870.35570.361383
43-0.025414-0.26290.396572
440.0028250.02920.488373
450.0352170.36430.358182
460.0158610.16410.434992
470.0297030.30720.379626
48-0.226932-2.34740.010372

\begin{tabular}{lllllllll}
\hline
Partial Autocorrelation Function \tabularnewline
Time lag k & PACF(k) & T-STAT & P-value \tabularnewline
1 & -0.388429 & -4.0179 & 5.5e-05 \tabularnewline
2 & -0.230395 & -2.3832 & 0.009462 \tabularnewline
3 & -0.125995 & -1.3033 & 0.097634 \tabularnewline
4 & -0.144951 & -1.4994 & 0.06836 \tabularnewline
5 & -0.105836 & -1.0948 & 0.138037 \tabularnewline
6 & -0.07417 & -0.7672 & 0.222321 \tabularnewline
7 & -0.03714 & -0.3842 & 0.350805 \tabularnewline
8 & -0.106182 & -1.0984 & 0.137257 \tabularnewline
9 & -0.091608 & -0.9476 & 0.172733 \tabularnewline
10 & -0.157729 & -1.6316 & 0.052856 \tabularnewline
11 & -0.702937 & -7.2712 & 0 \tabularnewline
12 & 0.734558 & 7.5983 & 0 \tabularnewline
13 & 0.103337 & 1.0689 & 0.143755 \tabularnewline
14 & -0.025735 & -0.2662 & 0.395296 \tabularnewline
15 & -0.045037 & -0.4659 & 0.321129 \tabularnewline
16 & -0.022743 & -0.2353 & 0.407232 \tabularnewline
17 & -0.027141 & -0.2807 & 0.389723 \tabularnewline
18 & -0.05004 & -0.5176 & 0.302896 \tabularnewline
19 & -0.094226 & -0.9747 & 0.165958 \tabularnewline
20 & -0.057961 & -0.5995 & 0.275037 \tabularnewline
21 & -0.047498 & -0.4913 & 0.312102 \tabularnewline
22 & -0.009894 & -0.1023 & 0.459337 \tabularnewline
23 & 0.222924 & 2.3059 & 0.011521 \tabularnewline
24 & -0.076575 & -0.7921 & 0.215027 \tabularnewline
25 & 0.017289 & 0.1788 & 0.429202 \tabularnewline
26 & -0.006199 & -0.0641 & 0.474496 \tabularnewline
27 & -0.016534 & -0.171 & 0.432262 \tabularnewline
28 & -0.040709 & -0.4211 & 0.337264 \tabularnewline
29 & -0.046202 & -0.4779 & 0.316843 \tabularnewline
30 & -0.041797 & -0.4324 & 0.333177 \tabularnewline
31 & 0.026959 & 0.2789 & 0.390441 \tabularnewline
32 & 0.027458 & 0.284 & 0.38847 \tabularnewline
33 & 0.000154 & 0.0016 & 0.499365 \tabularnewline
34 & 0.05823 & 0.6023 & 0.274113 \tabularnewline
35 & 0.085147 & 0.8808 & 0.19021 \tabularnewline
36 & -0.113202 & -1.171 & 0.122106 \tabularnewline
37 & -0.014071 & -0.1455 & 0.442275 \tabularnewline
38 & 0.005059 & 0.0523 & 0.479181 \tabularnewline
39 & -0.037994 & -0.393 & 0.347546 \tabularnewline
40 & 0.014507 & 0.1501 & 0.4405 \tabularnewline
41 & 0.010372 & 0.1073 & 0.457378 \tabularnewline
42 & 0.034387 & 0.3557 & 0.361383 \tabularnewline
43 & -0.025414 & -0.2629 & 0.396572 \tabularnewline
44 & 0.002825 & 0.0292 & 0.488373 \tabularnewline
45 & 0.035217 & 0.3643 & 0.358182 \tabularnewline
46 & 0.015861 & 0.1641 & 0.434992 \tabularnewline
47 & 0.029703 & 0.3072 & 0.379626 \tabularnewline
48 & -0.226932 & -2.3474 & 0.010372 \tabularnewline
\hline
\end{tabular}
%Source: https://freestatistics.org/blog/index.php?pk=94866&T=2

[TABLE]
[ROW][C]Partial Autocorrelation Function[/C][/ROW]
[ROW][C]Time lag k[/C][C]PACF(k)[/C][C]T-STAT[/C][C]P-value[/C][/ROW]
[ROW][C]1[/C][C]-0.388429[/C][C]-4.0179[/C][C]5.5e-05[/C][/ROW]
[ROW][C]2[/C][C]-0.230395[/C][C]-2.3832[/C][C]0.009462[/C][/ROW]
[ROW][C]3[/C][C]-0.125995[/C][C]-1.3033[/C][C]0.097634[/C][/ROW]
[ROW][C]4[/C][C]-0.144951[/C][C]-1.4994[/C][C]0.06836[/C][/ROW]
[ROW][C]5[/C][C]-0.105836[/C][C]-1.0948[/C][C]0.138037[/C][/ROW]
[ROW][C]6[/C][C]-0.07417[/C][C]-0.7672[/C][C]0.222321[/C][/ROW]
[ROW][C]7[/C][C]-0.03714[/C][C]-0.3842[/C][C]0.350805[/C][/ROW]
[ROW][C]8[/C][C]-0.106182[/C][C]-1.0984[/C][C]0.137257[/C][/ROW]
[ROW][C]9[/C][C]-0.091608[/C][C]-0.9476[/C][C]0.172733[/C][/ROW]
[ROW][C]10[/C][C]-0.157729[/C][C]-1.6316[/C][C]0.052856[/C][/ROW]
[ROW][C]11[/C][C]-0.702937[/C][C]-7.2712[/C][C]0[/C][/ROW]
[ROW][C]12[/C][C]0.734558[/C][C]7.5983[/C][C]0[/C][/ROW]
[ROW][C]13[/C][C]0.103337[/C][C]1.0689[/C][C]0.143755[/C][/ROW]
[ROW][C]14[/C][C]-0.025735[/C][C]-0.2662[/C][C]0.395296[/C][/ROW]
[ROW][C]15[/C][C]-0.045037[/C][C]-0.4659[/C][C]0.321129[/C][/ROW]
[ROW][C]16[/C][C]-0.022743[/C][C]-0.2353[/C][C]0.407232[/C][/ROW]
[ROW][C]17[/C][C]-0.027141[/C][C]-0.2807[/C][C]0.389723[/C][/ROW]
[ROW][C]18[/C][C]-0.05004[/C][C]-0.5176[/C][C]0.302896[/C][/ROW]
[ROW][C]19[/C][C]-0.094226[/C][C]-0.9747[/C][C]0.165958[/C][/ROW]
[ROW][C]20[/C][C]-0.057961[/C][C]-0.5995[/C][C]0.275037[/C][/ROW]
[ROW][C]21[/C][C]-0.047498[/C][C]-0.4913[/C][C]0.312102[/C][/ROW]
[ROW][C]22[/C][C]-0.009894[/C][C]-0.1023[/C][C]0.459337[/C][/ROW]
[ROW][C]23[/C][C]0.222924[/C][C]2.3059[/C][C]0.011521[/C][/ROW]
[ROW][C]24[/C][C]-0.076575[/C][C]-0.7921[/C][C]0.215027[/C][/ROW]
[ROW][C]25[/C][C]0.017289[/C][C]0.1788[/C][C]0.429202[/C][/ROW]
[ROW][C]26[/C][C]-0.006199[/C][C]-0.0641[/C][C]0.474496[/C][/ROW]
[ROW][C]27[/C][C]-0.016534[/C][C]-0.171[/C][C]0.432262[/C][/ROW]
[ROW][C]28[/C][C]-0.040709[/C][C]-0.4211[/C][C]0.337264[/C][/ROW]
[ROW][C]29[/C][C]-0.046202[/C][C]-0.4779[/C][C]0.316843[/C][/ROW]
[ROW][C]30[/C][C]-0.041797[/C][C]-0.4324[/C][C]0.333177[/C][/ROW]
[ROW][C]31[/C][C]0.026959[/C][C]0.2789[/C][C]0.390441[/C][/ROW]
[ROW][C]32[/C][C]0.027458[/C][C]0.284[/C][C]0.38847[/C][/ROW]
[ROW][C]33[/C][C]0.000154[/C][C]0.0016[/C][C]0.499365[/C][/ROW]
[ROW][C]34[/C][C]0.05823[/C][C]0.6023[/C][C]0.274113[/C][/ROW]
[ROW][C]35[/C][C]0.085147[/C][C]0.8808[/C][C]0.19021[/C][/ROW]
[ROW][C]36[/C][C]-0.113202[/C][C]-1.171[/C][C]0.122106[/C][/ROW]
[ROW][C]37[/C][C]-0.014071[/C][C]-0.1455[/C][C]0.442275[/C][/ROW]
[ROW][C]38[/C][C]0.005059[/C][C]0.0523[/C][C]0.479181[/C][/ROW]
[ROW][C]39[/C][C]-0.037994[/C][C]-0.393[/C][C]0.347546[/C][/ROW]
[ROW][C]40[/C][C]0.014507[/C][C]0.1501[/C][C]0.4405[/C][/ROW]
[ROW][C]41[/C][C]0.010372[/C][C]0.1073[/C][C]0.457378[/C][/ROW]
[ROW][C]42[/C][C]0.034387[/C][C]0.3557[/C][C]0.361383[/C][/ROW]
[ROW][C]43[/C][C]-0.025414[/C][C]-0.2629[/C][C]0.396572[/C][/ROW]
[ROW][C]44[/C][C]0.002825[/C][C]0.0292[/C][C]0.488373[/C][/ROW]
[ROW][C]45[/C][C]0.035217[/C][C]0.3643[/C][C]0.358182[/C][/ROW]
[ROW][C]46[/C][C]0.015861[/C][C]0.1641[/C][C]0.434992[/C][/ROW]
[ROW][C]47[/C][C]0.029703[/C][C]0.3072[/C][C]0.379626[/C][/ROW]
[ROW][C]48[/C][C]-0.226932[/C][C]-2.3474[/C][C]0.010372[/C][/ROW]
[/TABLE]
Source: https://freestatistics.org/blog/index.php?pk=94866&T=2

Globally Unique Identifier (entire table): ba.freestatistics.org/blog/index.php?pk=94866&T=2

As an alternative you can also use a QR Code:  

The GUIDs for individual cells are displayed in the table below:

Partial Autocorrelation Function
Time lag kPACF(k)T-STATP-value
1-0.388429-4.01795.5e-05
2-0.230395-2.38320.009462
3-0.125995-1.30330.097634
4-0.144951-1.49940.06836
5-0.105836-1.09480.138037
6-0.07417-0.76720.222321
7-0.03714-0.38420.350805
8-0.106182-1.09840.137257
9-0.091608-0.94760.172733
10-0.157729-1.63160.052856
11-0.702937-7.27120
120.7345587.59830
130.1033371.06890.143755
14-0.025735-0.26620.395296
15-0.045037-0.46590.321129
16-0.022743-0.23530.407232
17-0.027141-0.28070.389723
18-0.05004-0.51760.302896
19-0.094226-0.97470.165958
20-0.057961-0.59950.275037
21-0.047498-0.49130.312102
22-0.009894-0.10230.459337
230.2229242.30590.011521
24-0.076575-0.79210.215027
250.0172890.17880.429202
26-0.006199-0.06410.474496
27-0.016534-0.1710.432262
28-0.040709-0.42110.337264
29-0.046202-0.47790.316843
30-0.041797-0.43240.333177
310.0269590.27890.390441
320.0274580.2840.38847
330.0001540.00160.499365
340.058230.60230.274113
350.0851470.88080.19021
36-0.113202-1.1710.122106
37-0.014071-0.14550.442275
380.0050590.05230.479181
39-0.037994-0.3930.347546
400.0145070.15010.4405
410.0103720.10730.457378
420.0343870.35570.361383
43-0.025414-0.26290.396572
440.0028250.02920.488373
450.0352170.36430.358182
460.0158610.16410.434992
470.0297030.30720.379626
48-0.226932-2.34740.010372


Parameters (Session):
par1 = 48 ; par2 = 1 ; par3 = 1 ; par4 = 0 ; par5 = 12 ; par6 = White Noise ; par7 = 0.95 ;
Parameters (R input):
par1 = 48 ; par2 = 1 ; par3 = 1 ; par4 = 0 ; par5 = 12 ; par6 = White Noise ; par7 = 0.95 ;
R code (references can be found in the software module):
if (par1 == 'Default') {
par1 = 10*log10(length(x))
} else {
par1 <- as.numeric(par1)
}
par2 <- as.numeric(par2)
par3 <- as.numeric(par3)
par4 <- as.numeric(par4)
par5 <- as.numeric(par5)
if (par6 == 'White Noise') par6 <- 'white' else par6 <- 'ma'
par7 <- as.numeric(par7)
if (par2 == 0) {
x <- log(x)
} else {
x <- (x ^ par2 - 1) / par2
}
if (par3 > 0) x <- diff(x,lag=1,difference=par3)
if (par4 > 0) x <- diff(x,lag=par5,difference=par4)
bitmap(file='pic1.png')
racf <- acf(x, par1, main='Autocorrelation', xlab='time lag', ylab='ACF', ci.type=par6, ci=par7, sub=paste('(lambda=',par2,', d=',par3,', D=',par4,', CI=', par7, ', CI type=',par6,')',sep=''))
dev.off()
bitmap(file='pic2.png')
rpacf <- pacf(x,par1,main='Partial Autocorrelation',xlab='lags',ylab='PACF')
dev.off()
(myacf <- c(racf$acf))
(mypacf <- c(rpacf$acf))
lengthx <- length(x)
sqrtn <- sqrt(lengthx)
load(file='createtable')
a<-table.start()
a<-table.row.start(a)
a<-table.element(a,'Autocorrelation Function',4,TRUE)
a<-table.row.end(a)
a<-table.row.start(a)
a<-table.element(a,'Time lag k',header=TRUE)
a<-table.element(a,hyperlink('basics.htm','ACF(k)','click here for more information about the Autocorrelation Function'),header=TRUE)
a<-table.element(a,'T-STAT',header=TRUE)
a<-table.element(a,'P-value',header=TRUE)
a<-table.row.end(a)
for (i in 2:(par1+1)) {
a<-table.row.start(a)
a<-table.element(a,i-1,header=TRUE)
a<-table.element(a,round(myacf[i],6))
mytstat <- myacf[i]*sqrtn
a<-table.element(a,round(mytstat,4))
a<-table.element(a,round(1-pt(abs(mytstat),lengthx),6))
a<-table.row.end(a)
}
a<-table.end(a)
table.save(a,file='mytable.tab')
a<-table.start()
a<-table.row.start(a)
a<-table.element(a,'Partial Autocorrelation Function',4,TRUE)
a<-table.row.end(a)
a<-table.row.start(a)
a<-table.element(a,'Time lag k',header=TRUE)
a<-table.element(a,hyperlink('basics.htm','PACF(k)','click here for more information about the Partial Autocorrelation Function'),header=TRUE)
a<-table.element(a,'T-STAT',header=TRUE)
a<-table.element(a,'P-value',header=TRUE)
a<-table.row.end(a)
for (i in 1:par1) {
a<-table.row.start(a)
a<-table.element(a,i,header=TRUE)
a<-table.element(a,round(mypacf[i],6))
mytstat <- mypacf[i]*sqrtn
a<-table.element(a,round(mytstat,4))
a<-table.element(a,round(1-pt(abs(mytstat),lengthx),6))
a<-table.row.end(a)
}
a<-table.end(a)
table.save(a,file='mytable1.tab')