Free Statistics
of Irreproducible Research!
Description of Statistical Computation | |||||||||||||||||||||||||||||||||||||||||||||||||||||||||||||||||||||||||||||||||||||||||||||||||||||
|---|---|---|---|---|---|---|---|---|---|---|---|---|---|---|---|---|---|---|---|---|---|---|---|---|---|---|---|---|---|---|---|---|---|---|---|---|---|---|---|---|---|---|---|---|---|---|---|---|---|---|---|---|---|---|---|---|---|---|---|---|---|---|---|---|---|---|---|---|---|---|---|---|---|---|---|---|---|---|---|---|---|---|---|---|---|---|---|---|---|---|---|---|---|---|---|---|---|---|---|---|---|
| Author's title | |||||||||||||||||||||||||||||||||||||||||||||||||||||||||||||||||||||||||||||||||||||||||||||||||||||
| Author | *The author of this computation has been verified* | ||||||||||||||||||||||||||||||||||||||||||||||||||||||||||||||||||||||||||||||||||||||||||||||||||||
| R Software Module | rwasp_chi_squared_tests.wasp | ||||||||||||||||||||||||||||||||||||||||||||||||||||||||||||||||||||||||||||||||||||||||||||||||||||
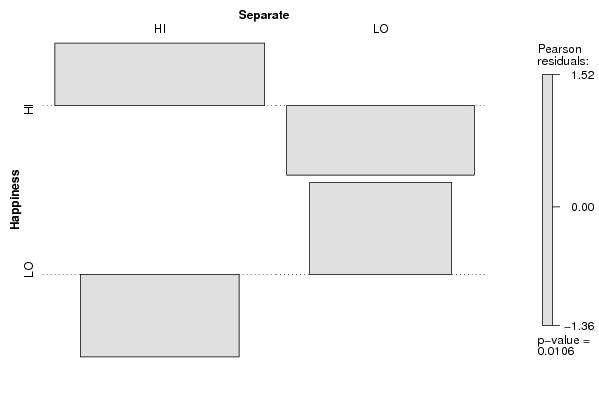
| Title produced by software | Chi-Squared and McNemar Tests | ||||||||||||||||||||||||||||||||||||||||||||||||||||||||||||||||||||||||||||||||||||||||||||||||||||
| Date of computation | Mon, 15 Nov 2010 22:47:40 +0000 | ||||||||||||||||||||||||||||||||||||||||||||||||||||||||||||||||||||||||||||||||||||||||||||||||||||
| Cite this page as follows | Statistical Computations at FreeStatistics.org, Office for Research Development and Education, URL https://freestatistics.org/blog/index.php?v=date/2010/Nov/15/t1289861194uevg744p552ilqc.htm/, Retrieved Sun, 28 Apr 2024 15:48:29 +0000 | ||||||||||||||||||||||||||||||||||||||||||||||||||||||||||||||||||||||||||||||||||||||||||||||||||||
| Statistical Computations at FreeStatistics.org, Office for Research Development and Education, URL https://freestatistics.org/blog/index.php?pk=95155, Retrieved Sun, 28 Apr 2024 15:48:29 +0000 | |||||||||||||||||||||||||||||||||||||||||||||||||||||||||||||||||||||||||||||||||||||||||||||||||||||
| QR Codes: | |||||||||||||||||||||||||||||||||||||||||||||||||||||||||||||||||||||||||||||||||||||||||||||||||||||
|
| |||||||||||||||||||||||||||||||||||||||||||||||||||||||||||||||||||||||||||||||||||||||||||||||||||||
| Original text written by user: | |||||||||||||||||||||||||||||||||||||||||||||||||||||||||||||||||||||||||||||||||||||||||||||||||||||
| IsPrivate? | No (this computation is public) | ||||||||||||||||||||||||||||||||||||||||||||||||||||||||||||||||||||||||||||||||||||||||||||||||||||
| User-defined keywords | |||||||||||||||||||||||||||||||||||||||||||||||||||||||||||||||||||||||||||||||||||||||||||||||||||||
| Estimated Impact | 174 | ||||||||||||||||||||||||||||||||||||||||||||||||||||||||||||||||||||||||||||||||||||||||||||||||||||
Tree of Dependent Computations | |||||||||||||||||||||||||||||||||||||||||||||||||||||||||||||||||||||||||||||||||||||||||||||||||||||
| Family? (F = Feedback message, R = changed R code, M = changed R Module, P = changed Parameters, D = changed Data) | |||||||||||||||||||||||||||||||||||||||||||||||||||||||||||||||||||||||||||||||||||||||||||||||||||||
| - [Linear Regression Graphical Model Validation] [Colombia Coffee -...] [2008-02-26 10:22:06] [74be16979710d4c4e7c6647856088456] F RMPD [Chi-Squared and McNemar Tests] [WS6 - Chi kwadraa...] [2010-11-07 14:14:03] [8ef49741e164ec6343c90c7935194465] F [Chi-Squared and McNemar Tests] [WS6 Chi kwadraat ...] [2010-11-15 22:47:40] [b47314d83d48c7bf812ec2bcd743b159] [Current] | |||||||||||||||||||||||||||||||||||||||||||||||||||||||||||||||||||||||||||||||||||||||||||||||||||||
| Feedback Forum | |||||||||||||||||||||||||||||||||||||||||||||||||||||||||||||||||||||||||||||||||||||||||||||||||||||
Post a new message | |||||||||||||||||||||||||||||||||||||||||||||||||||||||||||||||||||||||||||||||||||||||||||||||||||||
Dataset | |||||||||||||||||||||||||||||||||||||||||||||||||||||||||||||||||||||||||||||||||||||||||||||||||||||
| Dataseries X: | |||||||||||||||||||||||||||||||||||||||||||||||||||||||||||||||||||||||||||||||||||||||||||||||||||||
'HI' 'HI' 'HI' 'HI' 'HI' 'LO' 'HI' 'LO' 'LO' 'HI' 'LO' 'HI' 'LO' 'HI' 'LO' 'LO' 'HI' 'HI' 'HI' 'HI' 'HI' 'HI' 'HI' 'LO' 'HI' 'HI' 'HI' 'LO' 'HI' 'LO' 'HI' 'HI' 'HI' 'LO' 'HI' 'HI' 'HI' 'HI' 'HI' 'HI' 'HI' 'LO' 'HI' 'LO' 'HI' 'LO' 'HI' 'HI' 'LO' 'HI' 'HI' 'HI' 'HI' 'HI' 'HI' 'HI' 'HI' 'LO' 'LO' 'HI' 'HI' 'HI' 'LO' 'LO' 'HI' 'HI' 'HI' 'LO' 'HI' 'LO' 'HI' 'HI' 'HI' 'LO' 'HI' 'HI' 'HI' 'HI' 'LO' 'LO' 'HI' 'LO' 'LO' 'LO' 'LO' 'HI' 'LO' 'LO' 'HI' 'HI' 'HI' 'HI' 'LO' 'HI' 'HI' 'HI' 'HI' 'LO' 'HI' 'LO' 'LO' 'LO' 'HI' 'LO' 'HI' 'LO' 'HI' 'HI' 'HI' 'HI' 'LO' 'HI' 'HI' 'HI' 'LO' 'LO' 'LO' 'HI' 'HI' 'LO' 'HI' 'LO' 'LO' 'LO' 'LO' 'HI' 'LO' 'LO' 'HI' 'LO' 'HI' 'LO' 'HI' 'LO' 'HI' 'HI' 'HI' 'HI' 'HI' 'LO' 'HI' 'LO' 'LO' 'LO' 'LO' 'HI' 'LO' 'LO' 'HI' 'HI' 'HI' 'LO' 'HI' 'LO' 'LO' 'LO' 'LO' 'LO' 'HI' 'LO' 'HI' 'LO' 'HI' 'LO' 'HI' 'HI' 'HI' 'LO' 'HI' 'LO' 'HI' 'LO' 'LO' 'HI' 'HI' 'LO' 'LO' 'LO' 'HI' 'LO' 'LO' 'HI' 'HI' 'HI' 'HI' 'LO' 'HI' 'HI' 'HI' 'LO' 'LO' 'HI' 'HI' 'HI' 'HI' 'HI' 'LO' 'LO' 'HI' 'LO' 'HI' 'LO' 'LO' 'HI' 'HI' 'HI' 'LO' 'LO' 'LO' 'HI' 'LO' 'LO' 'LO' 'HI' 'HI' 'HI' 'LO' 'LO' 'LO' 'LO' 'HI' 'HI' 'HI' 'LO' 'HI' 'HI' 'HI' 'HI' 'HI' 'LO' 'LO' 'HI' 'LO' 'LO' 'HI' 'HI' 'LO' 'HI' 'HI' 'HI' 'LO' 'HI' 'LO' 'LO' 'LO' 'HI' 'HI' 'HI' 'LO' 'HI' 'HI' 'HI' 'HI' 'HI' 'LO' 'HI' 'HI' 'HI' 'HI' 'LO' 'LO' 'LO' 'HI' 'HI' 'LO' 'HI' 'HI' 'HI' 'LO' 'HI' 'LO' 'LO' 'HI' 'HI' 'HI' 'HI' 'HI' 'HI' 'HI' 'HI' 'HI' 'HI' 'HI' 'HI' 'HI' 'HI' 'LO' 'HI' 'HI' 'HI' 'HI' 'HI' 'HI' 'LO' 'HI' 'HI' 'LO' 'LO' 'HI' 'LO' 'LO' 'HI' 'HI' 'LO' 'HI' 'HI' 'HI' 'HI' 'LO' 'HI' 'HI' 'LO' 'HI' 'HI' 'LO' 'LO' 'LO' 'LO' 'HI' 'LO' 'HI' 'LO' 'LO' 'HI' 'HI' 'LO' 'HI' 'HI' 'HI' 'LO' 'HI' 'HI' 'HI' 'HI' 'HI' 'LO' 'HI' 'HI' 'LO' 'HI' 'HI' 'HI' 'LO' 'LO' 'HI' 'HI' 'HI' 'HI' 'HI' 'HI' 'LO' 'HI' 'LO' 'HI' 'LO' 'LO' 'LO' 'HI' 'LO' 'LO' 'HI' 'HI' 'LO' 'HI' 'LO' 'HI' 'HI' 'LO' 'HI' 'HI' 'HI' 'HI' 'HI' 'HI' 'LO' 'LO' 'LO' 'LO' 'LO' 'LO' 'HI' 'LO' 'HI' 'HI' 'LO' 'HI' 'HI' 'HI' 'HI' 'LO' 'HI' 'LO' 'HI' 'LO' 'HI' 'HI' 'HI' 'LO' 'LO' 'HI' 'HI' 'LO' 'HI' 'HI' 'LO' 'HI' 'HI' 'HI' 'HI' 'HI' 'HI' 'HI' 'LO' 'LO' 'LO' 'LO' 'HI' 'HI' 'LO' 'HI' 'LO' 'HI' 'HI' 'LO' 'HI' 'LO' 'HI' 'HI' 'HI' 'HI' 'HI' 'HI' 'LO' 'HI' 'HI' 'HI' 'LO' 'HI' 'HI' 'HI' 'HI' 'HI' 'LO' 'HI' 'LO' 'HI' 'LO' 'LO' 'LO' 'LO' 'LO' 'HI' 'HI' 'HI' 'LO' 'LO' 'HI' 'HI' 'HI' 'HI' 'HI' 'LO' 'HI' 'LO' 'HI' 'HI' 'LO' 'HI' 'HI' 'HI' 'HI' 'HI' 'HI' 'LO' 'LO' 'HI' 'HI' 'HI' 'HI' 'HI' 'LO' 'HI' 'LO' 'HI' 'HI' 'HI' 'LO' 'LO' 'HI' 'LO' 'HI' 'HI' 'HI' 'LO' 'HI' 'HI' 'HI' 'LO' 'LO' 'LO' 'LO' 'LO' 'LO' 'LO' 'HI' 'LO' 'HI' 'LO' 'HI' 'LO' 'HI' 'HI' 'HI' 'LO' 'LO' 'HI' 'HI' 'HI' 'HI' 'LO' 'LO' 'LO' 'LO' 'LO' 'LO' 'HI' 'LO' 'LO' 'HI' 'LO' 'HI' 'HI' 'HI' 'HI' 'LO' 'LO' 'HI' 'HI' 'HI' 'HI' 'HI' 'HI' 'LO' 'LO' 'LO' 'HI' 'LO' 'LO' 'HI' 'HI' 'HI' 'HI' 'LO' 'HI' 'LO' 'HI' 'HI' 'LO' 'HI' 'HI' 'LO' 'HI' 'LO' 'HI' 'HI' 'LO' 'LO' 'HI' 'HI' 'HI' 'LO' 'HI' 'HI' 'HI' 'LO' 'HI' 'HI' 'HI' 'LO' 'LO' 'HI' 'LO' 'HI' 'LO' 'HI' 'HI' 'LO' 'LO' 'LO' 'HI' 'HI' 'HI' 'LO' 'LO' 'LO' 'LO' 'LO' 'HI' 'HI' 'LO' 'HI' 'HI' 'HI' 'HI' 'LO' 'HI' 'HI' 'HI' 'HI' 'LO' 'HI' 'HI' 'LO' 'HI' 'HI' 'HI' 'LO' 'HI' 'HI' 'HI' 'LO' 'HI' 'LO' 'LO' 'LO' 'HI' 'HI' 'LO' 'HI' 'HI' 'LO' 'HI' 'HI' 'LO' 'LO' 'HI' 'LO' 'LO' 'HI' 'LO' 'LO' 'HI' 'LO' 'HI' 'LO' 'HI' 'HI' 'HI' | |||||||||||||||||||||||||||||||||||||||||||||||||||||||||||||||||||||||||||||||||||||||||||||||||||||
Tables (Output of Computation) | |||||||||||||||||||||||||||||||||||||||||||||||||||||||||||||||||||||||||||||||||||||||||||||||||||||
| |||||||||||||||||||||||||||||||||||||||||||||||||||||||||||||||||||||||||||||||||||||||||||||||||||||
Figures (Output of Computation) | |||||||||||||||||||||||||||||||||||||||||||||||||||||||||||||||||||||||||||||||||||||||||||||||||||||
Input Parameters & R Code | |||||||||||||||||||||||||||||||||||||||||||||||||||||||||||||||||||||||||||||||||||||||||||||||||||||
| Parameters (Session): | |||||||||||||||||||||||||||||||||||||||||||||||||||||||||||||||||||||||||||||||||||||||||||||||||||||
| par1 = 1 ; par2 = 4 ; par3 = Pearson Chi-Squared ; | |||||||||||||||||||||||||||||||||||||||||||||||||||||||||||||||||||||||||||||||||||||||||||||||||||||
| Parameters (R input): | |||||||||||||||||||||||||||||||||||||||||||||||||||||||||||||||||||||||||||||||||||||||||||||||||||||
| par1 = 1 ; par2 = 4 ; par3 = Pearson Chi-Squared ; | |||||||||||||||||||||||||||||||||||||||||||||||||||||||||||||||||||||||||||||||||||||||||||||||||||||
| R code (references can be found in the software module): | |||||||||||||||||||||||||||||||||||||||||||||||||||||||||||||||||||||||||||||||||||||||||||||||||||||
library(vcd) | |||||||||||||||||||||||||||||||||||||||||||||||||||||||||||||||||||||||||||||||||||||||||||||||||||||