Free Statistics

of Irreproducible Research!

Author's title

Author*The author of this computation has been verified*
R Software Modulerwasp_multipleregression.wasp
Title produced by softwareMultiple Regression
Date of computationSat, 20 Nov 2010 10:15:55 +0000
Cite this page as followsStatistical Computations at FreeStatistics.org, Office for Research Development and Education, URL https://freestatistics.org/blog/index.php?v=date/2010/Nov/20/t12902485127gclo209yhacmkf.htm/, Retrieved Sat, 27 Apr 2024 17:57:57 +0000
Statistical Computations at FreeStatistics.org, Office for Research Development and Education, URL https://freestatistics.org/blog/index.php?pk=98171, Retrieved Sat, 27 Apr 2024 17:57:57 +0000
QR Codes:

Original text written by user:
IsPrivate?No (this computation is public)
User-defined keywords
Estimated Impact169
Family? (F = Feedback message, R = changed R code, M = changed R Module, P = changed Parameters, D = changed Data)
-     [Multiple Regression] [Competence to learn] [2010-11-17 07:43:53] [b98453cac15ba1066b407e146608df68]
-   PD  [Multiple Regression] [Meervoudige regre...] [2010-11-19 12:47:27] [2960375a246cc0628590c95c4038a43c]
-    D    [Multiple Regression] [Workshop 7: Multi...] [2010-11-20 09:52:53] [62f7c80c4d96454bbd2b2b026ea9aad9]
-   P         [Multiple Regression] [Workshop 7: Multi...] [2010-11-20 10:15:55] [8eb352cba3cf694c3df89d0a436a2f1b] [Current]
-    D          [Multiple Regression] [Workshop 7: Multi...] [2010-11-20 11:21:05] [62f7c80c4d96454bbd2b2b026ea9aad9]
-    D            [Multiple Regression] [Invoer X crisis] [2010-11-25 08:22:21] [62f7c80c4d96454bbd2b2b026ea9aad9]
Feedback Forum

Post a new message
Dataseries X:
16198.9	16896.2
16554.2	16698
19554.2	19691.6
15903.8	15930.7
18003.8	17444.6
18329.6	17699.4
16260.7	15189.8
14851.9	15672.7
18174.1	17180.8
18406.6	17664.9
18466.5	17862.9
16016.5	16162.3
17428.5	17463.6
17167.2	16772.1
19630	19106.9
17183.6	16721.3
18344.7	18161.3
19301.4	18509.9
18147.5	17802.7
16192.9	16409.9
18374.4	17967.7
20515.2	20286.6
18957.2	19537.3
16471.5	18021.9
18746.8	20194.3
19009.5	19049.6
19211.2	20244.7
20547.7	21473.3
19325.8	19673.6
20605.5	21053.2
20056.9	20159.5
16141.4	18203.6
20359.8	21289.5
19711.6	20432.3
15638.6	17180.4
14384.5	15816.8
13855.6	15071.8
14308.3	14521.1
15290.6	15668.8
14423.8	14346.9
13779.7	13881
15686.3	15465.9
14733.8	14238.2
12522.5	13557.7
16189.4	16127.6
16059.1	16793.9
16007.1	16014
15806.8	16867.9
15160	16014.6
15692.1	15878.6
18908.9	18664.9
16969.9	17962.5
16997.5	17332.7
19858.9	19542.1
17681.2	17203.6


Summary of computational transaction
Raw Inputview raw input (R code)
Raw Outputview raw output of R engine
Computing time6 seconds
R Server'George Udny Yule' @ 72.249.76.132

\begin{tabular}{lllllllll}
\hline
Summary of computational transaction \tabularnewline
Raw Input & view raw input (R code)  \tabularnewline
Raw Output & view raw output of R engine  \tabularnewline
Computing time & 6 seconds \tabularnewline
R Server & 'George Udny Yule' @ 72.249.76.132 \tabularnewline
\hline
\end{tabular}
%Source: https://freestatistics.org/blog/index.php?pk=98171&T=0

[TABLE]
[ROW][C]Summary of computational transaction[/C][/ROW]
[ROW][C]Raw Input[/C][C]view raw input (R code) [/C][/ROW]
[ROW][C]Raw Output[/C][C]view raw output of R engine [/C][/ROW]
[ROW][C]Computing time[/C][C]6 seconds[/C][/ROW]
[ROW][C]R Server[/C][C]'George Udny Yule' @ 72.249.76.132[/C][/ROW]
[/TABLE]
Source: https://freestatistics.org/blog/index.php?pk=98171&T=0

Globally Unique Identifier (entire table): ba.freestatistics.org/blog/index.php?pk=98171&T=0

As an alternative you can also use a QR Code:  

The GUIDs for individual cells are displayed in the table below:

Summary of computational transaction
Raw Inputview raw input (R code)
Raw Outputview raw output of R engine
Computing time6 seconds
R Server'George Udny Yule' @ 72.249.76.132


Multiple Linear Regression - Estimated Regression Equation
uitvoer[t] = + 461.716906481099 + 0.960377566411468invoer[t] + e[t]

\begin{tabular}{lllllllll}
\hline
Multiple Linear Regression - Estimated Regression Equation \tabularnewline
uitvoer[t] =  +  461.716906481099 +  0.960377566411468invoer[t]  + e[t] \tabularnewline
\hline
\end{tabular}
%Source: https://freestatistics.org/blog/index.php?pk=98171&T=1

[TABLE]
[ROW][C]Multiple Linear Regression - Estimated Regression Equation[/C][/ROW]
[ROW][C]uitvoer[t] =  +  461.716906481099 +  0.960377566411468invoer[t]  + e[t][/C][/ROW]
[/TABLE]
Source: https://freestatistics.org/blog/index.php?pk=98171&T=1

Globally Unique Identifier (entire table): ba.freestatistics.org/blog/index.php?pk=98171&T=1

As an alternative you can also use a QR Code:  

The GUIDs for individual cells are displayed in the table below:

Multiple Linear Regression - Estimated Regression Equation
uitvoer[t] = + 461.716906481099 + 0.960377566411468invoer[t] + e[t]


Multiple Linear Regression - Ordinary Least Squares
VariableParameterS.D.T-STATH0: parameter = 02-tail p-value1-tail p-value
(Intercept)461.716906481099876.9620530.52650.600740.30037
invoer0.9603775664114680.04989219.24900

\begin{tabular}{lllllllll}
\hline
Multiple Linear Regression - Ordinary Least Squares \tabularnewline
Variable & Parameter & S.D. & T-STATH0: parameter = 0 & 2-tail p-value & 1-tail p-value \tabularnewline
(Intercept) & 461.716906481099 & 876.962053 & 0.5265 & 0.60074 & 0.30037 \tabularnewline
invoer & 0.960377566411468 & 0.049892 & 19.249 & 0 & 0 \tabularnewline
\hline
\end{tabular}
%Source: https://freestatistics.org/blog/index.php?pk=98171&T=2

[TABLE]
[ROW][C]Multiple Linear Regression - Ordinary Least Squares[/C][/ROW]
[ROW][C]Variable[/C][C]Parameter[/C][C]S.D.[/C][C]T-STATH0: parameter = 0[/C][C]2-tail p-value[/C][C]1-tail p-value[/C][/ROW]
[ROW][C](Intercept)[/C][C]461.716906481099[/C][C]876.962053[/C][C]0.5265[/C][C]0.60074[/C][C]0.30037[/C][/ROW]
[ROW][C]invoer[/C][C]0.960377566411468[/C][C]0.049892[/C][C]19.249[/C][C]0[/C][C]0[/C][/ROW]
[/TABLE]
Source: https://freestatistics.org/blog/index.php?pk=98171&T=2

Globally Unique Identifier (entire table): ba.freestatistics.org/blog/index.php?pk=98171&T=2

As an alternative you can also use a QR Code:  

The GUIDs for individual cells are displayed in the table below:

Multiple Linear Regression - Ordinary Least Squares
VariableParameterS.D.T-STATH0: parameter = 02-tail p-value1-tail p-value
(Intercept)461.716906481099876.9620530.52650.600740.30037
invoer0.9603775664114680.04989219.24900


Multiple Linear Regression - Regression Statistics
Multiple R0.935339000010779
R-squared0.874859044941164
Adjusted R-squared0.872497894845714
F-TEST (value)370.522418980113
F-TEST (DF numerator)1
F-TEST (DF denominator)53
p-value0
Multiple Linear Regression - Residual Statistics
Residual Standard Deviation720.95617923207
Sum Squared Residuals27548224.0557639

\begin{tabular}{lllllllll}
\hline
Multiple Linear Regression - Regression Statistics \tabularnewline
Multiple R & 0.935339000010779 \tabularnewline
R-squared & 0.874859044941164 \tabularnewline
Adjusted R-squared & 0.872497894845714 \tabularnewline
F-TEST (value) & 370.522418980113 \tabularnewline
F-TEST (DF numerator) & 1 \tabularnewline
F-TEST (DF denominator) & 53 \tabularnewline
p-value & 0 \tabularnewline
Multiple Linear Regression - Residual Statistics \tabularnewline
Residual Standard Deviation & 720.95617923207 \tabularnewline
Sum Squared Residuals & 27548224.0557639 \tabularnewline
\hline
\end{tabular}
%Source: https://freestatistics.org/blog/index.php?pk=98171&T=3

[TABLE]
[ROW][C]Multiple Linear Regression - Regression Statistics[/C][/ROW]
[ROW][C]Multiple R[/C][C]0.935339000010779[/C][/ROW]
[ROW][C]R-squared[/C][C]0.874859044941164[/C][/ROW]
[ROW][C]Adjusted R-squared[/C][C]0.872497894845714[/C][/ROW]
[ROW][C]F-TEST (value)[/C][C]370.522418980113[/C][/ROW]
[ROW][C]F-TEST (DF numerator)[/C][C]1[/C][/ROW]
[ROW][C]F-TEST (DF denominator)[/C][C]53[/C][/ROW]
[ROW][C]p-value[/C][C]0[/C][/ROW]
[ROW][C]Multiple Linear Regression - Residual Statistics[/C][/ROW]
[ROW][C]Residual Standard Deviation[/C][C]720.95617923207[/C][/ROW]
[ROW][C]Sum Squared Residuals[/C][C]27548224.0557639[/C][/ROW]
[/TABLE]
Source: https://freestatistics.org/blog/index.php?pk=98171&T=3

Globally Unique Identifier (entire table): ba.freestatistics.org/blog/index.php?pk=98171&T=3

As an alternative you can also use a QR Code:  

The GUIDs for individual cells are displayed in the table below:

Multiple Linear Regression - Regression Statistics
Multiple R0.935339000010779
R-squared0.874859044941164
Adjusted R-squared0.872497894845714
F-TEST (value)370.522418980113
F-TEST (DF numerator)1
F-TEST (DF denominator)53
p-value0
Multiple Linear Regression - Residual Statistics
Residual Standard Deviation720.95617923207
Sum Squared Residuals27548224.0557639


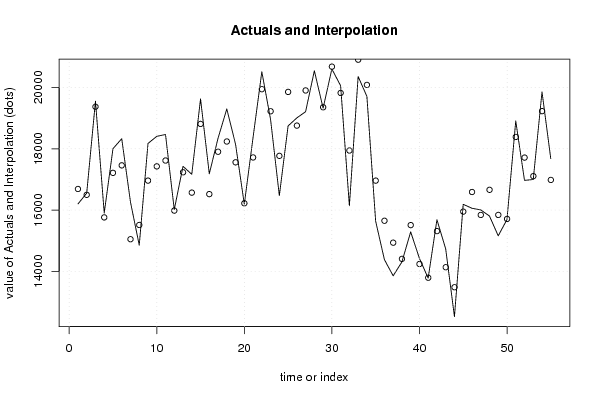
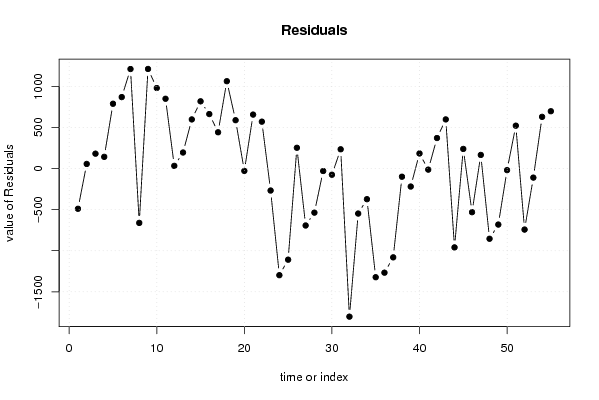
Multiple Linear Regression - Actuals, Interpolation, and Residuals
Time or IndexActualsInterpolationForecastResidualsPrediction Error
116198.916688.4483440825-489.548344082513
216554.216498.101510419856.098489580217
319554.219373.0877932291181.112206770855
415903.815761.2038037123142.596196287739
518003.817215.1194015026788.68059849742
618329.617459.8236054242869.776394575775
716260.715049.6600647581211.03993524200
814851.915513.4263915781-661.526391578102
918174.116961.77179948321212.32820051676
1018406.617426.6905793830979.90942061697
1118466.517616.8453375325849.654662467501
1216016.515983.627248093232.8727519068451
1317428.517233.3665752644195.133424735603
1417167.216569.2654880909597.934511909133
151963018811.5550301484818.444969851636
1617183.616520.4783077172663.121692282833
1718344.717903.4220033497441.277996650322
1819301.418238.20962300071063.19037699928
1918147.517559.0306080345588.469391965472
2016192.916221.4167335366-28.5167335366368
2118374.417717.4929064924656.907093507582
2220515.219944.5124452440570.687554756031
2318957.219224.9015347319-267.701534731857
2416471.517769.5453705919-1298.04537059192
2518746.819855.8695958642-1109.06959586419
2619009.518756.5253955930252.974604407016
2719211.219904.2726252113-693.07262521133
2820547.721084.1925033045-536.492503304458
2919325.819355.8009970337-30.0009970337406
3020605.520680.737887655-75.2378876550021
3120056.919822.4484565531234.451543446928
3216141.417944.0459744089-1802.64597440888
3320359.820907.6751065980-547.875106598032
3419711.620084.4394566701-372.839456670122
3515638.616961.3876484567-1322.78764845667
3614384.515651.816798898-1267.31679889799
3713855.614936.3355119215-1080.73551192145
3814308.314407.4555860987-99.1555860986566
3915290.615509.6809190691-219.080919069096
4014423.814240.1578140298183.642185970222
4113779.713792.7179058387-13.0179058386743
4215686.315314.8203108442371.47968915579
4314733.814135.7647725609598.035227439148
4412522.513482.2278386178-959.727838617849
4516189.415950.3021465387239.097853461322
4616059.116590.2017190386-531.10171903864
4716007.115841.2032549943165.896745005665
4815806.816661.2696589531-854.46965895309
491516015841.7794815342-681.779481534182
5015692.115711.1681325022-19.0681325022223
5118908.918387.0681457945521.831854205506
5216969.917712.4989431471-742.598943147078
5316997.517107.6531518211-110.153151821138
5419858.919229.5113470506629.38865294937
5517681.216983.6684079974697.531592002585

\begin{tabular}{lllllllll}
\hline
Multiple Linear Regression - Actuals, Interpolation, and Residuals \tabularnewline
Time or Index & Actuals & InterpolationForecast & ResidualsPrediction Error \tabularnewline
1 & 16198.9 & 16688.4483440825 & -489.548344082513 \tabularnewline
2 & 16554.2 & 16498.1015104198 & 56.098489580217 \tabularnewline
3 & 19554.2 & 19373.0877932291 & 181.112206770855 \tabularnewline
4 & 15903.8 & 15761.2038037123 & 142.596196287739 \tabularnewline
5 & 18003.8 & 17215.1194015026 & 788.68059849742 \tabularnewline
6 & 18329.6 & 17459.8236054242 & 869.776394575775 \tabularnewline
7 & 16260.7 & 15049.660064758 & 1211.03993524200 \tabularnewline
8 & 14851.9 & 15513.4263915781 & -661.526391578102 \tabularnewline
9 & 18174.1 & 16961.7717994832 & 1212.32820051676 \tabularnewline
10 & 18406.6 & 17426.6905793830 & 979.90942061697 \tabularnewline
11 & 18466.5 & 17616.8453375325 & 849.654662467501 \tabularnewline
12 & 16016.5 & 15983.6272480932 & 32.8727519068451 \tabularnewline
13 & 17428.5 & 17233.3665752644 & 195.133424735603 \tabularnewline
14 & 17167.2 & 16569.2654880909 & 597.934511909133 \tabularnewline
15 & 19630 & 18811.5550301484 & 818.444969851636 \tabularnewline
16 & 17183.6 & 16520.4783077172 & 663.121692282833 \tabularnewline
17 & 18344.7 & 17903.4220033497 & 441.277996650322 \tabularnewline
18 & 19301.4 & 18238.2096230007 & 1063.19037699928 \tabularnewline
19 & 18147.5 & 17559.0306080345 & 588.469391965472 \tabularnewline
20 & 16192.9 & 16221.4167335366 & -28.5167335366368 \tabularnewline
21 & 18374.4 & 17717.4929064924 & 656.907093507582 \tabularnewline
22 & 20515.2 & 19944.5124452440 & 570.687554756031 \tabularnewline
23 & 18957.2 & 19224.9015347319 & -267.701534731857 \tabularnewline
24 & 16471.5 & 17769.5453705919 & -1298.04537059192 \tabularnewline
25 & 18746.8 & 19855.8695958642 & -1109.06959586419 \tabularnewline
26 & 19009.5 & 18756.5253955930 & 252.974604407016 \tabularnewline
27 & 19211.2 & 19904.2726252113 & -693.07262521133 \tabularnewline
28 & 20547.7 & 21084.1925033045 & -536.492503304458 \tabularnewline
29 & 19325.8 & 19355.8009970337 & -30.0009970337406 \tabularnewline
30 & 20605.5 & 20680.737887655 & -75.2378876550021 \tabularnewline
31 & 20056.9 & 19822.4484565531 & 234.451543446928 \tabularnewline
32 & 16141.4 & 17944.0459744089 & -1802.64597440888 \tabularnewline
33 & 20359.8 & 20907.6751065980 & -547.875106598032 \tabularnewline
34 & 19711.6 & 20084.4394566701 & -372.839456670122 \tabularnewline
35 & 15638.6 & 16961.3876484567 & -1322.78764845667 \tabularnewline
36 & 14384.5 & 15651.816798898 & -1267.31679889799 \tabularnewline
37 & 13855.6 & 14936.3355119215 & -1080.73551192145 \tabularnewline
38 & 14308.3 & 14407.4555860987 & -99.1555860986566 \tabularnewline
39 & 15290.6 & 15509.6809190691 & -219.080919069096 \tabularnewline
40 & 14423.8 & 14240.1578140298 & 183.642185970222 \tabularnewline
41 & 13779.7 & 13792.7179058387 & -13.0179058386743 \tabularnewline
42 & 15686.3 & 15314.8203108442 & 371.47968915579 \tabularnewline
43 & 14733.8 & 14135.7647725609 & 598.035227439148 \tabularnewline
44 & 12522.5 & 13482.2278386178 & -959.727838617849 \tabularnewline
45 & 16189.4 & 15950.3021465387 & 239.097853461322 \tabularnewline
46 & 16059.1 & 16590.2017190386 & -531.10171903864 \tabularnewline
47 & 16007.1 & 15841.2032549943 & 165.896745005665 \tabularnewline
48 & 15806.8 & 16661.2696589531 & -854.46965895309 \tabularnewline
49 & 15160 & 15841.7794815342 & -681.779481534182 \tabularnewline
50 & 15692.1 & 15711.1681325022 & -19.0681325022223 \tabularnewline
51 & 18908.9 & 18387.0681457945 & 521.831854205506 \tabularnewline
52 & 16969.9 & 17712.4989431471 & -742.598943147078 \tabularnewline
53 & 16997.5 & 17107.6531518211 & -110.153151821138 \tabularnewline
54 & 19858.9 & 19229.5113470506 & 629.38865294937 \tabularnewline
55 & 17681.2 & 16983.6684079974 & 697.531592002585 \tabularnewline
\hline
\end{tabular}
%Source: https://freestatistics.org/blog/index.php?pk=98171&T=4

[TABLE]
[ROW][C]Multiple Linear Regression - Actuals, Interpolation, and Residuals[/C][/ROW]
[ROW][C]Time or Index[/C][C]Actuals[/C][C]InterpolationForecast[/C][C]ResidualsPrediction Error[/C][/ROW]
[ROW][C]1[/C][C]16198.9[/C][C]16688.4483440825[/C][C]-489.548344082513[/C][/ROW]
[ROW][C]2[/C][C]16554.2[/C][C]16498.1015104198[/C][C]56.098489580217[/C][/ROW]
[ROW][C]3[/C][C]19554.2[/C][C]19373.0877932291[/C][C]181.112206770855[/C][/ROW]
[ROW][C]4[/C][C]15903.8[/C][C]15761.2038037123[/C][C]142.596196287739[/C][/ROW]
[ROW][C]5[/C][C]18003.8[/C][C]17215.1194015026[/C][C]788.68059849742[/C][/ROW]
[ROW][C]6[/C][C]18329.6[/C][C]17459.8236054242[/C][C]869.776394575775[/C][/ROW]
[ROW][C]7[/C][C]16260.7[/C][C]15049.660064758[/C][C]1211.03993524200[/C][/ROW]
[ROW][C]8[/C][C]14851.9[/C][C]15513.4263915781[/C][C]-661.526391578102[/C][/ROW]
[ROW][C]9[/C][C]18174.1[/C][C]16961.7717994832[/C][C]1212.32820051676[/C][/ROW]
[ROW][C]10[/C][C]18406.6[/C][C]17426.6905793830[/C][C]979.90942061697[/C][/ROW]
[ROW][C]11[/C][C]18466.5[/C][C]17616.8453375325[/C][C]849.654662467501[/C][/ROW]
[ROW][C]12[/C][C]16016.5[/C][C]15983.6272480932[/C][C]32.8727519068451[/C][/ROW]
[ROW][C]13[/C][C]17428.5[/C][C]17233.3665752644[/C][C]195.133424735603[/C][/ROW]
[ROW][C]14[/C][C]17167.2[/C][C]16569.2654880909[/C][C]597.934511909133[/C][/ROW]
[ROW][C]15[/C][C]19630[/C][C]18811.5550301484[/C][C]818.444969851636[/C][/ROW]
[ROW][C]16[/C][C]17183.6[/C][C]16520.4783077172[/C][C]663.121692282833[/C][/ROW]
[ROW][C]17[/C][C]18344.7[/C][C]17903.4220033497[/C][C]441.277996650322[/C][/ROW]
[ROW][C]18[/C][C]19301.4[/C][C]18238.2096230007[/C][C]1063.19037699928[/C][/ROW]
[ROW][C]19[/C][C]18147.5[/C][C]17559.0306080345[/C][C]588.469391965472[/C][/ROW]
[ROW][C]20[/C][C]16192.9[/C][C]16221.4167335366[/C][C]-28.5167335366368[/C][/ROW]
[ROW][C]21[/C][C]18374.4[/C][C]17717.4929064924[/C][C]656.907093507582[/C][/ROW]
[ROW][C]22[/C][C]20515.2[/C][C]19944.5124452440[/C][C]570.687554756031[/C][/ROW]
[ROW][C]23[/C][C]18957.2[/C][C]19224.9015347319[/C][C]-267.701534731857[/C][/ROW]
[ROW][C]24[/C][C]16471.5[/C][C]17769.5453705919[/C][C]-1298.04537059192[/C][/ROW]
[ROW][C]25[/C][C]18746.8[/C][C]19855.8695958642[/C][C]-1109.06959586419[/C][/ROW]
[ROW][C]26[/C][C]19009.5[/C][C]18756.5253955930[/C][C]252.974604407016[/C][/ROW]
[ROW][C]27[/C][C]19211.2[/C][C]19904.2726252113[/C][C]-693.07262521133[/C][/ROW]
[ROW][C]28[/C][C]20547.7[/C][C]21084.1925033045[/C][C]-536.492503304458[/C][/ROW]
[ROW][C]29[/C][C]19325.8[/C][C]19355.8009970337[/C][C]-30.0009970337406[/C][/ROW]
[ROW][C]30[/C][C]20605.5[/C][C]20680.737887655[/C][C]-75.2378876550021[/C][/ROW]
[ROW][C]31[/C][C]20056.9[/C][C]19822.4484565531[/C][C]234.451543446928[/C][/ROW]
[ROW][C]32[/C][C]16141.4[/C][C]17944.0459744089[/C][C]-1802.64597440888[/C][/ROW]
[ROW][C]33[/C][C]20359.8[/C][C]20907.6751065980[/C][C]-547.875106598032[/C][/ROW]
[ROW][C]34[/C][C]19711.6[/C][C]20084.4394566701[/C][C]-372.839456670122[/C][/ROW]
[ROW][C]35[/C][C]15638.6[/C][C]16961.3876484567[/C][C]-1322.78764845667[/C][/ROW]
[ROW][C]36[/C][C]14384.5[/C][C]15651.816798898[/C][C]-1267.31679889799[/C][/ROW]
[ROW][C]37[/C][C]13855.6[/C][C]14936.3355119215[/C][C]-1080.73551192145[/C][/ROW]
[ROW][C]38[/C][C]14308.3[/C][C]14407.4555860987[/C][C]-99.1555860986566[/C][/ROW]
[ROW][C]39[/C][C]15290.6[/C][C]15509.6809190691[/C][C]-219.080919069096[/C][/ROW]
[ROW][C]40[/C][C]14423.8[/C][C]14240.1578140298[/C][C]183.642185970222[/C][/ROW]
[ROW][C]41[/C][C]13779.7[/C][C]13792.7179058387[/C][C]-13.0179058386743[/C][/ROW]
[ROW][C]42[/C][C]15686.3[/C][C]15314.8203108442[/C][C]371.47968915579[/C][/ROW]
[ROW][C]43[/C][C]14733.8[/C][C]14135.7647725609[/C][C]598.035227439148[/C][/ROW]
[ROW][C]44[/C][C]12522.5[/C][C]13482.2278386178[/C][C]-959.727838617849[/C][/ROW]
[ROW][C]45[/C][C]16189.4[/C][C]15950.3021465387[/C][C]239.097853461322[/C][/ROW]
[ROW][C]46[/C][C]16059.1[/C][C]16590.2017190386[/C][C]-531.10171903864[/C][/ROW]
[ROW][C]47[/C][C]16007.1[/C][C]15841.2032549943[/C][C]165.896745005665[/C][/ROW]
[ROW][C]48[/C][C]15806.8[/C][C]16661.2696589531[/C][C]-854.46965895309[/C][/ROW]
[ROW][C]49[/C][C]15160[/C][C]15841.7794815342[/C][C]-681.779481534182[/C][/ROW]
[ROW][C]50[/C][C]15692.1[/C][C]15711.1681325022[/C][C]-19.0681325022223[/C][/ROW]
[ROW][C]51[/C][C]18908.9[/C][C]18387.0681457945[/C][C]521.831854205506[/C][/ROW]
[ROW][C]52[/C][C]16969.9[/C][C]17712.4989431471[/C][C]-742.598943147078[/C][/ROW]
[ROW][C]53[/C][C]16997.5[/C][C]17107.6531518211[/C][C]-110.153151821138[/C][/ROW]
[ROW][C]54[/C][C]19858.9[/C][C]19229.5113470506[/C][C]629.38865294937[/C][/ROW]
[ROW][C]55[/C][C]17681.2[/C][C]16983.6684079974[/C][C]697.531592002585[/C][/ROW]
[/TABLE]
Source: https://freestatistics.org/blog/index.php?pk=98171&T=4

Globally Unique Identifier (entire table): ba.freestatistics.org/blog/index.php?pk=98171&T=4

As an alternative you can also use a QR Code:  

The GUIDs for individual cells are displayed in the table below:

Multiple Linear Regression - Actuals, Interpolation, and Residuals
Time or IndexActualsInterpolationForecastResidualsPrediction Error
116198.916688.4483440825-489.548344082513
216554.216498.101510419856.098489580217
319554.219373.0877932291181.112206770855
415903.815761.2038037123142.596196287739
518003.817215.1194015026788.68059849742
618329.617459.8236054242869.776394575775
716260.715049.6600647581211.03993524200
814851.915513.4263915781-661.526391578102
918174.116961.77179948321212.32820051676
1018406.617426.6905793830979.90942061697
1118466.517616.8453375325849.654662467501
1216016.515983.627248093232.8727519068451
1317428.517233.3665752644195.133424735603
1417167.216569.2654880909597.934511909133
151963018811.5550301484818.444969851636
1617183.616520.4783077172663.121692282833
1718344.717903.4220033497441.277996650322
1819301.418238.20962300071063.19037699928
1918147.517559.0306080345588.469391965472
2016192.916221.4167335366-28.5167335366368
2118374.417717.4929064924656.907093507582
2220515.219944.5124452440570.687554756031
2318957.219224.9015347319-267.701534731857
2416471.517769.5453705919-1298.04537059192
2518746.819855.8695958642-1109.06959586419
2619009.518756.5253955930252.974604407016
2719211.219904.2726252113-693.07262521133
2820547.721084.1925033045-536.492503304458
2919325.819355.8009970337-30.0009970337406
3020605.520680.737887655-75.2378876550021
3120056.919822.4484565531234.451543446928
3216141.417944.0459744089-1802.64597440888
3320359.820907.6751065980-547.875106598032
3419711.620084.4394566701-372.839456670122
3515638.616961.3876484567-1322.78764845667
3614384.515651.816798898-1267.31679889799
3713855.614936.3355119215-1080.73551192145
3814308.314407.4555860987-99.1555860986566
3915290.615509.6809190691-219.080919069096
4014423.814240.1578140298183.642185970222
4113779.713792.7179058387-13.0179058386743
4215686.315314.8203108442371.47968915579
4314733.814135.7647725609598.035227439148
4412522.513482.2278386178-959.727838617849
4516189.415950.3021465387239.097853461322
4616059.116590.2017190386-531.10171903864
4716007.115841.2032549943165.896745005665
4815806.816661.2696589531-854.46965895309
491516015841.7794815342-681.779481534182
5015692.115711.1681325022-19.0681325022223
5118908.918387.0681457945521.831854205506
5216969.917712.4989431471-742.598943147078
5316997.517107.6531518211-110.153151821138
5419858.919229.5113470506629.38865294937
5517681.216983.6684079974697.531592002585


Goldfeld-Quandt test for Heteroskedasticity
p-valuesAlternative Hypothesis
breakpoint indexgreater2-sidedless
50.3011147424946140.6022294849892290.698885257505386
60.3011815891342820.6023631782685630.698818410865718
70.4054231936837770.8108463873675550.594576806316223
80.5308492785136390.9383014429727210.469150721486361
90.6066603339741680.7866793320516650.393339666025832
100.5836621595931270.8326756808137460.416337840406873
110.5286431741622790.9427136516754420.471356825837721
120.4448271205957380.8896542411914760.555172879404262
130.3618900526919980.7237801053839960.638109947308002
140.2983019588262060.5966039176524130.701698041173794
150.2554002036353510.5108004072707020.744599796364649
160.2163424919787300.4326849839574610.78365750802127
170.1681446172666590.3362892345333180.83185538273334
180.1884482453880370.3768964907760730.811551754611963
190.1575737919804760.3151475839609520.842426208019524
200.1273439879654590.2546879759309170.872656012034541
210.1123359099252150.2246718198504310.887664090074785
220.1048429954252330.2096859908504650.895157004574767
230.1344200357788570.2688400715577140.865579964221143
240.4515680390328220.9031360780656450.548431960967178
250.6266489555956240.7467020888087520.373351044404376
260.5727040230046590.8545919539906830.427295976995341
270.5640603061010670.8718793877978660.435939693898933
280.5060667225685360.9878665548629270.493933277431464
290.4304842501546170.8609685003092330.569515749845383
300.3562714119084970.7125428238169940.643728588091503
310.3130865799137090.6261731598274190.686913420086291
320.7329999478105630.5340001043788750.267000052189437
330.6844636674785960.6310726650428080.315536332521404
340.6232499834360520.7535000331278970.376750016563948
350.8168194377405050.3663611245189910.183180562259495
360.9221719000022210.1556561999955580.077828099997779
370.957486082970130.08502783405974050.0425139170298703
380.9326580802623020.1346838394753950.0673419197376977
390.8991685597008550.201662880598290.100831440299145
400.8625559454465110.2748881091069770.137444054553489
410.8092995737984660.3814008524030680.190700426201534
420.7784982357227320.4430035285545370.221501764277268
430.876507411981310.2469851760373810.123492588018690
440.8371891015468140.3256217969063730.162810898453186
450.804127690551860.3917446188962780.195872309448139
460.7424854168440920.5150291663118160.257514583155908
470.6947217620340930.6105564759318140.305278237965907
480.7055147375295650.588970524940870.294485262470435
490.6381286959292520.7237426081414970.361871304070748
500.4695687528268790.9391375056537580.530431247173121

\begin{tabular}{lllllllll}
\hline
Goldfeld-Quandt test for Heteroskedasticity \tabularnewline
p-values & Alternative Hypothesis \tabularnewline
breakpoint index & greater & 2-sided & less \tabularnewline
5 & 0.301114742494614 & 0.602229484989229 & 0.698885257505386 \tabularnewline
6 & 0.301181589134282 & 0.602363178268563 & 0.698818410865718 \tabularnewline
7 & 0.405423193683777 & 0.810846387367555 & 0.594576806316223 \tabularnewline
8 & 0.530849278513639 & 0.938301442972721 & 0.469150721486361 \tabularnewline
9 & 0.606660333974168 & 0.786679332051665 & 0.393339666025832 \tabularnewline
10 & 0.583662159593127 & 0.832675680813746 & 0.416337840406873 \tabularnewline
11 & 0.528643174162279 & 0.942713651675442 & 0.471356825837721 \tabularnewline
12 & 0.444827120595738 & 0.889654241191476 & 0.555172879404262 \tabularnewline
13 & 0.361890052691998 & 0.723780105383996 & 0.638109947308002 \tabularnewline
14 & 0.298301958826206 & 0.596603917652413 & 0.701698041173794 \tabularnewline
15 & 0.255400203635351 & 0.510800407270702 & 0.744599796364649 \tabularnewline
16 & 0.216342491978730 & 0.432684983957461 & 0.78365750802127 \tabularnewline
17 & 0.168144617266659 & 0.336289234533318 & 0.83185538273334 \tabularnewline
18 & 0.188448245388037 & 0.376896490776073 & 0.811551754611963 \tabularnewline
19 & 0.157573791980476 & 0.315147583960952 & 0.842426208019524 \tabularnewline
20 & 0.127343987965459 & 0.254687975930917 & 0.872656012034541 \tabularnewline
21 & 0.112335909925215 & 0.224671819850431 & 0.887664090074785 \tabularnewline
22 & 0.104842995425233 & 0.209685990850465 & 0.895157004574767 \tabularnewline
23 & 0.134420035778857 & 0.268840071557714 & 0.865579964221143 \tabularnewline
24 & 0.451568039032822 & 0.903136078065645 & 0.548431960967178 \tabularnewline
25 & 0.626648955595624 & 0.746702088808752 & 0.373351044404376 \tabularnewline
26 & 0.572704023004659 & 0.854591953990683 & 0.427295976995341 \tabularnewline
27 & 0.564060306101067 & 0.871879387797866 & 0.435939693898933 \tabularnewline
28 & 0.506066722568536 & 0.987866554862927 & 0.493933277431464 \tabularnewline
29 & 0.430484250154617 & 0.860968500309233 & 0.569515749845383 \tabularnewline
30 & 0.356271411908497 & 0.712542823816994 & 0.643728588091503 \tabularnewline
31 & 0.313086579913709 & 0.626173159827419 & 0.686913420086291 \tabularnewline
32 & 0.732999947810563 & 0.534000104378875 & 0.267000052189437 \tabularnewline
33 & 0.684463667478596 & 0.631072665042808 & 0.315536332521404 \tabularnewline
34 & 0.623249983436052 & 0.753500033127897 & 0.376750016563948 \tabularnewline
35 & 0.816819437740505 & 0.366361124518991 & 0.183180562259495 \tabularnewline
36 & 0.922171900002221 & 0.155656199995558 & 0.077828099997779 \tabularnewline
37 & 0.95748608297013 & 0.0850278340597405 & 0.0425139170298703 \tabularnewline
38 & 0.932658080262302 & 0.134683839475395 & 0.0673419197376977 \tabularnewline
39 & 0.899168559700855 & 0.20166288059829 & 0.100831440299145 \tabularnewline
40 & 0.862555945446511 & 0.274888109106977 & 0.137444054553489 \tabularnewline
41 & 0.809299573798466 & 0.381400852403068 & 0.190700426201534 \tabularnewline
42 & 0.778498235722732 & 0.443003528554537 & 0.221501764277268 \tabularnewline
43 & 0.87650741198131 & 0.246985176037381 & 0.123492588018690 \tabularnewline
44 & 0.837189101546814 & 0.325621796906373 & 0.162810898453186 \tabularnewline
45 & 0.80412769055186 & 0.391744618896278 & 0.195872309448139 \tabularnewline
46 & 0.742485416844092 & 0.515029166311816 & 0.257514583155908 \tabularnewline
47 & 0.694721762034093 & 0.610556475931814 & 0.305278237965907 \tabularnewline
48 & 0.705514737529565 & 0.58897052494087 & 0.294485262470435 \tabularnewline
49 & 0.638128695929252 & 0.723742608141497 & 0.361871304070748 \tabularnewline
50 & 0.469568752826879 & 0.939137505653758 & 0.530431247173121 \tabularnewline
\hline
\end{tabular}
%Source: https://freestatistics.org/blog/index.php?pk=98171&T=5

[TABLE]
[ROW][C]Goldfeld-Quandt test for Heteroskedasticity[/C][/ROW]
[ROW][C]p-values[/C][C]Alternative Hypothesis[/C][/ROW]
[ROW][C]breakpoint index[/C][C]greater[/C][C]2-sided[/C][C]less[/C][/ROW]
[ROW][C]5[/C][C]0.301114742494614[/C][C]0.602229484989229[/C][C]0.698885257505386[/C][/ROW]
[ROW][C]6[/C][C]0.301181589134282[/C][C]0.602363178268563[/C][C]0.698818410865718[/C][/ROW]
[ROW][C]7[/C][C]0.405423193683777[/C][C]0.810846387367555[/C][C]0.594576806316223[/C][/ROW]
[ROW][C]8[/C][C]0.530849278513639[/C][C]0.938301442972721[/C][C]0.469150721486361[/C][/ROW]
[ROW][C]9[/C][C]0.606660333974168[/C][C]0.786679332051665[/C][C]0.393339666025832[/C][/ROW]
[ROW][C]10[/C][C]0.583662159593127[/C][C]0.832675680813746[/C][C]0.416337840406873[/C][/ROW]
[ROW][C]11[/C][C]0.528643174162279[/C][C]0.942713651675442[/C][C]0.471356825837721[/C][/ROW]
[ROW][C]12[/C][C]0.444827120595738[/C][C]0.889654241191476[/C][C]0.555172879404262[/C][/ROW]
[ROW][C]13[/C][C]0.361890052691998[/C][C]0.723780105383996[/C][C]0.638109947308002[/C][/ROW]
[ROW][C]14[/C][C]0.298301958826206[/C][C]0.596603917652413[/C][C]0.701698041173794[/C][/ROW]
[ROW][C]15[/C][C]0.255400203635351[/C][C]0.510800407270702[/C][C]0.744599796364649[/C][/ROW]
[ROW][C]16[/C][C]0.216342491978730[/C][C]0.432684983957461[/C][C]0.78365750802127[/C][/ROW]
[ROW][C]17[/C][C]0.168144617266659[/C][C]0.336289234533318[/C][C]0.83185538273334[/C][/ROW]
[ROW][C]18[/C][C]0.188448245388037[/C][C]0.376896490776073[/C][C]0.811551754611963[/C][/ROW]
[ROW][C]19[/C][C]0.157573791980476[/C][C]0.315147583960952[/C][C]0.842426208019524[/C][/ROW]
[ROW][C]20[/C][C]0.127343987965459[/C][C]0.254687975930917[/C][C]0.872656012034541[/C][/ROW]
[ROW][C]21[/C][C]0.112335909925215[/C][C]0.224671819850431[/C][C]0.887664090074785[/C][/ROW]
[ROW][C]22[/C][C]0.104842995425233[/C][C]0.209685990850465[/C][C]0.895157004574767[/C][/ROW]
[ROW][C]23[/C][C]0.134420035778857[/C][C]0.268840071557714[/C][C]0.865579964221143[/C][/ROW]
[ROW][C]24[/C][C]0.451568039032822[/C][C]0.903136078065645[/C][C]0.548431960967178[/C][/ROW]
[ROW][C]25[/C][C]0.626648955595624[/C][C]0.746702088808752[/C][C]0.373351044404376[/C][/ROW]
[ROW][C]26[/C][C]0.572704023004659[/C][C]0.854591953990683[/C][C]0.427295976995341[/C][/ROW]
[ROW][C]27[/C][C]0.564060306101067[/C][C]0.871879387797866[/C][C]0.435939693898933[/C][/ROW]
[ROW][C]28[/C][C]0.506066722568536[/C][C]0.987866554862927[/C][C]0.493933277431464[/C][/ROW]
[ROW][C]29[/C][C]0.430484250154617[/C][C]0.860968500309233[/C][C]0.569515749845383[/C][/ROW]
[ROW][C]30[/C][C]0.356271411908497[/C][C]0.712542823816994[/C][C]0.643728588091503[/C][/ROW]
[ROW][C]31[/C][C]0.313086579913709[/C][C]0.626173159827419[/C][C]0.686913420086291[/C][/ROW]
[ROW][C]32[/C][C]0.732999947810563[/C][C]0.534000104378875[/C][C]0.267000052189437[/C][/ROW]
[ROW][C]33[/C][C]0.684463667478596[/C][C]0.631072665042808[/C][C]0.315536332521404[/C][/ROW]
[ROW][C]34[/C][C]0.623249983436052[/C][C]0.753500033127897[/C][C]0.376750016563948[/C][/ROW]
[ROW][C]35[/C][C]0.816819437740505[/C][C]0.366361124518991[/C][C]0.183180562259495[/C][/ROW]
[ROW][C]36[/C][C]0.922171900002221[/C][C]0.155656199995558[/C][C]0.077828099997779[/C][/ROW]
[ROW][C]37[/C][C]0.95748608297013[/C][C]0.0850278340597405[/C][C]0.0425139170298703[/C][/ROW]
[ROW][C]38[/C][C]0.932658080262302[/C][C]0.134683839475395[/C][C]0.0673419197376977[/C][/ROW]
[ROW][C]39[/C][C]0.899168559700855[/C][C]0.20166288059829[/C][C]0.100831440299145[/C][/ROW]
[ROW][C]40[/C][C]0.862555945446511[/C][C]0.274888109106977[/C][C]0.137444054553489[/C][/ROW]
[ROW][C]41[/C][C]0.809299573798466[/C][C]0.381400852403068[/C][C]0.190700426201534[/C][/ROW]
[ROW][C]42[/C][C]0.778498235722732[/C][C]0.443003528554537[/C][C]0.221501764277268[/C][/ROW]
[ROW][C]43[/C][C]0.87650741198131[/C][C]0.246985176037381[/C][C]0.123492588018690[/C][/ROW]
[ROW][C]44[/C][C]0.837189101546814[/C][C]0.325621796906373[/C][C]0.162810898453186[/C][/ROW]
[ROW][C]45[/C][C]0.80412769055186[/C][C]0.391744618896278[/C][C]0.195872309448139[/C][/ROW]
[ROW][C]46[/C][C]0.742485416844092[/C][C]0.515029166311816[/C][C]0.257514583155908[/C][/ROW]
[ROW][C]47[/C][C]0.694721762034093[/C][C]0.610556475931814[/C][C]0.305278237965907[/C][/ROW]
[ROW][C]48[/C][C]0.705514737529565[/C][C]0.58897052494087[/C][C]0.294485262470435[/C][/ROW]
[ROW][C]49[/C][C]0.638128695929252[/C][C]0.723742608141497[/C][C]0.361871304070748[/C][/ROW]
[ROW][C]50[/C][C]0.469568752826879[/C][C]0.939137505653758[/C][C]0.530431247173121[/C][/ROW]
[/TABLE]
Source: https://freestatistics.org/blog/index.php?pk=98171&T=5

Globally Unique Identifier (entire table): ba.freestatistics.org/blog/index.php?pk=98171&T=5

As an alternative you can also use a QR Code:  

The GUIDs for individual cells are displayed in the table below:

Goldfeld-Quandt test for Heteroskedasticity
p-valuesAlternative Hypothesis
breakpoint indexgreater2-sidedless
50.3011147424946140.6022294849892290.698885257505386
60.3011815891342820.6023631782685630.698818410865718
70.4054231936837770.8108463873675550.594576806316223
80.5308492785136390.9383014429727210.469150721486361
90.6066603339741680.7866793320516650.393339666025832
100.5836621595931270.8326756808137460.416337840406873
110.5286431741622790.9427136516754420.471356825837721
120.4448271205957380.8896542411914760.555172879404262
130.3618900526919980.7237801053839960.638109947308002
140.2983019588262060.5966039176524130.701698041173794
150.2554002036353510.5108004072707020.744599796364649
160.2163424919787300.4326849839574610.78365750802127
170.1681446172666590.3362892345333180.83185538273334
180.1884482453880370.3768964907760730.811551754611963
190.1575737919804760.3151475839609520.842426208019524
200.1273439879654590.2546879759309170.872656012034541
210.1123359099252150.2246718198504310.887664090074785
220.1048429954252330.2096859908504650.895157004574767
230.1344200357788570.2688400715577140.865579964221143
240.4515680390328220.9031360780656450.548431960967178
250.6266489555956240.7467020888087520.373351044404376
260.5727040230046590.8545919539906830.427295976995341
270.5640603061010670.8718793877978660.435939693898933
280.5060667225685360.9878665548629270.493933277431464
290.4304842501546170.8609685003092330.569515749845383
300.3562714119084970.7125428238169940.643728588091503
310.3130865799137090.6261731598274190.686913420086291
320.7329999478105630.5340001043788750.267000052189437
330.6844636674785960.6310726650428080.315536332521404
340.6232499834360520.7535000331278970.376750016563948
350.8168194377405050.3663611245189910.183180562259495
360.9221719000022210.1556561999955580.077828099997779
370.957486082970130.08502783405974050.0425139170298703
380.9326580802623020.1346838394753950.0673419197376977
390.8991685597008550.201662880598290.100831440299145
400.8625559454465110.2748881091069770.137444054553489
410.8092995737984660.3814008524030680.190700426201534
420.7784982357227320.4430035285545370.221501764277268
430.876507411981310.2469851760373810.123492588018690
440.8371891015468140.3256217969063730.162810898453186
450.804127690551860.3917446188962780.195872309448139
460.7424854168440920.5150291663118160.257514583155908
470.6947217620340930.6105564759318140.305278237965907
480.7055147375295650.588970524940870.294485262470435
490.6381286959292520.7237426081414970.361871304070748
500.4695687528268790.9391375056537580.530431247173121


Meta Analysis of Goldfeld-Quandt test for Heteroskedasticity
Description# significant tests% significant testsOK/NOK
1% type I error level00OK
5% type I error level00OK
10% type I error level10.0217391304347826OK

\begin{tabular}{lllllllll}
\hline
Meta Analysis of Goldfeld-Quandt test for Heteroskedasticity \tabularnewline
Description & # significant tests & % significant tests & OK/NOK \tabularnewline
1% type I error level & 0 & 0 & OK \tabularnewline
5% type I error level & 0 & 0 & OK \tabularnewline
10% type I error level & 1 & 0.0217391304347826 & OK \tabularnewline
\hline
\end{tabular}
%Source: https://freestatistics.org/blog/index.php?pk=98171&T=6

[TABLE]
[ROW][C]Meta Analysis of Goldfeld-Quandt test for Heteroskedasticity[/C][/ROW]
[ROW][C]Description[/C][C]# significant tests[/C][C]% significant tests[/C][C]OK/NOK[/C][/ROW]
[ROW][C]1% type I error level[/C][C]0[/C][C]0[/C][C]OK[/C][/ROW]
[ROW][C]5% type I error level[/C][C]0[/C][C]0[/C][C]OK[/C][/ROW]
[ROW][C]10% type I error level[/C][C]1[/C][C]0.0217391304347826[/C][C]OK[/C][/ROW]
[/TABLE]
Source: https://freestatistics.org/blog/index.php?pk=98171&T=6

Globally Unique Identifier (entire table): ba.freestatistics.org/blog/index.php?pk=98171&T=6

As an alternative you can also use a QR Code:  

The GUIDs for individual cells are displayed in the table below:

Meta Analysis of Goldfeld-Quandt test for Heteroskedasticity
Description# significant tests% significant testsOK/NOK
1% type I error level00OK
5% type I error level00OK
10% type I error level10.0217391304347826OK


Parameters (Session):
par1 = 1 ; par2 = Do not include Seasonal Dummies ; par3 = No Linear Trend ;
Parameters (R input):
par1 = 1 ; par2 = Do not include Seasonal Dummies ; par3 = No Linear Trend ;
R code (references can be found in the software module):
library(lattice)
library(lmtest)
n25 <- 25 #minimum number of obs. for Goldfeld-Quandt test
par1 <- as.numeric(par1)
x <- t(y)
k <- length(x[1,])
n <- length(x[,1])
x1 <- cbind(x[,par1], x[,1:k!=par1])
mycolnames <- c(colnames(x)[par1], colnames(x)[1:k!=par1])
colnames(x1) <- mycolnames #colnames(x)[par1]
x <- x1
if (par3 == 'First Differences'){
x2 <- array(0, dim=c(n-1,k), dimnames=list(1:(n-1), paste('(1-B)',colnames(x),sep='')))
for (i in 1:n-1) {
for (j in 1:k) {
x2[i,j] <- x[i+1,j] - x[i,j]
}
}
x <- x2
}
if (par2 == 'Include Monthly Dummies'){
x2 <- array(0, dim=c(n,11), dimnames=list(1:n, paste('M', seq(1:11), sep ='')))
for (i in 1:11){
x2[seq(i,n,12),i] <- 1
}
x <- cbind(x, x2)
}
if (par2 == 'Include Quarterly Dummies'){
x2 <- array(0, dim=c(n,3), dimnames=list(1:n, paste('Q', seq(1:3), sep ='')))
for (i in 1:3){
x2[seq(i,n,4),i] <- 1
}
x <- cbind(x, x2)
}
k <- length(x[1,])
if (par3 == 'Linear Trend'){
x <- cbind(x, c(1:n))
colnames(x)[k+1] <- 't'
}
x
k <- length(x[1,])
df <- as.data.frame(x)
(mylm <- lm(df))
(mysum <- summary(mylm))
if (n > n25) {
kp3 <- k + 3
nmkm3 <- n - k - 3
gqarr <- array(NA, dim=c(nmkm3-kp3+1,3))
numgqtests <- 0
numsignificant1 <- 0
numsignificant5 <- 0
numsignificant10 <- 0
for (mypoint in kp3:nmkm3) {
j <- 0
numgqtests <- numgqtests + 1
for (myalt in c('greater', 'two.sided', 'less')) {
j <- j + 1
gqarr[mypoint-kp3+1,j] <- gqtest(mylm, point=mypoint, alternative=myalt)$p.value
}
if (gqarr[mypoint-kp3+1,2] < 0.01) numsignificant1 <- numsignificant1 + 1
if (gqarr[mypoint-kp3+1,2] < 0.05) numsignificant5 <- numsignificant5 + 1
if (gqarr[mypoint-kp3+1,2] < 0.10) numsignificant10 <- numsignificant10 + 1
}
gqarr
}
bitmap(file='test0.png')
plot(x[,1], type='l', main='Actuals and Interpolation', ylab='value of Actuals and Interpolation (dots)', xlab='time or index')
points(x[,1]-mysum$resid)
grid()
dev.off()
bitmap(file='test1.png')
plot(mysum$resid, type='b', pch=19, main='Residuals', ylab='value of Residuals', xlab='time or index')
grid()
dev.off()
bitmap(file='test2.png')
hist(mysum$resid, main='Residual Histogram', xlab='values of Residuals')
grid()
dev.off()
bitmap(file='test3.png')
densityplot(~mysum$resid,col='black',main='Residual Density Plot', xlab='values of Residuals')
dev.off()
bitmap(file='test4.png')
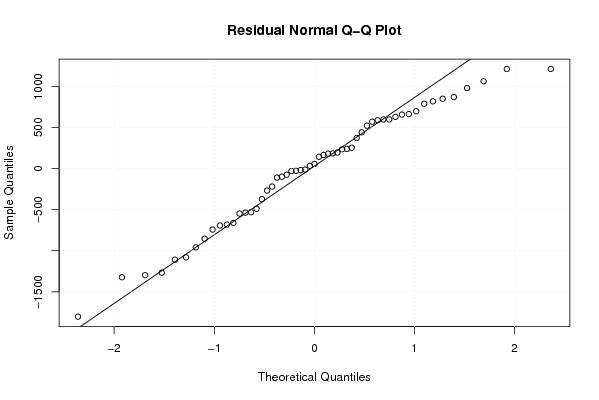
qqnorm(mysum$resid, main='Residual Normal Q-Q Plot')
qqline(mysum$resid)
grid()
dev.off()
(myerror <- as.ts(mysum$resid))
bitmap(file='test5.png')
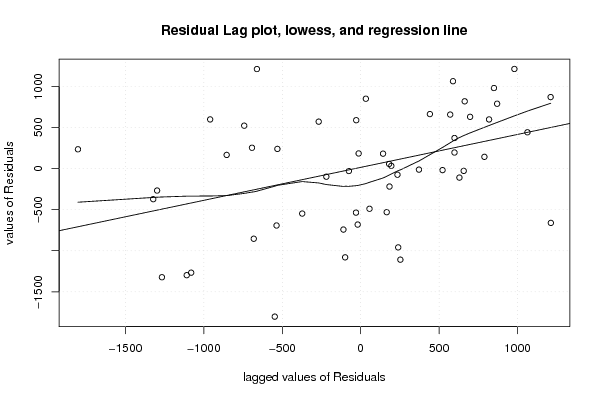
dum <- cbind(lag(myerror,k=1),myerror)
dum
dum1 <- dum[2:length(myerror),]
dum1
z <- as.data.frame(dum1)
z
plot(z,main=paste('Residual Lag plot, lowess, and regression line'), ylab='values of Residuals', xlab='lagged values of Residuals')
lines(lowess(z))
abline(lm(z))
grid()
dev.off()
bitmap(file='test6.png')
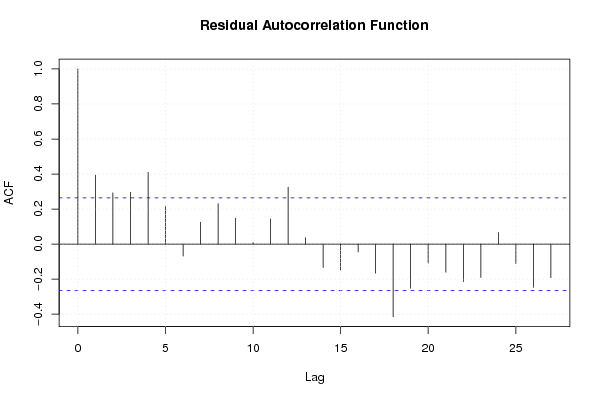
acf(mysum$resid, lag.max=length(mysum$resid)/2, main='Residual Autocorrelation Function')
grid()
dev.off()
bitmap(file='test7.png')
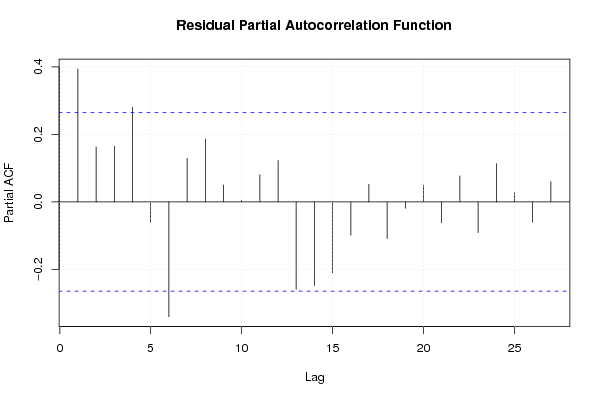
pacf(mysum$resid, lag.max=length(mysum$resid)/2, main='Residual Partial Autocorrelation Function')
grid()
dev.off()
bitmap(file='test8.png')
opar <- par(mfrow = c(2,2), oma = c(0, 0, 1.1, 0))
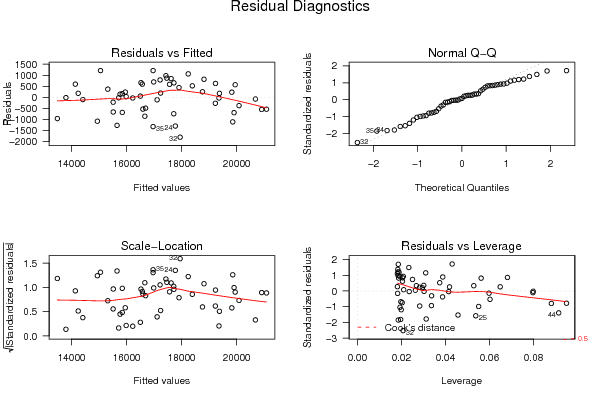
plot(mylm, las = 1, sub='Residual Diagnostics')
par(opar)
dev.off()
if (n > n25) {
bitmap(file='test9.png')
plot(kp3:nmkm3,gqarr[,2], main='Goldfeld-Quandt test',ylab='2-sided p-value',xlab='breakpoint')
grid()
dev.off()
}
load(file='createtable')
a<-table.start()
a<-table.row.start(a)
a<-table.element(a, 'Multiple Linear Regression - Estimated Regression Equation', 1, TRUE)
a<-table.row.end(a)
myeq <- colnames(x)[1]
myeq <- paste(myeq, '[t] = ', sep='')
for (i in 1:k){
if (mysum$coefficients[i,1] > 0) myeq <- paste(myeq, '+', '')
myeq <- paste(myeq, mysum$coefficients[i,1], sep=' ')
if (rownames(mysum$coefficients)[i] != '(Intercept)') {
myeq <- paste(myeq, rownames(mysum$coefficients)[i], sep='')
if (rownames(mysum$coefficients)[i] != 't') myeq <- paste(myeq, '[t]', sep='')
}
}
myeq <- paste(myeq, ' + e[t]')
a<-table.row.start(a)
a<-table.element(a, myeq)
a<-table.row.end(a)
a<-table.end(a)
table.save(a,file='mytable1.tab')
a<-table.start()
a<-table.row.start(a)
a<-table.element(a,hyperlink('ols1.htm','Multiple Linear Regression - Ordinary Least Squares',''), 6, TRUE)
a<-table.row.end(a)
a<-table.row.start(a)
a<-table.element(a,'Variable',header=TRUE)
a<-table.element(a,'Parameter',header=TRUE)
a<-table.element(a,'S.D.',header=TRUE)
a<-table.element(a,'T-STAT
H0: parameter = 0',header=TRUE)
a<-table.element(a,'2-tail p-value',header=TRUE)
a<-table.element(a,'1-tail p-value',header=TRUE)
a<-table.row.end(a)
for (i in 1:k){
a<-table.row.start(a)
a<-table.element(a,rownames(mysum$coefficients)[i],header=TRUE)
a<-table.element(a,mysum$coefficients[i,1])
a<-table.element(a, round(mysum$coefficients[i,2],6))
a<-table.element(a, round(mysum$coefficients[i,3],4))
a<-table.element(a, round(mysum$coefficients[i,4],6))
a<-table.element(a, round(mysum$coefficients[i,4]/2,6))
a<-table.row.end(a)
}
a<-table.end(a)
table.save(a,file='mytable2.tab')
a<-table.start()
a<-table.row.start(a)
a<-table.element(a, 'Multiple Linear Regression - Regression Statistics', 2, TRUE)
a<-table.row.end(a)
a<-table.row.start(a)
a<-table.element(a, 'Multiple R',1,TRUE)
a<-table.element(a, sqrt(mysum$r.squared))
a<-table.row.end(a)
a<-table.row.start(a)
a<-table.element(a, 'R-squared',1,TRUE)
a<-table.element(a, mysum$r.squared)
a<-table.row.end(a)
a<-table.row.start(a)
a<-table.element(a, 'Adjusted R-squared',1,TRUE)
a<-table.element(a, mysum$adj.r.squared)
a<-table.row.end(a)
a<-table.row.start(a)
a<-table.element(a, 'F-TEST (value)',1,TRUE)
a<-table.element(a, mysum$fstatistic[1])
a<-table.row.end(a)
a<-table.row.start(a)
a<-table.element(a, 'F-TEST (DF numerator)',1,TRUE)
a<-table.element(a, mysum$fstatistic[2])
a<-table.row.end(a)
a<-table.row.start(a)
a<-table.element(a, 'F-TEST (DF denominator)',1,TRUE)
a<-table.element(a, mysum$fstatistic[3])
a<-table.row.end(a)
a<-table.row.start(a)
a<-table.element(a, 'p-value',1,TRUE)
a<-table.element(a, 1-pf(mysum$fstatistic[1],mysum$fstatistic[2],mysum$fstatistic[3]))
a<-table.row.end(a)
a<-table.row.start(a)
a<-table.element(a, 'Multiple Linear Regression - Residual Statistics', 2, TRUE)
a<-table.row.end(a)
a<-table.row.start(a)
a<-table.element(a, 'Residual Standard Deviation',1,TRUE)
a<-table.element(a, mysum$sigma)
a<-table.row.end(a)
a<-table.row.start(a)
a<-table.element(a, 'Sum Squared Residuals',1,TRUE)
a<-table.element(a, sum(myerror*myerror))
a<-table.row.end(a)
a<-table.end(a)
table.save(a,file='mytable3.tab')
a<-table.start()
a<-table.row.start(a)
a<-table.element(a, 'Multiple Linear Regression - Actuals, Interpolation, and Residuals', 4, TRUE)
a<-table.row.end(a)
a<-table.row.start(a)
a<-table.element(a, 'Time or Index', 1, TRUE)
a<-table.element(a, 'Actuals', 1, TRUE)
a<-table.element(a, 'Interpolation
Forecast', 1, TRUE)
a<-table.element(a, 'Residuals
Prediction Error', 1, TRUE)
a<-table.row.end(a)
for (i in 1:n) {
a<-table.row.start(a)
a<-table.element(a,i, 1, TRUE)
a<-table.element(a,x[i])
a<-table.element(a,x[i]-mysum$resid[i])
a<-table.element(a,mysum$resid[i])
a<-table.row.end(a)
}
a<-table.end(a)
table.save(a,file='mytable4.tab')
if (n > n25) {
a<-table.start()
a<-table.row.start(a)
a<-table.element(a,'Goldfeld-Quandt test for Heteroskedasticity',4,TRUE)
a<-table.row.end(a)
a<-table.row.start(a)
a<-table.element(a,'p-values',header=TRUE)
a<-table.element(a,'Alternative Hypothesis',3,header=TRUE)
a<-table.row.end(a)
a<-table.row.start(a)
a<-table.element(a,'breakpoint index',header=TRUE)
a<-table.element(a,'greater',header=TRUE)
a<-table.element(a,'2-sided',header=TRUE)
a<-table.element(a,'less',header=TRUE)
a<-table.row.end(a)
for (mypoint in kp3:nmkm3) {
a<-table.row.start(a)
a<-table.element(a,mypoint,header=TRUE)
a<-table.element(a,gqarr[mypoint-kp3+1,1])
a<-table.element(a,gqarr[mypoint-kp3+1,2])
a<-table.element(a,gqarr[mypoint-kp3+1,3])
a<-table.row.end(a)
}
a<-table.end(a)
table.save(a,file='mytable5.tab')
a<-table.start()
a<-table.row.start(a)
a<-table.element(a,'Meta Analysis of Goldfeld-Quandt test for Heteroskedasticity',4,TRUE)
a<-table.row.end(a)
a<-table.row.start(a)
a<-table.element(a,'Description',header=TRUE)
a<-table.element(a,'# significant tests',header=TRUE)
a<-table.element(a,'% significant tests',header=TRUE)
a<-table.element(a,'OK/NOK',header=TRUE)
a<-table.row.end(a)
a<-table.row.start(a)
a<-table.element(a,'1% type I error level',header=TRUE)
a<-table.element(a,numsignificant1)
a<-table.element(a,numsignificant1/numgqtests)
if (numsignificant1/numgqtests < 0.01) dum <- 'OK' else dum <- 'NOK'
a<-table.element(a,dum)
a<-table.row.end(a)
a<-table.row.start(a)
a<-table.element(a,'5% type I error level',header=TRUE)
a<-table.element(a,numsignificant5)
a<-table.element(a,numsignificant5/numgqtests)
if (numsignificant5/numgqtests < 0.05) dum <- 'OK' else dum <- 'NOK'
a<-table.element(a,dum)
a<-table.row.end(a)
a<-table.row.start(a)
a<-table.element(a,'10% type I error level',header=TRUE)
a<-table.element(a,numsignificant10)
a<-table.element(a,numsignificant10/numgqtests)
if (numsignificant10/numgqtests < 0.1) dum <- 'OK' else dum <- 'NOK'
a<-table.element(a,dum)
a<-table.row.end(a)
a<-table.end(a)
table.save(a,file='mytable6.tab')
}