Free Statistics

of Irreproducible Research!

Author's title

Author*Unverified author*
R Software Modulerwasp_autocorrelation.wasp
Title produced by software(Partial) Autocorrelation Function
Date of computationSat, 20 Nov 2010 14:51:31 +0000
Cite this page as followsStatistical Computations at FreeStatistics.org, Office for Research Development and Education, URL https://freestatistics.org/blog/index.php?v=date/2010/Nov/20/t1290264595cuxs1hznafi0p3v.htm/, Retrieved Sat, 27 Apr 2024 15:13:17 +0000
Statistical Computations at FreeStatistics.org, Office for Research Development and Education, URL https://freestatistics.org/blog/index.php?pk=98219, Retrieved Sat, 27 Apr 2024 15:13:17 +0000
QR Codes:

Original text written by user:
IsPrivate?No (this computation is public)
User-defined keywordsKDGP2W12
Estimated Impact119
Family? (F = Feedback message, R = changed R code, M = changed R Module, P = changed Parameters, D = changed Data)
-       [(Partial) Autocorrelation Function] [Opgave 6 bis] [2010-11-20 14:51:31] [781993a4dd4effefeecf3b39fd55765b] [Current]
Feedback Forum

Post a new message
Dataseries X:
96.1
96.5
96.9
97.8
98.9
100.2
101.2
101
101.6
102.4
103.7
103.7
104.6
104.5
104.5
105.6
106.1
107.6
107.7
108.3
108.1
108.1
108
108.2
108.9
109.8
109.9
109.8
110.9
111.1
112.2
112.7
114.6
114.2
114.7
114.7
116
116.3
116.4
116.6
118.1
117.2
108.3
109.5
110.5
110.6
111.2
111.1
111
112.4
112.5
112.4
111.8
111.6
112.9
112.8
113.7
113.8
114
113.8
113.9
114.4
114.4
114.5
113.8
114.3
115
115.4
115.3
114.9
114.3
114.5
115.5
115.8
115.8
116
114.9
114.1
114.1
113.5
115
114.7
115.4
116.1
116.6
117.2
118.2
118
117.7
118.5
117.5
118
117.7
116.3
115
115.7
113.6
114.8
114.9
117.3
117.3
117.7
120
119.6
119.2
117.3
117.5
119
112.5
118.9
118.4
119.4
120.6
118.6
122
122.6
120.6
117.4
116.4
122.2
121
122.4
124.9
126.1
124.5
123.2
126.4
123.9
116
126.6
125.9
126.6
116.7
126.4
129
128.7
128.4
129.2
133.3
128.9
132.7
127.7
131.8
133.9


Summary of computational transaction
Raw Inputview raw input (R code)
Raw Outputview raw output of R engine
Computing time4 seconds
R Server'Gwilym Jenkins' @ 72.249.127.135

\begin{tabular}{lllllllll}
\hline
Summary of computational transaction \tabularnewline
Raw Input & view raw input (R code)  \tabularnewline
Raw Output & view raw output of R engine  \tabularnewline
Computing time & 4 seconds \tabularnewline
R Server & 'Gwilym Jenkins' @ 72.249.127.135 \tabularnewline
\hline
\end{tabular}
%Source: https://freestatistics.org/blog/index.php?pk=98219&T=0

[TABLE]
[ROW][C]Summary of computational transaction[/C][/ROW]
[ROW][C]Raw Input[/C][C]view raw input (R code) [/C][/ROW]
[ROW][C]Raw Output[/C][C]view raw output of R engine [/C][/ROW]
[ROW][C]Computing time[/C][C]4 seconds[/C][/ROW]
[ROW][C]R Server[/C][C]'Gwilym Jenkins' @ 72.249.127.135[/C][/ROW]
[/TABLE]
Source: https://freestatistics.org/blog/index.php?pk=98219&T=0

Globally Unique Identifier (entire table): ba.freestatistics.org/blog/index.php?pk=98219&T=0

As an alternative you can also use a QR Code:  

The GUIDs for individual cells are displayed in the table below:

Summary of computational transaction
Raw Inputview raw input (R code)
Raw Outputview raw output of R engine
Computing time4 seconds
R Server'Gwilym Jenkins' @ 72.249.127.135


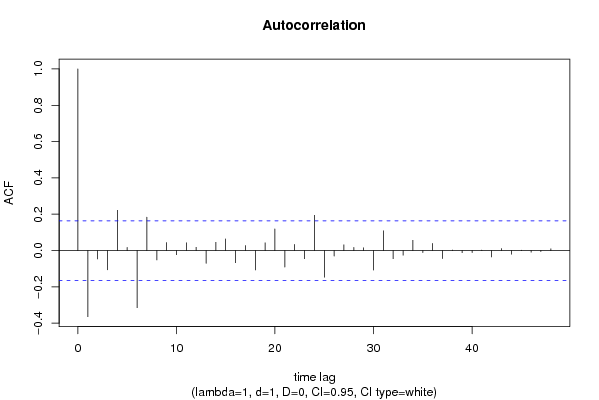
Autocorrelation Function
Time lag kACF(k)T-STATP-value
1-0.363929-4.3521.3e-05
2-0.045842-0.54820.292207
3-0.106044-1.26810.103412
40.2218432.65290.004442
50.0174420.20860.417536
6-0.314427-3.760.000123
70.1839742.20.014706
8-0.051912-0.62080.267866
90.0443110.52990.298509
10-0.02243-0.26820.394456
110.0428750.51270.304472
120.017850.21350.415639
13-0.070435-0.84230.20052
140.0453260.5420.294323
150.0637990.76290.223382
16-0.066495-0.79520.213917
170.0276250.33040.370809
18-0.107072-1.28040.10124
190.0427560.51130.304968
200.1193341.4270.077876
21-0.090839-1.08630.139593
220.0334350.39980.344939
23-0.044989-0.5380.295712
240.1941542.32170.010829
25-0.146551-1.75250.040916
26-0.030003-0.35880.360141
270.0318580.3810.351895
280.0169030.20210.420052
290.0153630.18370.427251
30-0.107314-1.28330.100734
310.1088781.3020.097506
32-0.044793-0.53560.296517
33-0.025649-0.30670.379754
340.0566790.67780.249503
35-0.010989-0.13140.447819
360.0395480.47290.318493
37-0.044013-0.52630.299741
380.0025290.03020.487958
39-0.011651-0.13930.444694
40-0.011374-0.1360.446
410.0024140.02890.488507
42-0.035044-0.41910.337898
430.01070.1280.449184
44-0.020089-0.24020.405248
450.0020680.02470.490154
46-0.00911-0.10890.456701
47-0.005347-0.06390.474551
480.009860.11790.453154

\begin{tabular}{lllllllll}
\hline
Autocorrelation Function \tabularnewline
Time lag k & ACF(k) & T-STAT & P-value \tabularnewline
1 & -0.363929 & -4.352 & 1.3e-05 \tabularnewline
2 & -0.045842 & -0.5482 & 0.292207 \tabularnewline
3 & -0.106044 & -1.2681 & 0.103412 \tabularnewline
4 & 0.221843 & 2.6529 & 0.004442 \tabularnewline
5 & 0.017442 & 0.2086 & 0.417536 \tabularnewline
6 & -0.314427 & -3.76 & 0.000123 \tabularnewline
7 & 0.183974 & 2.2 & 0.014706 \tabularnewline
8 & -0.051912 & -0.6208 & 0.267866 \tabularnewline
9 & 0.044311 & 0.5299 & 0.298509 \tabularnewline
10 & -0.02243 & -0.2682 & 0.394456 \tabularnewline
11 & 0.042875 & 0.5127 & 0.304472 \tabularnewline
12 & 0.01785 & 0.2135 & 0.415639 \tabularnewline
13 & -0.070435 & -0.8423 & 0.20052 \tabularnewline
14 & 0.045326 & 0.542 & 0.294323 \tabularnewline
15 & 0.063799 & 0.7629 & 0.223382 \tabularnewline
16 & -0.066495 & -0.7952 & 0.213917 \tabularnewline
17 & 0.027625 & 0.3304 & 0.370809 \tabularnewline
18 & -0.107072 & -1.2804 & 0.10124 \tabularnewline
19 & 0.042756 & 0.5113 & 0.304968 \tabularnewline
20 & 0.119334 & 1.427 & 0.077876 \tabularnewline
21 & -0.090839 & -1.0863 & 0.139593 \tabularnewline
22 & 0.033435 & 0.3998 & 0.344939 \tabularnewline
23 & -0.044989 & -0.538 & 0.295712 \tabularnewline
24 & 0.194154 & 2.3217 & 0.010829 \tabularnewline
25 & -0.146551 & -1.7525 & 0.040916 \tabularnewline
26 & -0.030003 & -0.3588 & 0.360141 \tabularnewline
27 & 0.031858 & 0.381 & 0.351895 \tabularnewline
28 & 0.016903 & 0.2021 & 0.420052 \tabularnewline
29 & 0.015363 & 0.1837 & 0.427251 \tabularnewline
30 & -0.107314 & -1.2833 & 0.100734 \tabularnewline
31 & 0.108878 & 1.302 & 0.097506 \tabularnewline
32 & -0.044793 & -0.5356 & 0.296517 \tabularnewline
33 & -0.025649 & -0.3067 & 0.379754 \tabularnewline
34 & 0.056679 & 0.6778 & 0.249503 \tabularnewline
35 & -0.010989 & -0.1314 & 0.447819 \tabularnewline
36 & 0.039548 & 0.4729 & 0.318493 \tabularnewline
37 & -0.044013 & -0.5263 & 0.299741 \tabularnewline
38 & 0.002529 & 0.0302 & 0.487958 \tabularnewline
39 & -0.011651 & -0.1393 & 0.444694 \tabularnewline
40 & -0.011374 & -0.136 & 0.446 \tabularnewline
41 & 0.002414 & 0.0289 & 0.488507 \tabularnewline
42 & -0.035044 & -0.4191 & 0.337898 \tabularnewline
43 & 0.0107 & 0.128 & 0.449184 \tabularnewline
44 & -0.020089 & -0.2402 & 0.405248 \tabularnewline
45 & 0.002068 & 0.0247 & 0.490154 \tabularnewline
46 & -0.00911 & -0.1089 & 0.456701 \tabularnewline
47 & -0.005347 & -0.0639 & 0.474551 \tabularnewline
48 & 0.00986 & 0.1179 & 0.453154 \tabularnewline
\hline
\end{tabular}
%Source: https://freestatistics.org/blog/index.php?pk=98219&T=1

[TABLE]
[ROW][C]Autocorrelation Function[/C][/ROW]
[ROW][C]Time lag k[/C][C]ACF(k)[/C][C]T-STAT[/C][C]P-value[/C][/ROW]
[ROW][C]1[/C][C]-0.363929[/C][C]-4.352[/C][C]1.3e-05[/C][/ROW]
[ROW][C]2[/C][C]-0.045842[/C][C]-0.5482[/C][C]0.292207[/C][/ROW]
[ROW][C]3[/C][C]-0.106044[/C][C]-1.2681[/C][C]0.103412[/C][/ROW]
[ROW][C]4[/C][C]0.221843[/C][C]2.6529[/C][C]0.004442[/C][/ROW]
[ROW][C]5[/C][C]0.017442[/C][C]0.2086[/C][C]0.417536[/C][/ROW]
[ROW][C]6[/C][C]-0.314427[/C][C]-3.76[/C][C]0.000123[/C][/ROW]
[ROW][C]7[/C][C]0.183974[/C][C]2.2[/C][C]0.014706[/C][/ROW]
[ROW][C]8[/C][C]-0.051912[/C][C]-0.6208[/C][C]0.267866[/C][/ROW]
[ROW][C]9[/C][C]0.044311[/C][C]0.5299[/C][C]0.298509[/C][/ROW]
[ROW][C]10[/C][C]-0.02243[/C][C]-0.2682[/C][C]0.394456[/C][/ROW]
[ROW][C]11[/C][C]0.042875[/C][C]0.5127[/C][C]0.304472[/C][/ROW]
[ROW][C]12[/C][C]0.01785[/C][C]0.2135[/C][C]0.415639[/C][/ROW]
[ROW][C]13[/C][C]-0.070435[/C][C]-0.8423[/C][C]0.20052[/C][/ROW]
[ROW][C]14[/C][C]0.045326[/C][C]0.542[/C][C]0.294323[/C][/ROW]
[ROW][C]15[/C][C]0.063799[/C][C]0.7629[/C][C]0.223382[/C][/ROW]
[ROW][C]16[/C][C]-0.066495[/C][C]-0.7952[/C][C]0.213917[/C][/ROW]
[ROW][C]17[/C][C]0.027625[/C][C]0.3304[/C][C]0.370809[/C][/ROW]
[ROW][C]18[/C][C]-0.107072[/C][C]-1.2804[/C][C]0.10124[/C][/ROW]
[ROW][C]19[/C][C]0.042756[/C][C]0.5113[/C][C]0.304968[/C][/ROW]
[ROW][C]20[/C][C]0.119334[/C][C]1.427[/C][C]0.077876[/C][/ROW]
[ROW][C]21[/C][C]-0.090839[/C][C]-1.0863[/C][C]0.139593[/C][/ROW]
[ROW][C]22[/C][C]0.033435[/C][C]0.3998[/C][C]0.344939[/C][/ROW]
[ROW][C]23[/C][C]-0.044989[/C][C]-0.538[/C][C]0.295712[/C][/ROW]
[ROW][C]24[/C][C]0.194154[/C][C]2.3217[/C][C]0.010829[/C][/ROW]
[ROW][C]25[/C][C]-0.146551[/C][C]-1.7525[/C][C]0.040916[/C][/ROW]
[ROW][C]26[/C][C]-0.030003[/C][C]-0.3588[/C][C]0.360141[/C][/ROW]
[ROW][C]27[/C][C]0.031858[/C][C]0.381[/C][C]0.351895[/C][/ROW]
[ROW][C]28[/C][C]0.016903[/C][C]0.2021[/C][C]0.420052[/C][/ROW]
[ROW][C]29[/C][C]0.015363[/C][C]0.1837[/C][C]0.427251[/C][/ROW]
[ROW][C]30[/C][C]-0.107314[/C][C]-1.2833[/C][C]0.100734[/C][/ROW]
[ROW][C]31[/C][C]0.108878[/C][C]1.302[/C][C]0.097506[/C][/ROW]
[ROW][C]32[/C][C]-0.044793[/C][C]-0.5356[/C][C]0.296517[/C][/ROW]
[ROW][C]33[/C][C]-0.025649[/C][C]-0.3067[/C][C]0.379754[/C][/ROW]
[ROW][C]34[/C][C]0.056679[/C][C]0.6778[/C][C]0.249503[/C][/ROW]
[ROW][C]35[/C][C]-0.010989[/C][C]-0.1314[/C][C]0.447819[/C][/ROW]
[ROW][C]36[/C][C]0.039548[/C][C]0.4729[/C][C]0.318493[/C][/ROW]
[ROW][C]37[/C][C]-0.044013[/C][C]-0.5263[/C][C]0.299741[/C][/ROW]
[ROW][C]38[/C][C]0.002529[/C][C]0.0302[/C][C]0.487958[/C][/ROW]
[ROW][C]39[/C][C]-0.011651[/C][C]-0.1393[/C][C]0.444694[/C][/ROW]
[ROW][C]40[/C][C]-0.011374[/C][C]-0.136[/C][C]0.446[/C][/ROW]
[ROW][C]41[/C][C]0.002414[/C][C]0.0289[/C][C]0.488507[/C][/ROW]
[ROW][C]42[/C][C]-0.035044[/C][C]-0.4191[/C][C]0.337898[/C][/ROW]
[ROW][C]43[/C][C]0.0107[/C][C]0.128[/C][C]0.449184[/C][/ROW]
[ROW][C]44[/C][C]-0.020089[/C][C]-0.2402[/C][C]0.405248[/C][/ROW]
[ROW][C]45[/C][C]0.002068[/C][C]0.0247[/C][C]0.490154[/C][/ROW]
[ROW][C]46[/C][C]-0.00911[/C][C]-0.1089[/C][C]0.456701[/C][/ROW]
[ROW][C]47[/C][C]-0.005347[/C][C]-0.0639[/C][C]0.474551[/C][/ROW]
[ROW][C]48[/C][C]0.00986[/C][C]0.1179[/C][C]0.453154[/C][/ROW]
[/TABLE]
Source: https://freestatistics.org/blog/index.php?pk=98219&T=1

Globally Unique Identifier (entire table): ba.freestatistics.org/blog/index.php?pk=98219&T=1

As an alternative you can also use a QR Code:  

The GUIDs for individual cells are displayed in the table below:

Autocorrelation Function
Time lag kACF(k)T-STATP-value
1-0.363929-4.3521.3e-05
2-0.045842-0.54820.292207
3-0.106044-1.26810.103412
40.2218432.65290.004442
50.0174420.20860.417536
6-0.314427-3.760.000123
70.1839742.20.014706
8-0.051912-0.62080.267866
90.0443110.52990.298509
10-0.02243-0.26820.394456
110.0428750.51270.304472
120.017850.21350.415639
13-0.070435-0.84230.20052
140.0453260.5420.294323
150.0637990.76290.223382
16-0.066495-0.79520.213917
170.0276250.33040.370809
18-0.107072-1.28040.10124
190.0427560.51130.304968
200.1193341.4270.077876
21-0.090839-1.08630.139593
220.0334350.39980.344939
23-0.044989-0.5380.295712
240.1941542.32170.010829
25-0.146551-1.75250.040916
26-0.030003-0.35880.360141
270.0318580.3810.351895
280.0169030.20210.420052
290.0153630.18370.427251
30-0.107314-1.28330.100734
310.1088781.3020.097506
32-0.044793-0.53560.296517
33-0.025649-0.30670.379754
340.0566790.67780.249503
35-0.010989-0.13140.447819
360.0395480.47290.318493
37-0.044013-0.52630.299741
380.0025290.03020.487958
39-0.011651-0.13930.444694
40-0.011374-0.1360.446
410.0024140.02890.488507
42-0.035044-0.41910.337898
430.01070.1280.449184
44-0.020089-0.24020.405248
450.0020680.02470.490154
46-0.00911-0.10890.456701
47-0.005347-0.06390.474551
480.009860.11790.453154


Partial Autocorrelation Function
Time lag kPACF(k)T-STATP-value
1-0.363929-4.3521.3e-05
2-0.205504-2.45750.007594
3-0.241835-2.89190.002214
40.0866071.03570.151053
50.1459681.74550.04152
6-0.270963-3.24020.000743
70.0069810.08350.466794
8-0.088162-1.05430.14677
9-0.090367-1.08060.140841
100.1143881.36790.086747
110.074420.88990.187498
12-0.009172-0.10970.456407
130.0106950.12790.449207
14-0.041947-0.50160.308356
150.0815970.97580.165415
160.0275080.32890.371339
170.06870.82150.206356
18-0.098756-1.1810.119791
19-0.127617-1.52610.0646
200.1491261.78330.038331
210.0133250.15930.436811
220.0522520.62480.266536
230.0723140.86480.194312
240.0781940.93510.175664
25-0.040966-0.48990.312484
260.0006660.0080.496831
27-0.008782-0.1050.458256
280.004170.04990.480148
290.0478860.57260.283895
30-0.023861-0.28530.387901
31-0.019665-0.23520.407213
32-0.021972-0.26270.396562
33-0.05682-0.67950.248969
340.0409640.48990.312494
350.0070890.08480.46628
360.0412170.49290.311424
370.0426210.50970.305532
38-0.049056-0.58660.279191
39-0.066349-0.79340.214426
40-0.009666-0.11560.454073
41-0.029767-0.3560.361196
42-0.00047-0.00560.497763
43-0.033231-0.39740.345839
44-0.138672-1.65830.049727
45-0.065878-0.78780.216062
46-0.067313-0.80490.211093
47-0.029655-0.35460.361699
48-0.018343-0.21940.413343

\begin{tabular}{lllllllll}
\hline
Partial Autocorrelation Function \tabularnewline
Time lag k & PACF(k) & T-STAT & P-value \tabularnewline
1 & -0.363929 & -4.352 & 1.3e-05 \tabularnewline
2 & -0.205504 & -2.4575 & 0.007594 \tabularnewline
3 & -0.241835 & -2.8919 & 0.002214 \tabularnewline
4 & 0.086607 & 1.0357 & 0.151053 \tabularnewline
5 & 0.145968 & 1.7455 & 0.04152 \tabularnewline
6 & -0.270963 & -3.2402 & 0.000743 \tabularnewline
7 & 0.006981 & 0.0835 & 0.466794 \tabularnewline
8 & -0.088162 & -1.0543 & 0.14677 \tabularnewline
9 & -0.090367 & -1.0806 & 0.140841 \tabularnewline
10 & 0.114388 & 1.3679 & 0.086747 \tabularnewline
11 & 0.07442 & 0.8899 & 0.187498 \tabularnewline
12 & -0.009172 & -0.1097 & 0.456407 \tabularnewline
13 & 0.010695 & 0.1279 & 0.449207 \tabularnewline
14 & -0.041947 & -0.5016 & 0.308356 \tabularnewline
15 & 0.081597 & 0.9758 & 0.165415 \tabularnewline
16 & 0.027508 & 0.3289 & 0.371339 \tabularnewline
17 & 0.0687 & 0.8215 & 0.206356 \tabularnewline
18 & -0.098756 & -1.181 & 0.119791 \tabularnewline
19 & -0.127617 & -1.5261 & 0.0646 \tabularnewline
20 & 0.149126 & 1.7833 & 0.038331 \tabularnewline
21 & 0.013325 & 0.1593 & 0.436811 \tabularnewline
22 & 0.052252 & 0.6248 & 0.266536 \tabularnewline
23 & 0.072314 & 0.8648 & 0.194312 \tabularnewline
24 & 0.078194 & 0.9351 & 0.175664 \tabularnewline
25 & -0.040966 & -0.4899 & 0.312484 \tabularnewline
26 & 0.000666 & 0.008 & 0.496831 \tabularnewline
27 & -0.008782 & -0.105 & 0.458256 \tabularnewline
28 & 0.00417 & 0.0499 & 0.480148 \tabularnewline
29 & 0.047886 & 0.5726 & 0.283895 \tabularnewline
30 & -0.023861 & -0.2853 & 0.387901 \tabularnewline
31 & -0.019665 & -0.2352 & 0.407213 \tabularnewline
32 & -0.021972 & -0.2627 & 0.396562 \tabularnewline
33 & -0.05682 & -0.6795 & 0.248969 \tabularnewline
34 & 0.040964 & 0.4899 & 0.312494 \tabularnewline
35 & 0.007089 & 0.0848 & 0.46628 \tabularnewline
36 & 0.041217 & 0.4929 & 0.311424 \tabularnewline
37 & 0.042621 & 0.5097 & 0.305532 \tabularnewline
38 & -0.049056 & -0.5866 & 0.279191 \tabularnewline
39 & -0.066349 & -0.7934 & 0.214426 \tabularnewline
40 & -0.009666 & -0.1156 & 0.454073 \tabularnewline
41 & -0.029767 & -0.356 & 0.361196 \tabularnewline
42 & -0.00047 & -0.0056 & 0.497763 \tabularnewline
43 & -0.033231 & -0.3974 & 0.345839 \tabularnewline
44 & -0.138672 & -1.6583 & 0.049727 \tabularnewline
45 & -0.065878 & -0.7878 & 0.216062 \tabularnewline
46 & -0.067313 & -0.8049 & 0.211093 \tabularnewline
47 & -0.029655 & -0.3546 & 0.361699 \tabularnewline
48 & -0.018343 & -0.2194 & 0.413343 \tabularnewline
\hline
\end{tabular}
%Source: https://freestatistics.org/blog/index.php?pk=98219&T=2

[TABLE]
[ROW][C]Partial Autocorrelation Function[/C][/ROW]
[ROW][C]Time lag k[/C][C]PACF(k)[/C][C]T-STAT[/C][C]P-value[/C][/ROW]
[ROW][C]1[/C][C]-0.363929[/C][C]-4.352[/C][C]1.3e-05[/C][/ROW]
[ROW][C]2[/C][C]-0.205504[/C][C]-2.4575[/C][C]0.007594[/C][/ROW]
[ROW][C]3[/C][C]-0.241835[/C][C]-2.8919[/C][C]0.002214[/C][/ROW]
[ROW][C]4[/C][C]0.086607[/C][C]1.0357[/C][C]0.151053[/C][/ROW]
[ROW][C]5[/C][C]0.145968[/C][C]1.7455[/C][C]0.04152[/C][/ROW]
[ROW][C]6[/C][C]-0.270963[/C][C]-3.2402[/C][C]0.000743[/C][/ROW]
[ROW][C]7[/C][C]0.006981[/C][C]0.0835[/C][C]0.466794[/C][/ROW]
[ROW][C]8[/C][C]-0.088162[/C][C]-1.0543[/C][C]0.14677[/C][/ROW]
[ROW][C]9[/C][C]-0.090367[/C][C]-1.0806[/C][C]0.140841[/C][/ROW]
[ROW][C]10[/C][C]0.114388[/C][C]1.3679[/C][C]0.086747[/C][/ROW]
[ROW][C]11[/C][C]0.07442[/C][C]0.8899[/C][C]0.187498[/C][/ROW]
[ROW][C]12[/C][C]-0.009172[/C][C]-0.1097[/C][C]0.456407[/C][/ROW]
[ROW][C]13[/C][C]0.010695[/C][C]0.1279[/C][C]0.449207[/C][/ROW]
[ROW][C]14[/C][C]-0.041947[/C][C]-0.5016[/C][C]0.308356[/C][/ROW]
[ROW][C]15[/C][C]0.081597[/C][C]0.9758[/C][C]0.165415[/C][/ROW]
[ROW][C]16[/C][C]0.027508[/C][C]0.3289[/C][C]0.371339[/C][/ROW]
[ROW][C]17[/C][C]0.0687[/C][C]0.8215[/C][C]0.206356[/C][/ROW]
[ROW][C]18[/C][C]-0.098756[/C][C]-1.181[/C][C]0.119791[/C][/ROW]
[ROW][C]19[/C][C]-0.127617[/C][C]-1.5261[/C][C]0.0646[/C][/ROW]
[ROW][C]20[/C][C]0.149126[/C][C]1.7833[/C][C]0.038331[/C][/ROW]
[ROW][C]21[/C][C]0.013325[/C][C]0.1593[/C][C]0.436811[/C][/ROW]
[ROW][C]22[/C][C]0.052252[/C][C]0.6248[/C][C]0.266536[/C][/ROW]
[ROW][C]23[/C][C]0.072314[/C][C]0.8648[/C][C]0.194312[/C][/ROW]
[ROW][C]24[/C][C]0.078194[/C][C]0.9351[/C][C]0.175664[/C][/ROW]
[ROW][C]25[/C][C]-0.040966[/C][C]-0.4899[/C][C]0.312484[/C][/ROW]
[ROW][C]26[/C][C]0.000666[/C][C]0.008[/C][C]0.496831[/C][/ROW]
[ROW][C]27[/C][C]-0.008782[/C][C]-0.105[/C][C]0.458256[/C][/ROW]
[ROW][C]28[/C][C]0.00417[/C][C]0.0499[/C][C]0.480148[/C][/ROW]
[ROW][C]29[/C][C]0.047886[/C][C]0.5726[/C][C]0.283895[/C][/ROW]
[ROW][C]30[/C][C]-0.023861[/C][C]-0.2853[/C][C]0.387901[/C][/ROW]
[ROW][C]31[/C][C]-0.019665[/C][C]-0.2352[/C][C]0.407213[/C][/ROW]
[ROW][C]32[/C][C]-0.021972[/C][C]-0.2627[/C][C]0.396562[/C][/ROW]
[ROW][C]33[/C][C]-0.05682[/C][C]-0.6795[/C][C]0.248969[/C][/ROW]
[ROW][C]34[/C][C]0.040964[/C][C]0.4899[/C][C]0.312494[/C][/ROW]
[ROW][C]35[/C][C]0.007089[/C][C]0.0848[/C][C]0.46628[/C][/ROW]
[ROW][C]36[/C][C]0.041217[/C][C]0.4929[/C][C]0.311424[/C][/ROW]
[ROW][C]37[/C][C]0.042621[/C][C]0.5097[/C][C]0.305532[/C][/ROW]
[ROW][C]38[/C][C]-0.049056[/C][C]-0.5866[/C][C]0.279191[/C][/ROW]
[ROW][C]39[/C][C]-0.066349[/C][C]-0.7934[/C][C]0.214426[/C][/ROW]
[ROW][C]40[/C][C]-0.009666[/C][C]-0.1156[/C][C]0.454073[/C][/ROW]
[ROW][C]41[/C][C]-0.029767[/C][C]-0.356[/C][C]0.361196[/C][/ROW]
[ROW][C]42[/C][C]-0.00047[/C][C]-0.0056[/C][C]0.497763[/C][/ROW]
[ROW][C]43[/C][C]-0.033231[/C][C]-0.3974[/C][C]0.345839[/C][/ROW]
[ROW][C]44[/C][C]-0.138672[/C][C]-1.6583[/C][C]0.049727[/C][/ROW]
[ROW][C]45[/C][C]-0.065878[/C][C]-0.7878[/C][C]0.216062[/C][/ROW]
[ROW][C]46[/C][C]-0.067313[/C][C]-0.8049[/C][C]0.211093[/C][/ROW]
[ROW][C]47[/C][C]-0.029655[/C][C]-0.3546[/C][C]0.361699[/C][/ROW]
[ROW][C]48[/C][C]-0.018343[/C][C]-0.2194[/C][C]0.413343[/C][/ROW]
[/TABLE]
Source: https://freestatistics.org/blog/index.php?pk=98219&T=2

Globally Unique Identifier (entire table): ba.freestatistics.org/blog/index.php?pk=98219&T=2

As an alternative you can also use a QR Code:  

The GUIDs for individual cells are displayed in the table below:

Partial Autocorrelation Function
Time lag kPACF(k)T-STATP-value
1-0.363929-4.3521.3e-05
2-0.205504-2.45750.007594
3-0.241835-2.89190.002214
40.0866071.03570.151053
50.1459681.74550.04152
6-0.270963-3.24020.000743
70.0069810.08350.466794
8-0.088162-1.05430.14677
9-0.090367-1.08060.140841
100.1143881.36790.086747
110.074420.88990.187498
12-0.009172-0.10970.456407
130.0106950.12790.449207
14-0.041947-0.50160.308356
150.0815970.97580.165415
160.0275080.32890.371339
170.06870.82150.206356
18-0.098756-1.1810.119791
19-0.127617-1.52610.0646
200.1491261.78330.038331
210.0133250.15930.436811
220.0522520.62480.266536
230.0723140.86480.194312
240.0781940.93510.175664
25-0.040966-0.48990.312484
260.0006660.0080.496831
27-0.008782-0.1050.458256
280.004170.04990.480148
290.0478860.57260.283895
30-0.023861-0.28530.387901
31-0.019665-0.23520.407213
32-0.021972-0.26270.396562
33-0.05682-0.67950.248969
340.0409640.48990.312494
350.0070890.08480.46628
360.0412170.49290.311424
370.0426210.50970.305532
38-0.049056-0.58660.279191
39-0.066349-0.79340.214426
40-0.009666-0.11560.454073
41-0.029767-0.3560.361196
42-0.00047-0.00560.497763
43-0.033231-0.39740.345839
44-0.138672-1.65830.049727
45-0.065878-0.78780.216062
46-0.067313-0.80490.211093
47-0.029655-0.35460.361699
48-0.018343-0.21940.413343


Parameters (Session):
par1 = 48 ; par2 = 1 ; par3 = 1 ; par4 = 0 ; par5 = 12 ; par6 = White Noise ; par7 = 0.95 ;
Parameters (R input):
par1 = 48 ; par2 = 1 ; par3 = 1 ; par4 = 0 ; par5 = 12 ; par6 = White Noise ; par7 = 0.95 ;
R code (references can be found in the software module):
if (par1 == 'Default') {
par1 = 10*log10(length(x))
} else {
par1 <- as.numeric(par1)
}
par2 <- as.numeric(par2)
par3 <- as.numeric(par3)
par4 <- as.numeric(par4)
par5 <- as.numeric(par5)
if (par6 == 'White Noise') par6 <- 'white' else par6 <- 'ma'
par7 <- as.numeric(par7)
if (par2 == 0) {
x <- log(x)
} else {
x <- (x ^ par2 - 1) / par2
}
if (par3 > 0) x <- diff(x,lag=1,difference=par3)
if (par4 > 0) x <- diff(x,lag=par5,difference=par4)
bitmap(file='pic1.png')
racf <- acf(x, par1, main='Autocorrelation', xlab='time lag', ylab='ACF', ci.type=par6, ci=par7, sub=paste('(lambda=',par2,', d=',par3,', D=',par4,', CI=', par7, ', CI type=',par6,')',sep=''))
dev.off()
bitmap(file='pic2.png')
rpacf <- pacf(x,par1,main='Partial Autocorrelation',xlab='lags',ylab='PACF')
dev.off()
(myacf <- c(racf$acf))
(mypacf <- c(rpacf$acf))
lengthx <- length(x)
sqrtn <- sqrt(lengthx)
load(file='createtable')
a<-table.start()
a<-table.row.start(a)
a<-table.element(a,'Autocorrelation Function',4,TRUE)
a<-table.row.end(a)
a<-table.row.start(a)
a<-table.element(a,'Time lag k',header=TRUE)
a<-table.element(a,hyperlink('basics.htm','ACF(k)','click here for more information about the Autocorrelation Function'),header=TRUE)
a<-table.element(a,'T-STAT',header=TRUE)
a<-table.element(a,'P-value',header=TRUE)
a<-table.row.end(a)
for (i in 2:(par1+1)) {
a<-table.row.start(a)
a<-table.element(a,i-1,header=TRUE)
a<-table.element(a,round(myacf[i],6))
mytstat <- myacf[i]*sqrtn
a<-table.element(a,round(mytstat,4))
a<-table.element(a,round(1-pt(abs(mytstat),lengthx),6))
a<-table.row.end(a)
}
a<-table.end(a)
table.save(a,file='mytable.tab')
a<-table.start()
a<-table.row.start(a)
a<-table.element(a,'Partial Autocorrelation Function',4,TRUE)
a<-table.row.end(a)
a<-table.row.start(a)
a<-table.element(a,'Time lag k',header=TRUE)
a<-table.element(a,hyperlink('basics.htm','PACF(k)','click here for more information about the Partial Autocorrelation Function'),header=TRUE)
a<-table.element(a,'T-STAT',header=TRUE)
a<-table.element(a,'P-value',header=TRUE)
a<-table.row.end(a)
for (i in 1:par1) {
a<-table.row.start(a)
a<-table.element(a,i,header=TRUE)
a<-table.element(a,round(mypacf[i],6))
mytstat <- mypacf[i]*sqrtn
a<-table.element(a,round(mytstat,4))
a<-table.element(a,round(1-pt(abs(mytstat),lengthx),6))
a<-table.row.end(a)
}
a<-table.end(a)
table.save(a,file='mytable1.tab')