Free Statistics
of Irreproducible Research!
Description of Statistical Computation | |||||||||||||||||||||||||||||||||||||||||
|---|---|---|---|---|---|---|---|---|---|---|---|---|---|---|---|---|---|---|---|---|---|---|---|---|---|---|---|---|---|---|---|---|---|---|---|---|---|---|---|---|---|
| Author's title | |||||||||||||||||||||||||||||||||||||||||
| Author | *The author of this computation has been verified* | ||||||||||||||||||||||||||||||||||||||||
| R Software Module | rwasp_univariatedataseries.wasp | ||||||||||||||||||||||||||||||||||||||||
| Title produced by software | Univariate Data Series | ||||||||||||||||||||||||||||||||||||||||
| Date of computation | Mon, 22 Nov 2010 18:58:42 +0000 | ||||||||||||||||||||||||||||||||||||||||
| Cite this page as follows | Statistical Computations at FreeStatistics.org, Office for Research Development and Education, URL https://freestatistics.org/blog/index.php?v=date/2010/Nov/22/t12904523160muqy9bvx700uzb.htm/, Retrieved Fri, 03 May 2024 18:23:06 +0000 | ||||||||||||||||||||||||||||||||||||||||
| Statistical Computations at FreeStatistics.org, Office for Research Development and Education, URL https://freestatistics.org/blog/index.php?pk=98656, Retrieved Fri, 03 May 2024 18:23:06 +0000 | |||||||||||||||||||||||||||||||||||||||||
| QR Codes: | |||||||||||||||||||||||||||||||||||||||||
|
| |||||||||||||||||||||||||||||||||||||||||
| Original text written by user: | |||||||||||||||||||||||||||||||||||||||||
| IsPrivate? | No (this computation is public) | ||||||||||||||||||||||||||||||||||||||||
| User-defined keywords | |||||||||||||||||||||||||||||||||||||||||
| Estimated Impact | 107 | ||||||||||||||||||||||||||||||||||||||||
Tree of Dependent Computations | |||||||||||||||||||||||||||||||||||||||||
| Family? (F = Feedback message, R = changed R code, M = changed R Module, P = changed Parameters, D = changed Data) | |||||||||||||||||||||||||||||||||||||||||
| - [Univariate Data Series] [] [2010-11-22 18:58:42] [b7dd4adfab743bef2d672ff51f950617] [Current] | |||||||||||||||||||||||||||||||||||||||||
| Feedback Forum | |||||||||||||||||||||||||||||||||||||||||
Post a new message | |||||||||||||||||||||||||||||||||||||||||
Dataset | |||||||||||||||||||||||||||||||||||||||||
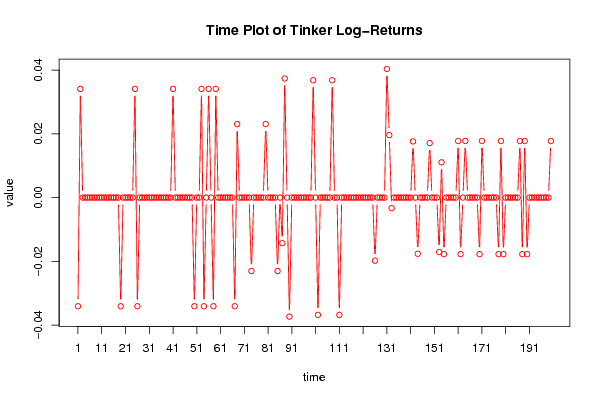
| Dataseries X: | |||||||||||||||||||||||||||||||||||||||||
-0.03409103533325 0.034091035333233 -4.9737991503207E-14 -4.9737991503207E-14 -4.9737991503207E-14 -4.9737991503207E-14 -4.9737991503207E-14 -4.9737991503207E-14 -4.9737991503207E-14 -4.9737991503207E-14 -4.9737991503207E-14 -4.9737991503207E-14 -4.9737991503207E-14 -4.9737991503207E-14 -4.9737991503207E-14 -4.9737991503207E-14 -4.9737991503207E-14 -4.9737991503207E-14 -0.03409103533325 3.3306690738755E-14 3.3306690738755E-14 3.3306690738755E-14 3.3306690738755E-14 3.3306690738755E-14 0.034091035333233 -0.03409103533325 3.3306690738755E-14 3.3306690738755E-14 3.3306690738755E-14 3.3306690738755E-14 3.3306690738755E-14 3.3306690738755E-14 3.3306690738755E-14 3.3306690738755E-14 3.3306690738755E-14 3.3306690738755E-14 3.3306690738755E-14 3.3306690738755E-14 3.3306690738755E-14 3.3306690738755E-14 0.034091035333233 -4.9737991503207E-14 -4.9737991503207E-14 -4.9737991503207E-14 -4.9737991503207E-14 -4.9737991503207E-14 -4.9737991503207E-14 -4.9737991503207E-14 -4.9737991503207E-14 -0.03409103533325 3.3306690738755E-14 3.3306690738755E-14 0.034091035333233 -0.03409103533325 3.3306690738755E-14 0.034091035333233 -4.9737991503207E-14 -0.03409103533325 0.034091035333233 -4.9737991503207E-14 -4.9737991503207E-14 -4.9737991503207E-14 -4.9737991503207E-14 -4.9737991503207E-14 -4.9737991503207E-14 -4.9737991503207E-14 -0.03409103533325 0.023041199146733 3.5527136788005E-14 3.5527136788005E-14 3.5527136788005E-14 3.5527136788005E-14 3.5527136788005E-14 -0.023041199146665 3.3306690738755E-14 3.3306690738755E-14 3.3306690738755E-14 3.3306690738755E-14 3.3306690738755E-14 0.023041199146733 3.5527136788005E-14 3.5527136788005E-14 3.5527136788005E-14 3.5527136788005E-14 -0.023041199146665 3.3306690738755E-14 -0.014314587397067 0.037355786543804 3.5527136788005E-14 -0.037355786543765 3.9968028886506E-15 3.9968028886506E-15 3.9968028886506E-15 3.9968028886506E-15 3.9968028886506E-15 3.9968028886506E-15 3.9968028886506E-15 3.9968028886506E-15 3.9968028886506E-15 0.036800076610004 -4.1744385725906E-14 -0.036800076610042 3.9968028886506E-15 3.9968028886506E-15 3.9968028886506E-15 3.9968028886506E-15 3.9968028886506E-15 0.036800076610004 -4.1744385725906E-14 -4.1744385725906E-14 -0.036800076610042 3.9968028886506E-15 3.9968028886506E-15 3.9968028886506E-15 3.9968028886506E-15 3.9968028886506E-15 3.9968028886506E-15 3.9968028886506E-15 3.9968028886506E-15 3.9968028886506E-15 3.9968028886506E-15 3.9968028886506E-15 3.9968028886506E-15 3.9968028886506E-15 3.9968028886506E-15 -0.019802627296196 -1.5987211554602E-14 -1.5987211554602E-14 -1.5987211554602E-14 -1.5987211554602E-14 0.040351295523584 0.019581045199117 -0.0033296368164901 -4.1744385725906E-14 -4.1744385725906E-14 -4.1744385725906E-14 -4.1744385725906E-14 -4.1744385725906E-14 -4.1744385725906E-14 -4.1744385725906E-14 -4.1744385725906E-14 0.017631310723958 -1.9095836023553E-14 -0.017631310724019 -4.1744385725906E-14 -4.1744385725906E-14 -4.1744385725906E-14 -4.1744385725906E-14 0.017085011884958 2.4424906541753E-14 2.4424906541753E-14 2.4424906541753E-14 -0.017085011884975 0.011055944567558 -0.017748663358731 -3.6859404417555E-14 -3.6859404417555E-14 -3.6859404417555E-14 -3.6859404417555E-14 -3.6859404417555E-14 0.017748663358663 -0.017748663358731 -3.6859404417555E-14 0.017748663358663 -3.1086244689504E-14 -3.1086244689504E-14 -3.1086244689504E-14 -3.1086244689504E-14 -3.1086244689504E-14 -0.017748663358731 0.017748663358663 -3.1086244689504E-14 -3.1086244689504E-14 -3.1086244689504E-14 -3.1086244689504E-14 -3.1086244689504E-14 -3.1086244689504E-14 -0.017748663358731 0.017748663358663 -0.017748663358731 -3.6859404417555E-14 -3.6859404417555E-14 -3.6859404417555E-14 -3.6859404417555E-14 -3.6859404417555E-14 -3.6859404417555E-14 0.017748663358663 -0.017748663358731 0.017748663358663 -0.017748663358731 -3.6859404417555E-14 -3.6859404417555E-14 -3.6859404417555E-14 -3.6859404417555E-14 -3.6859404417555E-14 -3.6859404417555E-14 -3.6859404417555E-14 -3.6859404417555E-14 -3.6859404417555E-14 0.017748663358663 | |||||||||||||||||||||||||||||||||||||||||
Tables (Output of Computation) | |||||||||||||||||||||||||||||||||||||||||
| |||||||||||||||||||||||||||||||||||||||||
Figures (Output of Computation) | |||||||||||||||||||||||||||||||||||||||||
Input Parameters & R Code | |||||||||||||||||||||||||||||||||||||||||
| Parameters (Session): | |||||||||||||||||||||||||||||||||||||||||
| par1 = Tinker ; par3 = Time series of Xycoon Stock Exchange ; par4 = No season ; | |||||||||||||||||||||||||||||||||||||||||
| Parameters (R input): | |||||||||||||||||||||||||||||||||||||||||
| par1 = Tinker ; par2 = ; par3 = Time series of Xycoon Stock Exchange ; par4 = No season ; | |||||||||||||||||||||||||||||||||||||||||
| R code (references can be found in the software module): | |||||||||||||||||||||||||||||||||||||||||
if (par4 != 'No season') { | |||||||||||||||||||||||||||||||||||||||||