Free Statistics

of Irreproducible Research!

Author's title

Author*The author of this computation has been verified*
R Software Modulerwasp_multipleregression.wasp
Title produced by softwareMultiple Regression
Date of computationSun, 28 Nov 2010 10:30:02 +0000
Cite this page as followsStatistical Computations at FreeStatistics.org, Office for Research Development and Education, URL https://freestatistics.org/blog/index.php?v=date/2010/Nov/28/t1290940203lp14w7kk8agh8o9.htm/, Retrieved Fri, 03 May 2024 02:29:56 +0000
Statistical Computations at FreeStatistics.org, Office for Research Development and Education, URL https://freestatistics.org/blog/index.php?pk=102480, Retrieved Fri, 03 May 2024 02:29:56 +0000
QR Codes:

Original text written by user:
IsPrivate?No (this computation is public)
User-defined keywords
Estimated Impact204
Family? (F = Feedback message, R = changed R code, M = changed R Module, P = changed Parameters, D = changed Data)
-     [Multiple Regression] [HPC Retail Sales] [2008-03-08 13:40:54] [1c0f2c85e8a48e42648374b3bcceca26]
-  MPD    [Multiple Regression] [WS8 - Multiple Re...] [2010-11-28 10:30:02] [934c3727858e074bf543f25f5906ed72] [Current]
-   PD      [Multiple Regression] [ws 8 multiple reg...] [2010-11-29 19:00:08] [8214fe6d084e5ad7598b249a26cc9f06]
-   PD      [Multiple Regression] [WS 8 - Multiple R...] [2010-11-29 20:22:31] [18fa53e8b37a5effc0c5f8a5122cdd2d]
-   PD      [Multiple Regression] [oilpricemulregr] [2010-11-30 20:36:28] [a8a0ff0853b70f438be515083758c362]
-   PD      [Multiple Regression] [Multiple Regressi...] [2010-12-14 18:49:45] [8ef49741e164ec6343c90c7935194465]
-   PD      [Multiple Regression] [The Science Exper...] [2010-12-14 21:51:22] [8ef49741e164ec6343c90c7935194465]
Feedback Forum

Post a new message
Dataseries X:
167.16
179.84
174.44
180.35
193.17
195.16
202.43
189.91
195.98
212.09
205.81
204.31
196.07
199.98
199.1
198.31
195.72
223.04
238.41
259.73
326.54
335.15
321.81
368.62
369.59
425
439.72
362.23
328.76
348.55
328.18
329.34
295.55
237.38
226.85
220.14
239.36
224.69
230.98
233.47
256.7
253.41
224.95
210.37
191.09
198.85
211.04
206.25


Summary of computational transaction
Raw Inputview raw input (R code)
Raw Outputview raw output of R engine
Computing time6 seconds
R Server'George Udny Yule' @ 72.249.76.132

\begin{tabular}{lllllllll}
\hline
Summary of computational transaction \tabularnewline
Raw Input & view raw input (R code)  \tabularnewline
Raw Output & view raw output of R engine  \tabularnewline
Computing time & 6 seconds \tabularnewline
R Server & 'George Udny Yule' @ 72.249.76.132 \tabularnewline
\hline
\end{tabular}
%Source: https://freestatistics.org/blog/index.php?pk=102480&T=0

[TABLE]
[ROW][C]Summary of computational transaction[/C][/ROW]
[ROW][C]Raw Input[/C][C]view raw input (R code) [/C][/ROW]
[ROW][C]Raw Output[/C][C]view raw output of R engine [/C][/ROW]
[ROW][C]Computing time[/C][C]6 seconds[/C][/ROW]
[ROW][C]R Server[/C][C]'George Udny Yule' @ 72.249.76.132[/C][/ROW]
[/TABLE]
Source: https://freestatistics.org/blog/index.php?pk=102480&T=0

Globally Unique Identifier (entire table): ba.freestatistics.org/blog/index.php?pk=102480&T=0

As an alternative you can also use a QR Code:  

The GUIDs for individual cells are displayed in the table below:

Summary of computational transaction
Raw Inputview raw input (R code)
Raw Outputview raw output of R engine
Computing time6 seconds
R Server'George Udny Yule' @ 72.249.76.132


Multiple Linear Regression - Estimated Regression Equation
Tarweprijs[t] = + 208.364583333333 + 8.41898611111109M1[t] + 21.3693055555555M2[t] + 23.6696249999998M3[t] + 4.81744444444434M4[t] + 3.43276388888875M5[t] + 13.5030833333332M6[t] + 5.57340277777767M7[t] + 3.0362222222221M8[t] + 6.60654166666655M9[t] -1.19813888888901M10[t] -7.07031944444457M11[t] + 1.38218055555556t + e[t]

\begin{tabular}{lllllllll}
\hline
Multiple Linear Regression - Estimated Regression Equation \tabularnewline
Tarweprijs[t] =  +  208.364583333333 +  8.41898611111109M1[t] +  21.3693055555555M2[t] +  23.6696249999998M3[t] +  4.81744444444434M4[t] +  3.43276388888875M5[t] +  13.5030833333332M6[t] +  5.57340277777767M7[t] +  3.0362222222221M8[t] +  6.60654166666655M9[t] -1.19813888888901M10[t] -7.07031944444457M11[t] +  1.38218055555556t  + e[t] \tabularnewline
\hline
\end{tabular}
%Source: https://freestatistics.org/blog/index.php?pk=102480&T=1

[TABLE]
[ROW][C]Multiple Linear Regression - Estimated Regression Equation[/C][/ROW]
[ROW][C]Tarweprijs[t] =  +  208.364583333333 +  8.41898611111109M1[t] +  21.3693055555555M2[t] +  23.6696249999998M3[t] +  4.81744444444434M4[t] +  3.43276388888875M5[t] +  13.5030833333332M6[t] +  5.57340277777767M7[t] +  3.0362222222221M8[t] +  6.60654166666655M9[t] -1.19813888888901M10[t] -7.07031944444457M11[t] +  1.38218055555556t  + e[t][/C][/ROW]
[/TABLE]
Source: https://freestatistics.org/blog/index.php?pk=102480&T=1

Globally Unique Identifier (entire table): ba.freestatistics.org/blog/index.php?pk=102480&T=1

As an alternative you can also use a QR Code:  

The GUIDs for individual cells are displayed in the table below:

Multiple Linear Regression - Estimated Regression Equation
Tarweprijs[t] = + 208.364583333333 + 8.41898611111109M1[t] + 21.3693055555555M2[t] + 23.6696249999998M3[t] + 4.81744444444434M4[t] + 3.43276388888875M5[t] + 13.5030833333332M6[t] + 5.57340277777767M7[t] + 3.0362222222221M8[t] + 6.60654166666655M9[t] -1.19813888888901M10[t] -7.07031944444457M11[t] + 1.38218055555556t + e[t]


Multiple Linear Regression - Ordinary Least Squares
VariableParameterS.D.T-STATH0: parameter = 02-tail p-value1-tail p-value
(Intercept)208.36458333333346.1157114.51836.8e-053.4e-05
M18.4189861111110955.5556950.15150.8804190.440209
M221.369305555555555.4241870.38560.7021570.351078
M323.669624999999855.3049350.4280.6712850.335642
M44.8174444444443455.1980170.08730.930950.465475
M53.4327638888887555.1035050.06230.9506810.475341
M613.503083333333255.0214630.24540.8075690.403784
M75.5734027777776754.9519480.10140.9197930.459897
M83.036222222222154.8950060.05530.9562060.478103
M96.6065416666665554.8506770.12040.9048190.452409
M10-1.1981388888890154.818992-0.02190.9826870.491343
M11-7.0703194444445754.799972-0.1290.898080.44904
t1.382180555555560.8336591.6580.1062610.053131

\begin{tabular}{lllllllll}
\hline
Multiple Linear Regression - Ordinary Least Squares \tabularnewline
Variable & Parameter & S.D. & T-STATH0: parameter = 0 & 2-tail p-value & 1-tail p-value \tabularnewline
(Intercept) & 208.364583333333 & 46.115711 & 4.5183 & 6.8e-05 & 3.4e-05 \tabularnewline
M1 & 8.41898611111109 & 55.555695 & 0.1515 & 0.880419 & 0.440209 \tabularnewline
M2 & 21.3693055555555 & 55.424187 & 0.3856 & 0.702157 & 0.351078 \tabularnewline
M3 & 23.6696249999998 & 55.304935 & 0.428 & 0.671285 & 0.335642 \tabularnewline
M4 & 4.81744444444434 & 55.198017 & 0.0873 & 0.93095 & 0.465475 \tabularnewline
M5 & 3.43276388888875 & 55.103505 & 0.0623 & 0.950681 & 0.475341 \tabularnewline
M6 & 13.5030833333332 & 55.021463 & 0.2454 & 0.807569 & 0.403784 \tabularnewline
M7 & 5.57340277777767 & 54.951948 & 0.1014 & 0.919793 & 0.459897 \tabularnewline
M8 & 3.0362222222221 & 54.895006 & 0.0553 & 0.956206 & 0.478103 \tabularnewline
M9 & 6.60654166666655 & 54.850677 & 0.1204 & 0.904819 & 0.452409 \tabularnewline
M10 & -1.19813888888901 & 54.818992 & -0.0219 & 0.982687 & 0.491343 \tabularnewline
M11 & -7.07031944444457 & 54.799972 & -0.129 & 0.89808 & 0.44904 \tabularnewline
t & 1.38218055555556 & 0.833659 & 1.658 & 0.106261 & 0.053131 \tabularnewline
\hline
\end{tabular}
%Source: https://freestatistics.org/blog/index.php?pk=102480&T=2

[TABLE]
[ROW][C]Multiple Linear Regression - Ordinary Least Squares[/C][/ROW]
[ROW][C]Variable[/C][C]Parameter[/C][C]S.D.[/C][C]T-STATH0: parameter = 0[/C][C]2-tail p-value[/C][C]1-tail p-value[/C][/ROW]
[ROW][C](Intercept)[/C][C]208.364583333333[/C][C]46.115711[/C][C]4.5183[/C][C]6.8e-05[/C][C]3.4e-05[/C][/ROW]
[ROW][C]M1[/C][C]8.41898611111109[/C][C]55.555695[/C][C]0.1515[/C][C]0.880419[/C][C]0.440209[/C][/ROW]
[ROW][C]M2[/C][C]21.3693055555555[/C][C]55.424187[/C][C]0.3856[/C][C]0.702157[/C][C]0.351078[/C][/ROW]
[ROW][C]M3[/C][C]23.6696249999998[/C][C]55.304935[/C][C]0.428[/C][C]0.671285[/C][C]0.335642[/C][/ROW]
[ROW][C]M4[/C][C]4.81744444444434[/C][C]55.198017[/C][C]0.0873[/C][C]0.93095[/C][C]0.465475[/C][/ROW]
[ROW][C]M5[/C][C]3.43276388888875[/C][C]55.103505[/C][C]0.0623[/C][C]0.950681[/C][C]0.475341[/C][/ROW]
[ROW][C]M6[/C][C]13.5030833333332[/C][C]55.021463[/C][C]0.2454[/C][C]0.807569[/C][C]0.403784[/C][/ROW]
[ROW][C]M7[/C][C]5.57340277777767[/C][C]54.951948[/C][C]0.1014[/C][C]0.919793[/C][C]0.459897[/C][/ROW]
[ROW][C]M8[/C][C]3.0362222222221[/C][C]54.895006[/C][C]0.0553[/C][C]0.956206[/C][C]0.478103[/C][/ROW]
[ROW][C]M9[/C][C]6.60654166666655[/C][C]54.850677[/C][C]0.1204[/C][C]0.904819[/C][C]0.452409[/C][/ROW]
[ROW][C]M10[/C][C]-1.19813888888901[/C][C]54.818992[/C][C]-0.0219[/C][C]0.982687[/C][C]0.491343[/C][/ROW]
[ROW][C]M11[/C][C]-7.07031944444457[/C][C]54.799972[/C][C]-0.129[/C][C]0.89808[/C][C]0.44904[/C][/ROW]
[ROW][C]t[/C][C]1.38218055555556[/C][C]0.833659[/C][C]1.658[/C][C]0.106261[/C][C]0.053131[/C][/ROW]
[/TABLE]
Source: https://freestatistics.org/blog/index.php?pk=102480&T=2

Globally Unique Identifier (entire table): ba.freestatistics.org/blog/index.php?pk=102480&T=2

As an alternative you can also use a QR Code:  

The GUIDs for individual cells are displayed in the table below:

Multiple Linear Regression - Ordinary Least Squares
VariableParameterS.D.T-STATH0: parameter = 02-tail p-value1-tail p-value
(Intercept)208.36458333333346.1157114.51836.8e-053.4e-05
M18.4189861111110955.5556950.15150.8804190.440209
M221.369305555555555.4241870.38560.7021570.351078
M323.669624999999855.3049350.4280.6712850.335642
M44.8174444444443455.1980170.08730.930950.465475
M53.4327638888887555.1035050.06230.9506810.475341
M613.503083333333255.0214630.24540.8075690.403784
M75.5734027777776754.9519480.10140.9197930.459897
M83.036222222222154.8950060.05530.9562060.478103
M96.6065416666665554.8506770.12040.9048190.452409
M10-1.1981388888890154.818992-0.02190.9826870.491343
M11-7.0703194444445754.799972-0.1290.898080.44904
t1.382180555555560.8336591.6580.1062610.053131


Multiple Linear Regression - Regression Statistics
Multiple R0.282450737254633
R-squared0.079778418975686
Adjusted R-squared-0.235726123089793
F-TEST (value)0.252859811314948
F-TEST (DF numerator)12
F-TEST (DF denominator)35
p-value0.992925806217615
Multiple Linear Regression - Residual Statistics
Residual Standard Deviation77.4898947639227
Sum Squared Residuals210163.932668333

\begin{tabular}{lllllllll}
\hline
Multiple Linear Regression - Regression Statistics \tabularnewline
Multiple R & 0.282450737254633 \tabularnewline
R-squared & 0.079778418975686 \tabularnewline
Adjusted R-squared & -0.235726123089793 \tabularnewline
F-TEST (value) & 0.252859811314948 \tabularnewline
F-TEST (DF numerator) & 12 \tabularnewline
F-TEST (DF denominator) & 35 \tabularnewline
p-value & 0.992925806217615 \tabularnewline
Multiple Linear Regression - Residual Statistics \tabularnewline
Residual Standard Deviation & 77.4898947639227 \tabularnewline
Sum Squared Residuals & 210163.932668333 \tabularnewline
\hline
\end{tabular}
%Source: https://freestatistics.org/blog/index.php?pk=102480&T=3

[TABLE]
[ROW][C]Multiple Linear Regression - Regression Statistics[/C][/ROW]
[ROW][C]Multiple R[/C][C]0.282450737254633[/C][/ROW]
[ROW][C]R-squared[/C][C]0.079778418975686[/C][/ROW]
[ROW][C]Adjusted R-squared[/C][C]-0.235726123089793[/C][/ROW]
[ROW][C]F-TEST (value)[/C][C]0.252859811314948[/C][/ROW]
[ROW][C]F-TEST (DF numerator)[/C][C]12[/C][/ROW]
[ROW][C]F-TEST (DF denominator)[/C][C]35[/C][/ROW]
[ROW][C]p-value[/C][C]0.992925806217615[/C][/ROW]
[ROW][C]Multiple Linear Regression - Residual Statistics[/C][/ROW]
[ROW][C]Residual Standard Deviation[/C][C]77.4898947639227[/C][/ROW]
[ROW][C]Sum Squared Residuals[/C][C]210163.932668333[/C][/ROW]
[/TABLE]
Source: https://freestatistics.org/blog/index.php?pk=102480&T=3

Globally Unique Identifier (entire table): ba.freestatistics.org/blog/index.php?pk=102480&T=3

As an alternative you can also use a QR Code:  

The GUIDs for individual cells are displayed in the table below:

Multiple Linear Regression - Regression Statistics
Multiple R0.282450737254633
R-squared0.079778418975686
Adjusted R-squared-0.235726123089793
F-TEST (value)0.252859811314948
F-TEST (DF numerator)12
F-TEST (DF denominator)35
p-value0.992925806217615
Multiple Linear Regression - Residual Statistics
Residual Standard Deviation77.4898947639227
Sum Squared Residuals210163.932668333


Multiple Linear Regression - Actuals, Interpolation, and Residuals
Time or IndexActualsInterpolationForecastResidualsPrediction Error
1167.16218.165750000000-51.0057499999998
2179.84232.49825-52.65825
3174.44236.18075-61.7407500000001
4180.35218.71075-38.36075
5193.17218.70825-25.5382500000001
6195.16230.16075-35.00075
7202.43223.61325-21.18325
8189.91222.45825-32.54825
9195.98227.41075-31.43075
10212.09220.98825-8.89825
11205.81216.49825-10.68825
12204.31224.95075-20.6407500000001
13196.07234.751916666667-38.6819166666669
14199.98249.084416666667-49.1044166666667
15199.1252.766916666667-53.6669166666666
16198.31235.296916666667-36.9869166666667
17195.72235.294416666667-39.5744166666667
18223.04246.746916666667-23.7069166666667
19238.41240.199416666667-1.78941666666668
20259.73239.04441666666720.6855833333334
21326.54243.99691666666782.5430833333333
22335.15237.57441666666797.5755833333333
23321.81233.08441666666788.7255833333333
24368.62241.536916666667127.083083333333
25369.59251.338083333333118.251916666667
26425265.670583333333159.329416666667
27439.72269.353083333333170.366916666667
28362.23251.883083333333110.346916666667
29328.76251.88058333333376.8794166666667
30348.55263.33308333333385.2169166666667
31328.18256.78558333333371.3944166666666
32329.34255.63058333333373.7094166666666
33295.55260.58308333333334.9669166666667
34237.38254.160583333333-16.7805833333333
35226.85249.670583333333-22.8205833333333
36220.14258.123083333333-37.9830833333335
37239.36267.92425-28.56425
38224.69282.25675-57.56675
39230.98285.93925-54.9592499999999
40233.47268.46925-34.9992500000000
41256.7268.46675-11.7667500000000
42253.41279.91925-26.50925
43224.95273.37175-48.42175
44210.37272.21675-61.84675
45191.09277.16925-86.07925
46198.85270.74675-71.89675
47211.04266.25675-55.21675
48206.25274.70925-68.4592500000001

\begin{tabular}{lllllllll}
\hline
Multiple Linear Regression - Actuals, Interpolation, and Residuals \tabularnewline
Time or Index & Actuals & InterpolationForecast & ResidualsPrediction Error \tabularnewline
1 & 167.16 & 218.165750000000 & -51.0057499999998 \tabularnewline
2 & 179.84 & 232.49825 & -52.65825 \tabularnewline
3 & 174.44 & 236.18075 & -61.7407500000001 \tabularnewline
4 & 180.35 & 218.71075 & -38.36075 \tabularnewline
5 & 193.17 & 218.70825 & -25.5382500000001 \tabularnewline
6 & 195.16 & 230.16075 & -35.00075 \tabularnewline
7 & 202.43 & 223.61325 & -21.18325 \tabularnewline
8 & 189.91 & 222.45825 & -32.54825 \tabularnewline
9 & 195.98 & 227.41075 & -31.43075 \tabularnewline
10 & 212.09 & 220.98825 & -8.89825 \tabularnewline
11 & 205.81 & 216.49825 & -10.68825 \tabularnewline
12 & 204.31 & 224.95075 & -20.6407500000001 \tabularnewline
13 & 196.07 & 234.751916666667 & -38.6819166666669 \tabularnewline
14 & 199.98 & 249.084416666667 & -49.1044166666667 \tabularnewline
15 & 199.1 & 252.766916666667 & -53.6669166666666 \tabularnewline
16 & 198.31 & 235.296916666667 & -36.9869166666667 \tabularnewline
17 & 195.72 & 235.294416666667 & -39.5744166666667 \tabularnewline
18 & 223.04 & 246.746916666667 & -23.7069166666667 \tabularnewline
19 & 238.41 & 240.199416666667 & -1.78941666666668 \tabularnewline
20 & 259.73 & 239.044416666667 & 20.6855833333334 \tabularnewline
21 & 326.54 & 243.996916666667 & 82.5430833333333 \tabularnewline
22 & 335.15 & 237.574416666667 & 97.5755833333333 \tabularnewline
23 & 321.81 & 233.084416666667 & 88.7255833333333 \tabularnewline
24 & 368.62 & 241.536916666667 & 127.083083333333 \tabularnewline
25 & 369.59 & 251.338083333333 & 118.251916666667 \tabularnewline
26 & 425 & 265.670583333333 & 159.329416666667 \tabularnewline
27 & 439.72 & 269.353083333333 & 170.366916666667 \tabularnewline
28 & 362.23 & 251.883083333333 & 110.346916666667 \tabularnewline
29 & 328.76 & 251.880583333333 & 76.8794166666667 \tabularnewline
30 & 348.55 & 263.333083333333 & 85.2169166666667 \tabularnewline
31 & 328.18 & 256.785583333333 & 71.3944166666666 \tabularnewline
32 & 329.34 & 255.630583333333 & 73.7094166666666 \tabularnewline
33 & 295.55 & 260.583083333333 & 34.9669166666667 \tabularnewline
34 & 237.38 & 254.160583333333 & -16.7805833333333 \tabularnewline
35 & 226.85 & 249.670583333333 & -22.8205833333333 \tabularnewline
36 & 220.14 & 258.123083333333 & -37.9830833333335 \tabularnewline
37 & 239.36 & 267.92425 & -28.56425 \tabularnewline
38 & 224.69 & 282.25675 & -57.56675 \tabularnewline
39 & 230.98 & 285.93925 & -54.9592499999999 \tabularnewline
40 & 233.47 & 268.46925 & -34.9992500000000 \tabularnewline
41 & 256.7 & 268.46675 & -11.7667500000000 \tabularnewline
42 & 253.41 & 279.91925 & -26.50925 \tabularnewline
43 & 224.95 & 273.37175 & -48.42175 \tabularnewline
44 & 210.37 & 272.21675 & -61.84675 \tabularnewline
45 & 191.09 & 277.16925 & -86.07925 \tabularnewline
46 & 198.85 & 270.74675 & -71.89675 \tabularnewline
47 & 211.04 & 266.25675 & -55.21675 \tabularnewline
48 & 206.25 & 274.70925 & -68.4592500000001 \tabularnewline
\hline
\end{tabular}
%Source: https://freestatistics.org/blog/index.php?pk=102480&T=4

[TABLE]
[ROW][C]Multiple Linear Regression - Actuals, Interpolation, and Residuals[/C][/ROW]
[ROW][C]Time or Index[/C][C]Actuals[/C][C]InterpolationForecast[/C][C]ResidualsPrediction Error[/C][/ROW]
[ROW][C]1[/C][C]167.16[/C][C]218.165750000000[/C][C]-51.0057499999998[/C][/ROW]
[ROW][C]2[/C][C]179.84[/C][C]232.49825[/C][C]-52.65825[/C][/ROW]
[ROW][C]3[/C][C]174.44[/C][C]236.18075[/C][C]-61.7407500000001[/C][/ROW]
[ROW][C]4[/C][C]180.35[/C][C]218.71075[/C][C]-38.36075[/C][/ROW]
[ROW][C]5[/C][C]193.17[/C][C]218.70825[/C][C]-25.5382500000001[/C][/ROW]
[ROW][C]6[/C][C]195.16[/C][C]230.16075[/C][C]-35.00075[/C][/ROW]
[ROW][C]7[/C][C]202.43[/C][C]223.61325[/C][C]-21.18325[/C][/ROW]
[ROW][C]8[/C][C]189.91[/C][C]222.45825[/C][C]-32.54825[/C][/ROW]
[ROW][C]9[/C][C]195.98[/C][C]227.41075[/C][C]-31.43075[/C][/ROW]
[ROW][C]10[/C][C]212.09[/C][C]220.98825[/C][C]-8.89825[/C][/ROW]
[ROW][C]11[/C][C]205.81[/C][C]216.49825[/C][C]-10.68825[/C][/ROW]
[ROW][C]12[/C][C]204.31[/C][C]224.95075[/C][C]-20.6407500000001[/C][/ROW]
[ROW][C]13[/C][C]196.07[/C][C]234.751916666667[/C][C]-38.6819166666669[/C][/ROW]
[ROW][C]14[/C][C]199.98[/C][C]249.084416666667[/C][C]-49.1044166666667[/C][/ROW]
[ROW][C]15[/C][C]199.1[/C][C]252.766916666667[/C][C]-53.6669166666666[/C][/ROW]
[ROW][C]16[/C][C]198.31[/C][C]235.296916666667[/C][C]-36.9869166666667[/C][/ROW]
[ROW][C]17[/C][C]195.72[/C][C]235.294416666667[/C][C]-39.5744166666667[/C][/ROW]
[ROW][C]18[/C][C]223.04[/C][C]246.746916666667[/C][C]-23.7069166666667[/C][/ROW]
[ROW][C]19[/C][C]238.41[/C][C]240.199416666667[/C][C]-1.78941666666668[/C][/ROW]
[ROW][C]20[/C][C]259.73[/C][C]239.044416666667[/C][C]20.6855833333334[/C][/ROW]
[ROW][C]21[/C][C]326.54[/C][C]243.996916666667[/C][C]82.5430833333333[/C][/ROW]
[ROW][C]22[/C][C]335.15[/C][C]237.574416666667[/C][C]97.5755833333333[/C][/ROW]
[ROW][C]23[/C][C]321.81[/C][C]233.084416666667[/C][C]88.7255833333333[/C][/ROW]
[ROW][C]24[/C][C]368.62[/C][C]241.536916666667[/C][C]127.083083333333[/C][/ROW]
[ROW][C]25[/C][C]369.59[/C][C]251.338083333333[/C][C]118.251916666667[/C][/ROW]
[ROW][C]26[/C][C]425[/C][C]265.670583333333[/C][C]159.329416666667[/C][/ROW]
[ROW][C]27[/C][C]439.72[/C][C]269.353083333333[/C][C]170.366916666667[/C][/ROW]
[ROW][C]28[/C][C]362.23[/C][C]251.883083333333[/C][C]110.346916666667[/C][/ROW]
[ROW][C]29[/C][C]328.76[/C][C]251.880583333333[/C][C]76.8794166666667[/C][/ROW]
[ROW][C]30[/C][C]348.55[/C][C]263.333083333333[/C][C]85.2169166666667[/C][/ROW]
[ROW][C]31[/C][C]328.18[/C][C]256.785583333333[/C][C]71.3944166666666[/C][/ROW]
[ROW][C]32[/C][C]329.34[/C][C]255.630583333333[/C][C]73.7094166666666[/C][/ROW]
[ROW][C]33[/C][C]295.55[/C][C]260.583083333333[/C][C]34.9669166666667[/C][/ROW]
[ROW][C]34[/C][C]237.38[/C][C]254.160583333333[/C][C]-16.7805833333333[/C][/ROW]
[ROW][C]35[/C][C]226.85[/C][C]249.670583333333[/C][C]-22.8205833333333[/C][/ROW]
[ROW][C]36[/C][C]220.14[/C][C]258.123083333333[/C][C]-37.9830833333335[/C][/ROW]
[ROW][C]37[/C][C]239.36[/C][C]267.92425[/C][C]-28.56425[/C][/ROW]
[ROW][C]38[/C][C]224.69[/C][C]282.25675[/C][C]-57.56675[/C][/ROW]
[ROW][C]39[/C][C]230.98[/C][C]285.93925[/C][C]-54.9592499999999[/C][/ROW]
[ROW][C]40[/C][C]233.47[/C][C]268.46925[/C][C]-34.9992500000000[/C][/ROW]
[ROW][C]41[/C][C]256.7[/C][C]268.46675[/C][C]-11.7667500000000[/C][/ROW]
[ROW][C]42[/C][C]253.41[/C][C]279.91925[/C][C]-26.50925[/C][/ROW]
[ROW][C]43[/C][C]224.95[/C][C]273.37175[/C][C]-48.42175[/C][/ROW]
[ROW][C]44[/C][C]210.37[/C][C]272.21675[/C][C]-61.84675[/C][/ROW]
[ROW][C]45[/C][C]191.09[/C][C]277.16925[/C][C]-86.07925[/C][/ROW]
[ROW][C]46[/C][C]198.85[/C][C]270.74675[/C][C]-71.89675[/C][/ROW]
[ROW][C]47[/C][C]211.04[/C][C]266.25675[/C][C]-55.21675[/C][/ROW]
[ROW][C]48[/C][C]206.25[/C][C]274.70925[/C][C]-68.4592500000001[/C][/ROW]
[/TABLE]
Source: https://freestatistics.org/blog/index.php?pk=102480&T=4

Globally Unique Identifier (entire table): ba.freestatistics.org/blog/index.php?pk=102480&T=4

As an alternative you can also use a QR Code:  

The GUIDs for individual cells are displayed in the table below:

Multiple Linear Regression - Actuals, Interpolation, and Residuals
Time or IndexActualsInterpolationForecastResidualsPrediction Error
1167.16218.165750000000-51.0057499999998
2179.84232.49825-52.65825
3174.44236.18075-61.7407500000001
4180.35218.71075-38.36075
5193.17218.70825-25.5382500000001
6195.16230.16075-35.00075
7202.43223.61325-21.18325
8189.91222.45825-32.54825
9195.98227.41075-31.43075
10212.09220.98825-8.89825
11205.81216.49825-10.68825
12204.31224.95075-20.6407500000001
13196.07234.751916666667-38.6819166666669
14199.98249.084416666667-49.1044166666667
15199.1252.766916666667-53.6669166666666
16198.31235.296916666667-36.9869166666667
17195.72235.294416666667-39.5744166666667
18223.04246.746916666667-23.7069166666667
19238.41240.199416666667-1.78941666666668
20259.73239.04441666666720.6855833333334
21326.54243.99691666666782.5430833333333
22335.15237.57441666666797.5755833333333
23321.81233.08441666666788.7255833333333
24368.62241.536916666667127.083083333333
25369.59251.338083333333118.251916666667
26425265.670583333333159.329416666667
27439.72269.353083333333170.366916666667
28362.23251.883083333333110.346916666667
29328.76251.88058333333376.8794166666667
30348.55263.33308333333385.2169166666667
31328.18256.78558333333371.3944166666666
32329.34255.63058333333373.7094166666666
33295.55260.58308333333334.9669166666667
34237.38254.160583333333-16.7805833333333
35226.85249.670583333333-22.8205833333333
36220.14258.123083333333-37.9830833333335
37239.36267.92425-28.56425
38224.69282.25675-57.56675
39230.98285.93925-54.9592499999999
40233.47268.46925-34.9992500000000
41256.7268.46675-11.7667500000000
42253.41279.91925-26.50925
43224.95273.37175-48.42175
44210.37272.21675-61.84675
45191.09277.16925-86.07925
46198.85270.74675-71.89675
47211.04266.25675-55.21675
48206.25274.70925-68.4592500000001


Goldfeld-Quandt test for Heteroskedasticity
p-valuesAlternative Hypothesis
breakpoint indexgreater2-sidedless
160.0001720264439974950.000344052887994990.999827973556003
170.0003439360088070460.0006878720176140920.999656063991193
180.0001016714217924910.0002033428435849810.999898328578207
198.15432960430235e-050.0001630865920860470.999918456703957
200.003432081405056920.006864162810113840.996567918594943
210.1251046653990750.2502093307981500.874895334600925
220.2009015455319550.401803091063910.799098454468045
230.2301133654943860.4602267309887730.769886634505614
240.3409353285251330.6818706570502650.659064671474867
250.3826143075465090.7652286150930180.617385692453491
260.6516778295000830.6966443409998340.348322170499917
270.9251042980850630.1497914038298730.0748957019149366
280.9166029346356740.1667941307286530.0833970653643265
290.8452959379886480.3094081240227040.154704062011352
300.7580074908117640.4839850183764720.241992509188236
310.6862399408490140.6275201183019720.313760059150986
320.7387794482326110.5224411035347780.261220551767389

\begin{tabular}{lllllllll}
\hline
Goldfeld-Quandt test for Heteroskedasticity \tabularnewline
p-values & Alternative Hypothesis \tabularnewline
breakpoint index & greater & 2-sided & less \tabularnewline
16 & 0.000172026443997495 & 0.00034405288799499 & 0.999827973556003 \tabularnewline
17 & 0.000343936008807046 & 0.000687872017614092 & 0.999656063991193 \tabularnewline
18 & 0.000101671421792491 & 0.000203342843584981 & 0.999898328578207 \tabularnewline
19 & 8.15432960430235e-05 & 0.000163086592086047 & 0.999918456703957 \tabularnewline
20 & 0.00343208140505692 & 0.00686416281011384 & 0.996567918594943 \tabularnewline
21 & 0.125104665399075 & 0.250209330798150 & 0.874895334600925 \tabularnewline
22 & 0.200901545531955 & 0.40180309106391 & 0.799098454468045 \tabularnewline
23 & 0.230113365494386 & 0.460226730988773 & 0.769886634505614 \tabularnewline
24 & 0.340935328525133 & 0.681870657050265 & 0.659064671474867 \tabularnewline
25 & 0.382614307546509 & 0.765228615093018 & 0.617385692453491 \tabularnewline
26 & 0.651677829500083 & 0.696644340999834 & 0.348322170499917 \tabularnewline
27 & 0.925104298085063 & 0.149791403829873 & 0.0748957019149366 \tabularnewline
28 & 0.916602934635674 & 0.166794130728653 & 0.0833970653643265 \tabularnewline
29 & 0.845295937988648 & 0.309408124022704 & 0.154704062011352 \tabularnewline
30 & 0.758007490811764 & 0.483985018376472 & 0.241992509188236 \tabularnewline
31 & 0.686239940849014 & 0.627520118301972 & 0.313760059150986 \tabularnewline
32 & 0.738779448232611 & 0.522441103534778 & 0.261220551767389 \tabularnewline
\hline
\end{tabular}
%Source: https://freestatistics.org/blog/index.php?pk=102480&T=5

[TABLE]
[ROW][C]Goldfeld-Quandt test for Heteroskedasticity[/C][/ROW]
[ROW][C]p-values[/C][C]Alternative Hypothesis[/C][/ROW]
[ROW][C]breakpoint index[/C][C]greater[/C][C]2-sided[/C][C]less[/C][/ROW]
[ROW][C]16[/C][C]0.000172026443997495[/C][C]0.00034405288799499[/C][C]0.999827973556003[/C][/ROW]
[ROW][C]17[/C][C]0.000343936008807046[/C][C]0.000687872017614092[/C][C]0.999656063991193[/C][/ROW]
[ROW][C]18[/C][C]0.000101671421792491[/C][C]0.000203342843584981[/C][C]0.999898328578207[/C][/ROW]
[ROW][C]19[/C][C]8.15432960430235e-05[/C][C]0.000163086592086047[/C][C]0.999918456703957[/C][/ROW]
[ROW][C]20[/C][C]0.00343208140505692[/C][C]0.00686416281011384[/C][C]0.996567918594943[/C][/ROW]
[ROW][C]21[/C][C]0.125104665399075[/C][C]0.250209330798150[/C][C]0.874895334600925[/C][/ROW]
[ROW][C]22[/C][C]0.200901545531955[/C][C]0.40180309106391[/C][C]0.799098454468045[/C][/ROW]
[ROW][C]23[/C][C]0.230113365494386[/C][C]0.460226730988773[/C][C]0.769886634505614[/C][/ROW]
[ROW][C]24[/C][C]0.340935328525133[/C][C]0.681870657050265[/C][C]0.659064671474867[/C][/ROW]
[ROW][C]25[/C][C]0.382614307546509[/C][C]0.765228615093018[/C][C]0.617385692453491[/C][/ROW]
[ROW][C]26[/C][C]0.651677829500083[/C][C]0.696644340999834[/C][C]0.348322170499917[/C][/ROW]
[ROW][C]27[/C][C]0.925104298085063[/C][C]0.149791403829873[/C][C]0.0748957019149366[/C][/ROW]
[ROW][C]28[/C][C]0.916602934635674[/C][C]0.166794130728653[/C][C]0.0833970653643265[/C][/ROW]
[ROW][C]29[/C][C]0.845295937988648[/C][C]0.309408124022704[/C][C]0.154704062011352[/C][/ROW]
[ROW][C]30[/C][C]0.758007490811764[/C][C]0.483985018376472[/C][C]0.241992509188236[/C][/ROW]
[ROW][C]31[/C][C]0.686239940849014[/C][C]0.627520118301972[/C][C]0.313760059150986[/C][/ROW]
[ROW][C]32[/C][C]0.738779448232611[/C][C]0.522441103534778[/C][C]0.261220551767389[/C][/ROW]
[/TABLE]
Source: https://freestatistics.org/blog/index.php?pk=102480&T=5

Globally Unique Identifier (entire table): ba.freestatistics.org/blog/index.php?pk=102480&T=5

As an alternative you can also use a QR Code:  

The GUIDs for individual cells are displayed in the table below:

Goldfeld-Quandt test for Heteroskedasticity
p-valuesAlternative Hypothesis
breakpoint indexgreater2-sidedless
160.0001720264439974950.000344052887994990.999827973556003
170.0003439360088070460.0006878720176140920.999656063991193
180.0001016714217924910.0002033428435849810.999898328578207
198.15432960430235e-050.0001630865920860470.999918456703957
200.003432081405056920.006864162810113840.996567918594943
210.1251046653990750.2502093307981500.874895334600925
220.2009015455319550.401803091063910.799098454468045
230.2301133654943860.4602267309887730.769886634505614
240.3409353285251330.6818706570502650.659064671474867
250.3826143075465090.7652286150930180.617385692453491
260.6516778295000830.6966443409998340.348322170499917
270.9251042980850630.1497914038298730.0748957019149366
280.9166029346356740.1667941307286530.0833970653643265
290.8452959379886480.3094081240227040.154704062011352
300.7580074908117640.4839850183764720.241992509188236
310.6862399408490140.6275201183019720.313760059150986
320.7387794482326110.5224411035347780.261220551767389


Meta Analysis of Goldfeld-Quandt test for Heteroskedasticity
Description# significant tests% significant testsOK/NOK
1% type I error level50.294117647058824NOK
5% type I error level50.294117647058824NOK
10% type I error level50.294117647058824NOK

\begin{tabular}{lllllllll}
\hline
Meta Analysis of Goldfeld-Quandt test for Heteroskedasticity \tabularnewline
Description & # significant tests & % significant tests & OK/NOK \tabularnewline
1% type I error level & 5 & 0.294117647058824 & NOK \tabularnewline
5% type I error level & 5 & 0.294117647058824 & NOK \tabularnewline
10% type I error level & 5 & 0.294117647058824 & NOK \tabularnewline
\hline
\end{tabular}
%Source: https://freestatistics.org/blog/index.php?pk=102480&T=6

[TABLE]
[ROW][C]Meta Analysis of Goldfeld-Quandt test for Heteroskedasticity[/C][/ROW]
[ROW][C]Description[/C][C]# significant tests[/C][C]% significant tests[/C][C]OK/NOK[/C][/ROW]
[ROW][C]1% type I error level[/C][C]5[/C][C]0.294117647058824[/C][C]NOK[/C][/ROW]
[ROW][C]5% type I error level[/C][C]5[/C][C]0.294117647058824[/C][C]NOK[/C][/ROW]
[ROW][C]10% type I error level[/C][C]5[/C][C]0.294117647058824[/C][C]NOK[/C][/ROW]
[/TABLE]
Source: https://freestatistics.org/blog/index.php?pk=102480&T=6

Globally Unique Identifier (entire table): ba.freestatistics.org/blog/index.php?pk=102480&T=6

As an alternative you can also use a QR Code:  

The GUIDs for individual cells are displayed in the table below:

Meta Analysis of Goldfeld-Quandt test for Heteroskedasticity
Description# significant tests% significant testsOK/NOK
1% type I error level50.294117647058824NOK
5% type I error level50.294117647058824NOK
10% type I error level50.294117647058824NOK


Parameters (Session):
par1 = additive ; par2 = 12 ;
Parameters (R input):
par1 = 1 ; par2 = Include Monthly Dummies ; par3 = Linear Trend ;
R code (references can be found in the software module):
library(lattice)
library(lmtest)
n25 <- 25 #minimum number of obs. for Goldfeld-Quandt test
par1 <- as.numeric(par1)
x <- t(y)
k <- length(x[1,])
n <- length(x[,1])
x1 <- cbind(x[,par1], x[,1:k!=par1])
mycolnames <- c(colnames(x)[par1], colnames(x)[1:k!=par1])
colnames(x1) <- mycolnames #colnames(x)[par1]
x <- x1
if (par3 == 'First Differences'){
x2 <- array(0, dim=c(n-1,k), dimnames=list(1:(n-1), paste('(1-B)',colnames(x),sep='')))
for (i in 1:n-1) {
for (j in 1:k) {
x2[i,j] <- x[i+1,j] - x[i,j]
}
}
x <- x2
}
if (par2 == 'Include Monthly Dummies'){
x2 <- array(0, dim=c(n,11), dimnames=list(1:n, paste('M', seq(1:11), sep ='')))
for (i in 1:11){
x2[seq(i,n,12),i] <- 1
}
x <- cbind(x, x2)
}
if (par2 == 'Include Quarterly Dummies'){
x2 <- array(0, dim=c(n,3), dimnames=list(1:n, paste('Q', seq(1:3), sep ='')))
for (i in 1:3){
x2[seq(i,n,4),i] <- 1
}
x <- cbind(x, x2)
}
k <- length(x[1,])
if (par3 == 'Linear Trend'){
x <- cbind(x, c(1:n))
colnames(x)[k+1] <- 't'
}
x
k <- length(x[1,])
df <- as.data.frame(x)
(mylm <- lm(df))
(mysum <- summary(mylm))
if (n > n25) {
kp3 <- k + 3
nmkm3 <- n - k - 3
gqarr <- array(NA, dim=c(nmkm3-kp3+1,3))
numgqtests <- 0
numsignificant1 <- 0
numsignificant5 <- 0
numsignificant10 <- 0
for (mypoint in kp3:nmkm3) {
j <- 0
numgqtests <- numgqtests + 1
for (myalt in c('greater', 'two.sided', 'less')) {
j <- j + 1
gqarr[mypoint-kp3+1,j] <- gqtest(mylm, point=mypoint, alternative=myalt)$p.value
}
if (gqarr[mypoint-kp3+1,2] < 0.01) numsignificant1 <- numsignificant1 + 1
if (gqarr[mypoint-kp3+1,2] < 0.05) numsignificant5 <- numsignificant5 + 1
if (gqarr[mypoint-kp3+1,2] < 0.10) numsignificant10 <- numsignificant10 + 1
}
gqarr
}
bitmap(file='test0.png')
plot(x[,1], type='l', main='Actuals and Interpolation', ylab='value of Actuals and Interpolation (dots)', xlab='time or index')
points(x[,1]-mysum$resid)
grid()
dev.off()
bitmap(file='test1.png')
plot(mysum$resid, type='b', pch=19, main='Residuals', ylab='value of Residuals', xlab='time or index')
grid()
dev.off()
bitmap(file='test2.png')
hist(mysum$resid, main='Residual Histogram', xlab='values of Residuals')
grid()
dev.off()
bitmap(file='test3.png')
densityplot(~mysum$resid,col='black',main='Residual Density Plot', xlab='values of Residuals')
dev.off()
bitmap(file='test4.png')
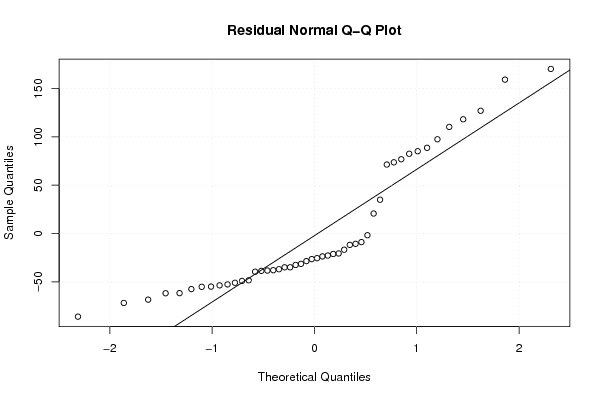
qqnorm(mysum$resid, main='Residual Normal Q-Q Plot')
qqline(mysum$resid)
grid()
dev.off()
(myerror <- as.ts(mysum$resid))
bitmap(file='test5.png')
dum <- cbind(lag(myerror,k=1),myerror)
dum
dum1 <- dum[2:length(myerror),]
dum1
z <- as.data.frame(dum1)
z
plot(z,main=paste('Residual Lag plot, lowess, and regression line'), ylab='values of Residuals', xlab='lagged values of Residuals')
lines(lowess(z))
abline(lm(z))
grid()
dev.off()
bitmap(file='test6.png')
acf(mysum$resid, lag.max=length(mysum$resid)/2, main='Residual Autocorrelation Function')
grid()
dev.off()
bitmap(file='test7.png')
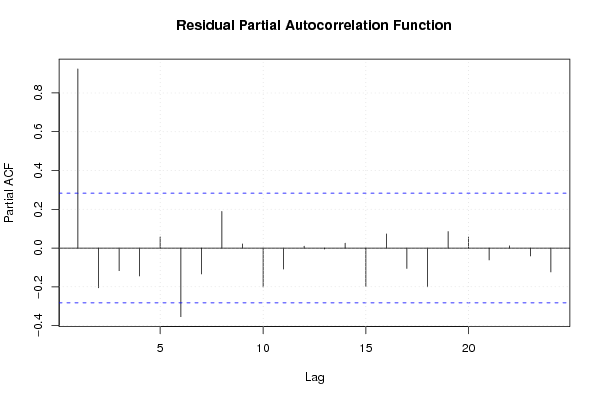
pacf(mysum$resid, lag.max=length(mysum$resid)/2, main='Residual Partial Autocorrelation Function')
grid()
dev.off()
bitmap(file='test8.png')
opar <- par(mfrow = c(2,2), oma = c(0, 0, 1.1, 0))
plot(mylm, las = 1, sub='Residual Diagnostics')
par(opar)
dev.off()
if (n > n25) {
bitmap(file='test9.png')
plot(kp3:nmkm3,gqarr[,2], main='Goldfeld-Quandt test',ylab='2-sided p-value',xlab='breakpoint')
grid()
dev.off()
}
load(file='createtable')
a<-table.start()
a<-table.row.start(a)
a<-table.element(a, 'Multiple Linear Regression - Estimated Regression Equation', 1, TRUE)
a<-table.row.end(a)
myeq <- colnames(x)[1]
myeq <- paste(myeq, '[t] = ', sep='')
for (i in 1:k){
if (mysum$coefficients[i,1] > 0) myeq <- paste(myeq, '+', '')
myeq <- paste(myeq, mysum$coefficients[i,1], sep=' ')
if (rownames(mysum$coefficients)[i] != '(Intercept)') {
myeq <- paste(myeq, rownames(mysum$coefficients)[i], sep='')
if (rownames(mysum$coefficients)[i] != 't') myeq <- paste(myeq, '[t]', sep='')
}
}
myeq <- paste(myeq, ' + e[t]')
a<-table.row.start(a)
a<-table.element(a, myeq)
a<-table.row.end(a)
a<-table.end(a)
table.save(a,file='mytable1.tab')
a<-table.start()
a<-table.row.start(a)
a<-table.element(a,hyperlink('ols1.htm','Multiple Linear Regression - Ordinary Least Squares',''), 6, TRUE)
a<-table.row.end(a)
a<-table.row.start(a)
a<-table.element(a,'Variable',header=TRUE)
a<-table.element(a,'Parameter',header=TRUE)
a<-table.element(a,'S.D.',header=TRUE)
a<-table.element(a,'T-STAT
H0: parameter = 0',header=TRUE)
a<-table.element(a,'2-tail p-value',header=TRUE)
a<-table.element(a,'1-tail p-value',header=TRUE)
a<-table.row.end(a)
for (i in 1:k){
a<-table.row.start(a)
a<-table.element(a,rownames(mysum$coefficients)[i],header=TRUE)
a<-table.element(a,mysum$coefficients[i,1])
a<-table.element(a, round(mysum$coefficients[i,2],6))
a<-table.element(a, round(mysum$coefficients[i,3],4))
a<-table.element(a, round(mysum$coefficients[i,4],6))
a<-table.element(a, round(mysum$coefficients[i,4]/2,6))
a<-table.row.end(a)
}
a<-table.end(a)
table.save(a,file='mytable2.tab')
a<-table.start()
a<-table.row.start(a)
a<-table.element(a, 'Multiple Linear Regression - Regression Statistics', 2, TRUE)
a<-table.row.end(a)
a<-table.row.start(a)
a<-table.element(a, 'Multiple R',1,TRUE)
a<-table.element(a, sqrt(mysum$r.squared))
a<-table.row.end(a)
a<-table.row.start(a)
a<-table.element(a, 'R-squared',1,TRUE)
a<-table.element(a, mysum$r.squared)
a<-table.row.end(a)
a<-table.row.start(a)
a<-table.element(a, 'Adjusted R-squared',1,TRUE)
a<-table.element(a, mysum$adj.r.squared)
a<-table.row.end(a)
a<-table.row.start(a)
a<-table.element(a, 'F-TEST (value)',1,TRUE)
a<-table.element(a, mysum$fstatistic[1])
a<-table.row.end(a)
a<-table.row.start(a)
a<-table.element(a, 'F-TEST (DF numerator)',1,TRUE)
a<-table.element(a, mysum$fstatistic[2])
a<-table.row.end(a)
a<-table.row.start(a)
a<-table.element(a, 'F-TEST (DF denominator)',1,TRUE)
a<-table.element(a, mysum$fstatistic[3])
a<-table.row.end(a)
a<-table.row.start(a)
a<-table.element(a, 'p-value',1,TRUE)
a<-table.element(a, 1-pf(mysum$fstatistic[1],mysum$fstatistic[2],mysum$fstatistic[3]))
a<-table.row.end(a)
a<-table.row.start(a)
a<-table.element(a, 'Multiple Linear Regression - Residual Statistics', 2, TRUE)
a<-table.row.end(a)
a<-table.row.start(a)
a<-table.element(a, 'Residual Standard Deviation',1,TRUE)
a<-table.element(a, mysum$sigma)
a<-table.row.end(a)
a<-table.row.start(a)
a<-table.element(a, 'Sum Squared Residuals',1,TRUE)
a<-table.element(a, sum(myerror*myerror))
a<-table.row.end(a)
a<-table.end(a)
table.save(a,file='mytable3.tab')
a<-table.start()
a<-table.row.start(a)
a<-table.element(a, 'Multiple Linear Regression - Actuals, Interpolation, and Residuals', 4, TRUE)
a<-table.row.end(a)
a<-table.row.start(a)
a<-table.element(a, 'Time or Index', 1, TRUE)
a<-table.element(a, 'Actuals', 1, TRUE)
a<-table.element(a, 'Interpolation
Forecast', 1, TRUE)
a<-table.element(a, 'Residuals
Prediction Error', 1, TRUE)
a<-table.row.end(a)
for (i in 1:n) {
a<-table.row.start(a)
a<-table.element(a,i, 1, TRUE)
a<-table.element(a,x[i])
a<-table.element(a,x[i]-mysum$resid[i])
a<-table.element(a,mysum$resid[i])
a<-table.row.end(a)
}
a<-table.end(a)
table.save(a,file='mytable4.tab')
if (n > n25) {
a<-table.start()
a<-table.row.start(a)
a<-table.element(a,'Goldfeld-Quandt test for Heteroskedasticity',4,TRUE)
a<-table.row.end(a)
a<-table.row.start(a)
a<-table.element(a,'p-values',header=TRUE)
a<-table.element(a,'Alternative Hypothesis',3,header=TRUE)
a<-table.row.end(a)
a<-table.row.start(a)
a<-table.element(a,'breakpoint index',header=TRUE)
a<-table.element(a,'greater',header=TRUE)
a<-table.element(a,'2-sided',header=TRUE)
a<-table.element(a,'less',header=TRUE)
a<-table.row.end(a)
for (mypoint in kp3:nmkm3) {
a<-table.row.start(a)
a<-table.element(a,mypoint,header=TRUE)
a<-table.element(a,gqarr[mypoint-kp3+1,1])
a<-table.element(a,gqarr[mypoint-kp3+1,2])
a<-table.element(a,gqarr[mypoint-kp3+1,3])
a<-table.row.end(a)
}
a<-table.end(a)
table.save(a,file='mytable5.tab')
a<-table.start()
a<-table.row.start(a)
a<-table.element(a,'Meta Analysis of Goldfeld-Quandt test for Heteroskedasticity',4,TRUE)
a<-table.row.end(a)
a<-table.row.start(a)
a<-table.element(a,'Description',header=TRUE)
a<-table.element(a,'# significant tests',header=TRUE)
a<-table.element(a,'% significant tests',header=TRUE)
a<-table.element(a,'OK/NOK',header=TRUE)
a<-table.row.end(a)
a<-table.row.start(a)
a<-table.element(a,'1% type I error level',header=TRUE)
a<-table.element(a,numsignificant1)
a<-table.element(a,numsignificant1/numgqtests)
if (numsignificant1/numgqtests < 0.01) dum <- 'OK' else dum <- 'NOK'
a<-table.element(a,dum)
a<-table.row.end(a)
a<-table.row.start(a)
a<-table.element(a,'5% type I error level',header=TRUE)
a<-table.element(a,numsignificant5)
a<-table.element(a,numsignificant5/numgqtests)
if (numsignificant5/numgqtests < 0.05) dum <- 'OK' else dum <- 'NOK'
a<-table.element(a,dum)
a<-table.row.end(a)
a<-table.row.start(a)
a<-table.element(a,'10% type I error level',header=TRUE)
a<-table.element(a,numsignificant10)
a<-table.element(a,numsignificant10/numgqtests)
if (numsignificant10/numgqtests < 0.1) dum <- 'OK' else dum <- 'NOK'
a<-table.element(a,dum)
a<-table.row.end(a)
a<-table.end(a)
table.save(a,file='mytable6.tab')
}