Free Statistics

of Irreproducible Research!

Author's title

Author*The author of this computation has been verified*
R Software Modulerwasp_multipleregression.wasp
Title produced by softwareMultiple Regression
Date of computationSun, 28 Nov 2010 15:26:32 +0000
Cite this page as followsStatistical Computations at FreeStatistics.org, Office for Research Development and Education, URL https://freestatistics.org/blog/index.php?v=date/2010/Nov/28/t1290958001cekcrwaotyzw7lt.htm/, Retrieved Thu, 02 May 2024 18:02:12 +0000
Statistical Computations at FreeStatistics.org, Office for Research Development and Education, URL https://freestatistics.org/blog/index.php?pk=102615, Retrieved Thu, 02 May 2024 18:02:12 +0000
QR Codes:

Original text written by user:
IsPrivate?No (this computation is public)
User-defined keywords
Estimated Impact212
Family? (F = Feedback message, R = changed R code, M = changed R Module, P = changed Parameters, D = changed Data)
-     [Multiple Regression] [Q1 The Seatbeltlaw] [2007-11-14 19:27:43] [8cd6641b921d30ebe00b648d1481bba0]
- RMPD  [Multiple Regression] [Seatbelt] [2009-11-12 13:54:52] [b98453cac15ba1066b407e146608df68]
- R PD    [Multiple Regression] [Aantal reizigers ...] [2010-11-26 01:03:33] [97ad38b1c3b35a5feca8b85f7bc7b3ff]
-   PD        [Multiple Regression] [monthly dummy] [2010-11-28 15:26:32] [7b4029fa8534fd52dfa7d68267386cff] [Current]
Feedback Forum

Post a new message
Dataseries X:
62.027
56.493
65.566
62.653
53.470
59.600
42.542
42.018
44.038
44.988
43.309
26.843
69.770
64.886
79.354
63.025
54.003
55.926
45.629
40.361
43.039
44.570
43.269
25.563
68.707
60.223
74.283
61.232
61.531
65.305
51.699
44.599
35.221
55.066
45.335
28.702
69.517
69.240
71.525
77.740
62.107
65.450
51.493
43.067
49.172
54.483
38.158
27.898
58.648
56.000
62.381
59.849
48.345
55.376
45.400
38.389
44.098
48.290
41.267
31.238


Summary of computational transaction
Raw Inputview raw input (R code)
Raw Outputview raw output of R engine
Computing time4 seconds
R Server'Sir Ronald Aylmer Fisher' @ 193.190.124.24

\begin{tabular}{lllllllll}
\hline
Summary of computational transaction \tabularnewline
Raw Input & view raw input (R code)  \tabularnewline
Raw Output & view raw output of R engine  \tabularnewline
Computing time & 4 seconds \tabularnewline
R Server & 'Sir Ronald Aylmer Fisher' @ 193.190.124.24 \tabularnewline
\hline
\end{tabular}
%Source: https://freestatistics.org/blog/index.php?pk=102615&T=0

[TABLE]
[ROW][C]Summary of computational transaction[/C][/ROW]
[ROW][C]Raw Input[/C][C]view raw input (R code) [/C][/ROW]
[ROW][C]Raw Output[/C][C]view raw output of R engine [/C][/ROW]
[ROW][C]Computing time[/C][C]4 seconds[/C][/ROW]
[ROW][C]R Server[/C][C]'Sir Ronald Aylmer Fisher' @ 193.190.124.24[/C][/ROW]
[/TABLE]
Source: https://freestatistics.org/blog/index.php?pk=102615&T=0

Globally Unique Identifier (entire table): ba.freestatistics.org/blog/index.php?pk=102615&T=0

As an alternative you can also use a QR Code:  

The GUIDs for individual cells are displayed in the table below:

Summary of computational transaction
Raw Inputview raw input (R code)
Raw Outputview raw output of R engine
Computing time4 seconds
R Server'Sir Ronald Aylmer Fisher' @ 193.190.124.24


Multiple Linear Regression - Estimated Regression Equation
Yt[t] = + 28.0488 + 37.685M1[t] + 33.3196M2[t] + 42.573M3[t] + 36.851M4[t] + 27.8424M5[t] + 32.2826M6[t] + 19.3038M7[t] + 13.638M8[t] + 15.0648M9[t] + 21.4306M10[t] + 14.2188M11[t] + e[t]

\begin{tabular}{lllllllll}
\hline
Multiple Linear Regression - Estimated Regression Equation \tabularnewline
Yt[t] =  +  28.0488 +  37.685M1[t] +  33.3196M2[t] +  42.573M3[t] +  36.851M4[t] +  27.8424M5[t] +  32.2826M6[t] +  19.3038M7[t] +  13.638M8[t] +  15.0648M9[t] +  21.4306M10[t] +  14.2188M11[t]  + e[t] \tabularnewline
\hline
\end{tabular}
%Source: https://freestatistics.org/blog/index.php?pk=102615&T=1

[TABLE]
[ROW][C]Multiple Linear Regression - Estimated Regression Equation[/C][/ROW]
[ROW][C]Yt[t] =  +  28.0488 +  37.685M1[t] +  33.3196M2[t] +  42.573M3[t] +  36.851M4[t] +  27.8424M5[t] +  32.2826M6[t] +  19.3038M7[t] +  13.638M8[t] +  15.0648M9[t] +  21.4306M10[t] +  14.2188M11[t]  + e[t][/C][/ROW]
[/TABLE]
Source: https://freestatistics.org/blog/index.php?pk=102615&T=1

Globally Unique Identifier (entire table): ba.freestatistics.org/blog/index.php?pk=102615&T=1

As an alternative you can also use a QR Code:  

The GUIDs for individual cells are displayed in the table below:

Multiple Linear Regression - Estimated Regression Equation
Yt[t] = + 28.0488 + 37.685M1[t] + 33.3196M2[t] + 42.573M3[t] + 36.851M4[t] + 27.8424M5[t] + 32.2826M6[t] + 19.3038M7[t] + 13.638M8[t] + 15.0648M9[t] + 21.4306M10[t] + 14.2188M11[t] + e[t]


Multiple Linear Regression - Ordinary Least Squares
VariableParameterS.D.T-STATH0: parameter = 02-tail p-value1-tail p-value
(Intercept)28.04882.23579912.545300
M137.6853.16189711.918500
M233.31963.16189710.537900
M342.5733.16189713.464400
M436.8513.16189711.654700
M527.84243.1618978.805600
M632.28263.16189710.209900
M719.30383.1618976.105100
M813.6383.1618974.31328e-054e-05
M915.06483.1618974.76451.8e-059e-06
M1021.43063.1618976.777800
M1114.21883.1618974.49694.4e-052.2e-05

\begin{tabular}{lllllllll}
\hline
Multiple Linear Regression - Ordinary Least Squares \tabularnewline
Variable & Parameter & S.D. & T-STATH0: parameter = 0 & 2-tail p-value & 1-tail p-value \tabularnewline
(Intercept) & 28.0488 & 2.235799 & 12.5453 & 0 & 0 \tabularnewline
M1 & 37.685 & 3.161897 & 11.9185 & 0 & 0 \tabularnewline
M2 & 33.3196 & 3.161897 & 10.5379 & 0 & 0 \tabularnewline
M3 & 42.573 & 3.161897 & 13.4644 & 0 & 0 \tabularnewline
M4 & 36.851 & 3.161897 & 11.6547 & 0 & 0 \tabularnewline
M5 & 27.8424 & 3.161897 & 8.8056 & 0 & 0 \tabularnewline
M6 & 32.2826 & 3.161897 & 10.2099 & 0 & 0 \tabularnewline
M7 & 19.3038 & 3.161897 & 6.1051 & 0 & 0 \tabularnewline
M8 & 13.638 & 3.161897 & 4.3132 & 8e-05 & 4e-05 \tabularnewline
M9 & 15.0648 & 3.161897 & 4.7645 & 1.8e-05 & 9e-06 \tabularnewline
M10 & 21.4306 & 3.161897 & 6.7778 & 0 & 0 \tabularnewline
M11 & 14.2188 & 3.161897 & 4.4969 & 4.4e-05 & 2.2e-05 \tabularnewline
\hline
\end{tabular}
%Source: https://freestatistics.org/blog/index.php?pk=102615&T=2

[TABLE]
[ROW][C]Multiple Linear Regression - Ordinary Least Squares[/C][/ROW]
[ROW][C]Variable[/C][C]Parameter[/C][C]S.D.[/C][C]T-STATH0: parameter = 0[/C][C]2-tail p-value[/C][C]1-tail p-value[/C][/ROW]
[ROW][C](Intercept)[/C][C]28.0488[/C][C]2.235799[/C][C]12.5453[/C][C]0[/C][C]0[/C][/ROW]
[ROW][C]M1[/C][C]37.685[/C][C]3.161897[/C][C]11.9185[/C][C]0[/C][C]0[/C][/ROW]
[ROW][C]M2[/C][C]33.3196[/C][C]3.161897[/C][C]10.5379[/C][C]0[/C][C]0[/C][/ROW]
[ROW][C]M3[/C][C]42.573[/C][C]3.161897[/C][C]13.4644[/C][C]0[/C][C]0[/C][/ROW]
[ROW][C]M4[/C][C]36.851[/C][C]3.161897[/C][C]11.6547[/C][C]0[/C][C]0[/C][/ROW]
[ROW][C]M5[/C][C]27.8424[/C][C]3.161897[/C][C]8.8056[/C][C]0[/C][C]0[/C][/ROW]
[ROW][C]M6[/C][C]32.2826[/C][C]3.161897[/C][C]10.2099[/C][C]0[/C][C]0[/C][/ROW]
[ROW][C]M7[/C][C]19.3038[/C][C]3.161897[/C][C]6.1051[/C][C]0[/C][C]0[/C][/ROW]
[ROW][C]M8[/C][C]13.638[/C][C]3.161897[/C][C]4.3132[/C][C]8e-05[/C][C]4e-05[/C][/ROW]
[ROW][C]M9[/C][C]15.0648[/C][C]3.161897[/C][C]4.7645[/C][C]1.8e-05[/C][C]9e-06[/C][/ROW]
[ROW][C]M10[/C][C]21.4306[/C][C]3.161897[/C][C]6.7778[/C][C]0[/C][C]0[/C][/ROW]
[ROW][C]M11[/C][C]14.2188[/C][C]3.161897[/C][C]4.4969[/C][C]4.4e-05[/C][C]2.2e-05[/C][/ROW]
[/TABLE]
Source: https://freestatistics.org/blog/index.php?pk=102615&T=2

Globally Unique Identifier (entire table): ba.freestatistics.org/blog/index.php?pk=102615&T=2

As an alternative you can also use a QR Code:  

The GUIDs for individual cells are displayed in the table below:

Multiple Linear Regression - Ordinary Least Squares
VariableParameterS.D.T-STATH0: parameter = 02-tail p-value1-tail p-value
(Intercept)28.04882.23579912.545300
M137.6853.16189711.918500
M233.31963.16189710.537900
M342.5733.16189713.464400
M436.8513.16189711.654700
M527.84243.1618978.805600
M632.28263.16189710.209900
M719.30383.1618976.105100
M813.6383.1618974.31328e-054e-05
M915.06483.1618974.76451.8e-059e-06
M1021.43063.1618976.777800
M1114.21883.1618974.49694.4e-052.2e-05


Multiple Linear Regression - Regression Statistics
Multiple R0.937837518790557
R-squared0.879539211651228
Adjusted R-squared0.851933614321301
F-TEST (value)31.8609012925698
F-TEST (DF numerator)11
F-TEST (DF denominator)48
p-value0
Multiple Linear Regression - Residual Statistics
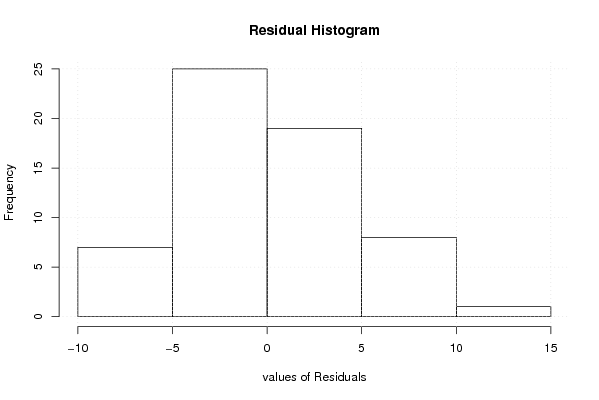
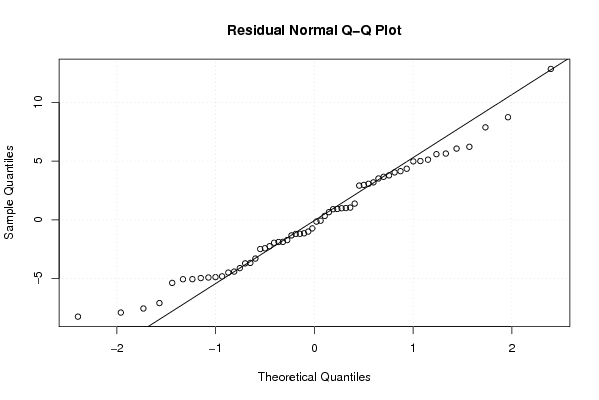
Residual Standard Deviation4.99939819294949
Sum Squared Residuals1199.71115

\begin{tabular}{lllllllll}
\hline
Multiple Linear Regression - Regression Statistics \tabularnewline
Multiple R & 0.937837518790557 \tabularnewline
R-squared & 0.879539211651228 \tabularnewline
Adjusted R-squared & 0.851933614321301 \tabularnewline
F-TEST (value) & 31.8609012925698 \tabularnewline
F-TEST (DF numerator) & 11 \tabularnewline
F-TEST (DF denominator) & 48 \tabularnewline
p-value & 0 \tabularnewline
Multiple Linear Regression - Residual Statistics \tabularnewline
Residual Standard Deviation & 4.99939819294949 \tabularnewline
Sum Squared Residuals & 1199.71115 \tabularnewline
\hline
\end{tabular}
%Source: https://freestatistics.org/blog/index.php?pk=102615&T=3

[TABLE]
[ROW][C]Multiple Linear Regression - Regression Statistics[/C][/ROW]
[ROW][C]Multiple R[/C][C]0.937837518790557[/C][/ROW]
[ROW][C]R-squared[/C][C]0.879539211651228[/C][/ROW]
[ROW][C]Adjusted R-squared[/C][C]0.851933614321301[/C][/ROW]
[ROW][C]F-TEST (value)[/C][C]31.8609012925698[/C][/ROW]
[ROW][C]F-TEST (DF numerator)[/C][C]11[/C][/ROW]
[ROW][C]F-TEST (DF denominator)[/C][C]48[/C][/ROW]
[ROW][C]p-value[/C][C]0[/C][/ROW]
[ROW][C]Multiple Linear Regression - Residual Statistics[/C][/ROW]
[ROW][C]Residual Standard Deviation[/C][C]4.99939819294949[/C][/ROW]
[ROW][C]Sum Squared Residuals[/C][C]1199.71115[/C][/ROW]
[/TABLE]
Source: https://freestatistics.org/blog/index.php?pk=102615&T=3

Globally Unique Identifier (entire table): ba.freestatistics.org/blog/index.php?pk=102615&T=3

As an alternative you can also use a QR Code:  

The GUIDs for individual cells are displayed in the table below:

Multiple Linear Regression - Regression Statistics
Multiple R0.937837518790557
R-squared0.879539211651228
Adjusted R-squared0.851933614321301
F-TEST (value)31.8609012925698
F-TEST (DF numerator)11
F-TEST (DF denominator)48
p-value0
Multiple Linear Regression - Residual Statistics
Residual Standard Deviation4.99939819294949
Sum Squared Residuals1199.71115


Multiple Linear Regression - Actuals, Interpolation, and Residuals
Time or IndexActualsInterpolationForecastResidualsPrediction Error
162.02765.7338-3.70680000000002
256.49361.3684-4.8754
365.56670.6218-5.0558
462.65364.8998-2.24679999999999
553.4755.8912-2.42120000000001
659.660.3314-0.731400000000003
742.54247.3526-4.8106
842.01841.68680.331199999999996
944.03843.11360.924400000000001
1044.98849.4794-4.4914
1143.30942.26761.04140000000000
1226.84328.0488-1.2058
1369.7765.73384.03620000000001
1464.88661.36843.5176
1579.35470.62188.7322
1663.02564.8998-1.8748
1754.00355.8912-1.88819999999999
1855.92660.3314-4.4054
1945.62947.3526-1.7236
2040.36141.6868-1.3258
2143.03943.1136-0.0745999999999968
2244.5749.4794-4.9094
2343.26942.26761.00140000000000
2425.56328.0488-2.4858
2568.70765.73382.9732
2660.22361.3684-1.14540000000000
2774.28370.62183.6612
2861.23264.8998-3.6678
2961.53155.89125.6398
3065.30560.33144.9736
3151.69947.35264.3464
3244.59941.68682.9122
3335.22143.1136-7.8926
3455.06649.47945.5866
3545.33542.26763.0674
3628.70228.04880.6532
3769.51765.73383.78320000000000
3869.2461.36847.8716
3971.52570.62180.903200000000004
4077.7464.899812.8402
4162.10755.89126.2158
4265.4560.33145.1186
4351.49347.35264.1404
4443.06741.68681.38020000000000
4549.17243.11366.0584
4654.48349.47945.0036
4738.15842.2676-4.1096
4827.89828.0488-0.150800000000001
4958.64865.7338-7.08579999999999
505661.3684-5.3684
5162.38170.6218-8.2408
5259.84964.8998-5.0508
5348.34555.8912-7.5462
5455.37660.3314-4.9554
5545.447.3526-1.9526
5638.38941.6868-3.29779999999999
5744.09843.11360.9844
5848.2949.4794-1.1894
5941.26742.2676-1.00060000000000
6031.23828.04883.1892

\begin{tabular}{lllllllll}
\hline
Multiple Linear Regression - Actuals, Interpolation, and Residuals \tabularnewline
Time or Index & Actuals & InterpolationForecast & ResidualsPrediction Error \tabularnewline
1 & 62.027 & 65.7338 & -3.70680000000002 \tabularnewline
2 & 56.493 & 61.3684 & -4.8754 \tabularnewline
3 & 65.566 & 70.6218 & -5.0558 \tabularnewline
4 & 62.653 & 64.8998 & -2.24679999999999 \tabularnewline
5 & 53.47 & 55.8912 & -2.42120000000001 \tabularnewline
6 & 59.6 & 60.3314 & -0.731400000000003 \tabularnewline
7 & 42.542 & 47.3526 & -4.8106 \tabularnewline
8 & 42.018 & 41.6868 & 0.331199999999996 \tabularnewline
9 & 44.038 & 43.1136 & 0.924400000000001 \tabularnewline
10 & 44.988 & 49.4794 & -4.4914 \tabularnewline
11 & 43.309 & 42.2676 & 1.04140000000000 \tabularnewline
12 & 26.843 & 28.0488 & -1.2058 \tabularnewline
13 & 69.77 & 65.7338 & 4.03620000000001 \tabularnewline
14 & 64.886 & 61.3684 & 3.5176 \tabularnewline
15 & 79.354 & 70.6218 & 8.7322 \tabularnewline
16 & 63.025 & 64.8998 & -1.8748 \tabularnewline
17 & 54.003 & 55.8912 & -1.88819999999999 \tabularnewline
18 & 55.926 & 60.3314 & -4.4054 \tabularnewline
19 & 45.629 & 47.3526 & -1.7236 \tabularnewline
20 & 40.361 & 41.6868 & -1.3258 \tabularnewline
21 & 43.039 & 43.1136 & -0.0745999999999968 \tabularnewline
22 & 44.57 & 49.4794 & -4.9094 \tabularnewline
23 & 43.269 & 42.2676 & 1.00140000000000 \tabularnewline
24 & 25.563 & 28.0488 & -2.4858 \tabularnewline
25 & 68.707 & 65.7338 & 2.9732 \tabularnewline
26 & 60.223 & 61.3684 & -1.14540000000000 \tabularnewline
27 & 74.283 & 70.6218 & 3.6612 \tabularnewline
28 & 61.232 & 64.8998 & -3.6678 \tabularnewline
29 & 61.531 & 55.8912 & 5.6398 \tabularnewline
30 & 65.305 & 60.3314 & 4.9736 \tabularnewline
31 & 51.699 & 47.3526 & 4.3464 \tabularnewline
32 & 44.599 & 41.6868 & 2.9122 \tabularnewline
33 & 35.221 & 43.1136 & -7.8926 \tabularnewline
34 & 55.066 & 49.4794 & 5.5866 \tabularnewline
35 & 45.335 & 42.2676 & 3.0674 \tabularnewline
36 & 28.702 & 28.0488 & 0.6532 \tabularnewline
37 & 69.517 & 65.7338 & 3.78320000000000 \tabularnewline
38 & 69.24 & 61.3684 & 7.8716 \tabularnewline
39 & 71.525 & 70.6218 & 0.903200000000004 \tabularnewline
40 & 77.74 & 64.8998 & 12.8402 \tabularnewline
41 & 62.107 & 55.8912 & 6.2158 \tabularnewline
42 & 65.45 & 60.3314 & 5.1186 \tabularnewline
43 & 51.493 & 47.3526 & 4.1404 \tabularnewline
44 & 43.067 & 41.6868 & 1.38020000000000 \tabularnewline
45 & 49.172 & 43.1136 & 6.0584 \tabularnewline
46 & 54.483 & 49.4794 & 5.0036 \tabularnewline
47 & 38.158 & 42.2676 & -4.1096 \tabularnewline
48 & 27.898 & 28.0488 & -0.150800000000001 \tabularnewline
49 & 58.648 & 65.7338 & -7.08579999999999 \tabularnewline
50 & 56 & 61.3684 & -5.3684 \tabularnewline
51 & 62.381 & 70.6218 & -8.2408 \tabularnewline
52 & 59.849 & 64.8998 & -5.0508 \tabularnewline
53 & 48.345 & 55.8912 & -7.5462 \tabularnewline
54 & 55.376 & 60.3314 & -4.9554 \tabularnewline
55 & 45.4 & 47.3526 & -1.9526 \tabularnewline
56 & 38.389 & 41.6868 & -3.29779999999999 \tabularnewline
57 & 44.098 & 43.1136 & 0.9844 \tabularnewline
58 & 48.29 & 49.4794 & -1.1894 \tabularnewline
59 & 41.267 & 42.2676 & -1.00060000000000 \tabularnewline
60 & 31.238 & 28.0488 & 3.1892 \tabularnewline
\hline
\end{tabular}
%Source: https://freestatistics.org/blog/index.php?pk=102615&T=4

[TABLE]
[ROW][C]Multiple Linear Regression - Actuals, Interpolation, and Residuals[/C][/ROW]
[ROW][C]Time or Index[/C][C]Actuals[/C][C]InterpolationForecast[/C][C]ResidualsPrediction Error[/C][/ROW]
[ROW][C]1[/C][C]62.027[/C][C]65.7338[/C][C]-3.70680000000002[/C][/ROW]
[ROW][C]2[/C][C]56.493[/C][C]61.3684[/C][C]-4.8754[/C][/ROW]
[ROW][C]3[/C][C]65.566[/C][C]70.6218[/C][C]-5.0558[/C][/ROW]
[ROW][C]4[/C][C]62.653[/C][C]64.8998[/C][C]-2.24679999999999[/C][/ROW]
[ROW][C]5[/C][C]53.47[/C][C]55.8912[/C][C]-2.42120000000001[/C][/ROW]
[ROW][C]6[/C][C]59.6[/C][C]60.3314[/C][C]-0.731400000000003[/C][/ROW]
[ROW][C]7[/C][C]42.542[/C][C]47.3526[/C][C]-4.8106[/C][/ROW]
[ROW][C]8[/C][C]42.018[/C][C]41.6868[/C][C]0.331199999999996[/C][/ROW]
[ROW][C]9[/C][C]44.038[/C][C]43.1136[/C][C]0.924400000000001[/C][/ROW]
[ROW][C]10[/C][C]44.988[/C][C]49.4794[/C][C]-4.4914[/C][/ROW]
[ROW][C]11[/C][C]43.309[/C][C]42.2676[/C][C]1.04140000000000[/C][/ROW]
[ROW][C]12[/C][C]26.843[/C][C]28.0488[/C][C]-1.2058[/C][/ROW]
[ROW][C]13[/C][C]69.77[/C][C]65.7338[/C][C]4.03620000000001[/C][/ROW]
[ROW][C]14[/C][C]64.886[/C][C]61.3684[/C][C]3.5176[/C][/ROW]
[ROW][C]15[/C][C]79.354[/C][C]70.6218[/C][C]8.7322[/C][/ROW]
[ROW][C]16[/C][C]63.025[/C][C]64.8998[/C][C]-1.8748[/C][/ROW]
[ROW][C]17[/C][C]54.003[/C][C]55.8912[/C][C]-1.88819999999999[/C][/ROW]
[ROW][C]18[/C][C]55.926[/C][C]60.3314[/C][C]-4.4054[/C][/ROW]
[ROW][C]19[/C][C]45.629[/C][C]47.3526[/C][C]-1.7236[/C][/ROW]
[ROW][C]20[/C][C]40.361[/C][C]41.6868[/C][C]-1.3258[/C][/ROW]
[ROW][C]21[/C][C]43.039[/C][C]43.1136[/C][C]-0.0745999999999968[/C][/ROW]
[ROW][C]22[/C][C]44.57[/C][C]49.4794[/C][C]-4.9094[/C][/ROW]
[ROW][C]23[/C][C]43.269[/C][C]42.2676[/C][C]1.00140000000000[/C][/ROW]
[ROW][C]24[/C][C]25.563[/C][C]28.0488[/C][C]-2.4858[/C][/ROW]
[ROW][C]25[/C][C]68.707[/C][C]65.7338[/C][C]2.9732[/C][/ROW]
[ROW][C]26[/C][C]60.223[/C][C]61.3684[/C][C]-1.14540000000000[/C][/ROW]
[ROW][C]27[/C][C]74.283[/C][C]70.6218[/C][C]3.6612[/C][/ROW]
[ROW][C]28[/C][C]61.232[/C][C]64.8998[/C][C]-3.6678[/C][/ROW]
[ROW][C]29[/C][C]61.531[/C][C]55.8912[/C][C]5.6398[/C][/ROW]
[ROW][C]30[/C][C]65.305[/C][C]60.3314[/C][C]4.9736[/C][/ROW]
[ROW][C]31[/C][C]51.699[/C][C]47.3526[/C][C]4.3464[/C][/ROW]
[ROW][C]32[/C][C]44.599[/C][C]41.6868[/C][C]2.9122[/C][/ROW]
[ROW][C]33[/C][C]35.221[/C][C]43.1136[/C][C]-7.8926[/C][/ROW]
[ROW][C]34[/C][C]55.066[/C][C]49.4794[/C][C]5.5866[/C][/ROW]
[ROW][C]35[/C][C]45.335[/C][C]42.2676[/C][C]3.0674[/C][/ROW]
[ROW][C]36[/C][C]28.702[/C][C]28.0488[/C][C]0.6532[/C][/ROW]
[ROW][C]37[/C][C]69.517[/C][C]65.7338[/C][C]3.78320000000000[/C][/ROW]
[ROW][C]38[/C][C]69.24[/C][C]61.3684[/C][C]7.8716[/C][/ROW]
[ROW][C]39[/C][C]71.525[/C][C]70.6218[/C][C]0.903200000000004[/C][/ROW]
[ROW][C]40[/C][C]77.74[/C][C]64.8998[/C][C]12.8402[/C][/ROW]
[ROW][C]41[/C][C]62.107[/C][C]55.8912[/C][C]6.2158[/C][/ROW]
[ROW][C]42[/C][C]65.45[/C][C]60.3314[/C][C]5.1186[/C][/ROW]
[ROW][C]43[/C][C]51.493[/C][C]47.3526[/C][C]4.1404[/C][/ROW]
[ROW][C]44[/C][C]43.067[/C][C]41.6868[/C][C]1.38020000000000[/C][/ROW]
[ROW][C]45[/C][C]49.172[/C][C]43.1136[/C][C]6.0584[/C][/ROW]
[ROW][C]46[/C][C]54.483[/C][C]49.4794[/C][C]5.0036[/C][/ROW]
[ROW][C]47[/C][C]38.158[/C][C]42.2676[/C][C]-4.1096[/C][/ROW]
[ROW][C]48[/C][C]27.898[/C][C]28.0488[/C][C]-0.150800000000001[/C][/ROW]
[ROW][C]49[/C][C]58.648[/C][C]65.7338[/C][C]-7.08579999999999[/C][/ROW]
[ROW][C]50[/C][C]56[/C][C]61.3684[/C][C]-5.3684[/C][/ROW]
[ROW][C]51[/C][C]62.381[/C][C]70.6218[/C][C]-8.2408[/C][/ROW]
[ROW][C]52[/C][C]59.849[/C][C]64.8998[/C][C]-5.0508[/C][/ROW]
[ROW][C]53[/C][C]48.345[/C][C]55.8912[/C][C]-7.5462[/C][/ROW]
[ROW][C]54[/C][C]55.376[/C][C]60.3314[/C][C]-4.9554[/C][/ROW]
[ROW][C]55[/C][C]45.4[/C][C]47.3526[/C][C]-1.9526[/C][/ROW]
[ROW][C]56[/C][C]38.389[/C][C]41.6868[/C][C]-3.29779999999999[/C][/ROW]
[ROW][C]57[/C][C]44.098[/C][C]43.1136[/C][C]0.9844[/C][/ROW]
[ROW][C]58[/C][C]48.29[/C][C]49.4794[/C][C]-1.1894[/C][/ROW]
[ROW][C]59[/C][C]41.267[/C][C]42.2676[/C][C]-1.00060000000000[/C][/ROW]
[ROW][C]60[/C][C]31.238[/C][C]28.0488[/C][C]3.1892[/C][/ROW]
[/TABLE]
Source: https://freestatistics.org/blog/index.php?pk=102615&T=4

Globally Unique Identifier (entire table): ba.freestatistics.org/blog/index.php?pk=102615&T=4

As an alternative you can also use a QR Code:  

The GUIDs for individual cells are displayed in the table below:

Multiple Linear Regression - Actuals, Interpolation, and Residuals
Time or IndexActualsInterpolationForecastResidualsPrediction Error
162.02765.7338-3.70680000000002
256.49361.3684-4.8754
365.56670.6218-5.0558
462.65364.8998-2.24679999999999
553.4755.8912-2.42120000000001
659.660.3314-0.731400000000003
742.54247.3526-4.8106
842.01841.68680.331199999999996
944.03843.11360.924400000000001
1044.98849.4794-4.4914
1143.30942.26761.04140000000000
1226.84328.0488-1.2058
1369.7765.73384.03620000000001
1464.88661.36843.5176
1579.35470.62188.7322
1663.02564.8998-1.8748
1754.00355.8912-1.88819999999999
1855.92660.3314-4.4054
1945.62947.3526-1.7236
2040.36141.6868-1.3258
2143.03943.1136-0.0745999999999968
2244.5749.4794-4.9094
2343.26942.26761.00140000000000
2425.56328.0488-2.4858
2568.70765.73382.9732
2660.22361.3684-1.14540000000000
2774.28370.62183.6612
2861.23264.8998-3.6678
2961.53155.89125.6398
3065.30560.33144.9736
3151.69947.35264.3464
3244.59941.68682.9122
3335.22143.1136-7.8926
3455.06649.47945.5866
3545.33542.26763.0674
3628.70228.04880.6532
3769.51765.73383.78320000000000
3869.2461.36847.8716
3971.52570.62180.903200000000004
4077.7464.899812.8402
4162.10755.89126.2158
4265.4560.33145.1186
4351.49347.35264.1404
4443.06741.68681.38020000000000
4549.17243.11366.0584
4654.48349.47945.0036
4738.15842.2676-4.1096
4827.89828.0488-0.150800000000001
4958.64865.7338-7.08579999999999
505661.3684-5.3684
5162.38170.6218-8.2408
5259.84964.8998-5.0508
5348.34555.8912-7.5462
5455.37660.3314-4.9554
5545.447.3526-1.9526
5638.38941.6868-3.29779999999999
5744.09843.11360.9844
5848.2949.4794-1.1894
5941.26742.2676-1.00060000000000
6031.23828.04883.1892


Goldfeld-Quandt test for Heteroskedasticity
p-valuesAlternative Hypothesis
breakpoint indexgreater2-sidedless
150.8423480997234160.3153038005531680.157651900276584
160.728996852639790.542006294720420.27100314736021
170.5994595849894210.8010808300211580.400540415010579
180.5050452783581720.9899094432836550.494954721641827
190.4011075521058170.8022151042116340.598892447894183
200.2926216120897080.5852432241794160.707378387910292
210.2000885487760590.4001770975521180.799911451223941
220.1495300816004640.2990601632009280.850469918399536
230.09403458549521360.1880691709904270.905965414504786
240.05907494622760240.1181498924552050.940925053772398
250.04005315529209410.08010631058418810.959946844707906
260.02248856246661260.04497712493322530.977511437533387
270.01530564517302920.03061129034605850.98469435482697
280.01047133378232530.02094266756465060.989528666217675
290.01717449497433130.03434898994866250.982825505025669
300.02197138652365030.04394277304730060.97802861347635
310.02471195755313470.04942391510626930.975288042446865
320.01667961619718560.03335923239437130.983320383802814
330.03540541867189770.07081083734379540.964594581328102
340.05032130593079230.1006426118615850.949678694069208
350.03620399379574290.07240798759148580.963796006204257
360.02163753378948080.04327506757896150.97836246621052
370.02189720186717640.04379440373435280.978102798132824
380.05159600540870190.1031920108174040.948403994591298
390.04730144366419910.09460288732839810.9526985563358
400.3762392380513230.7524784761026460.623760761948677
410.6513008481472850.6973983037054310.348699151852715
420.8036058591047180.3927882817905630.196394140895282
430.811006518342710.377986963314580.18899348165729
440.7644977242612260.4710045514775490.235502275738775
450.7460338252595990.5079323494808020.253966174740401

\begin{tabular}{lllllllll}
\hline
Goldfeld-Quandt test for Heteroskedasticity \tabularnewline
p-values & Alternative Hypothesis \tabularnewline
breakpoint index & greater & 2-sided & less \tabularnewline
15 & 0.842348099723416 & 0.315303800553168 & 0.157651900276584 \tabularnewline
16 & 0.72899685263979 & 0.54200629472042 & 0.27100314736021 \tabularnewline
17 & 0.599459584989421 & 0.801080830021158 & 0.400540415010579 \tabularnewline
18 & 0.505045278358172 & 0.989909443283655 & 0.494954721641827 \tabularnewline
19 & 0.401107552105817 & 0.802215104211634 & 0.598892447894183 \tabularnewline
20 & 0.292621612089708 & 0.585243224179416 & 0.707378387910292 \tabularnewline
21 & 0.200088548776059 & 0.400177097552118 & 0.799911451223941 \tabularnewline
22 & 0.149530081600464 & 0.299060163200928 & 0.850469918399536 \tabularnewline
23 & 0.0940345854952136 & 0.188069170990427 & 0.905965414504786 \tabularnewline
24 & 0.0590749462276024 & 0.118149892455205 & 0.940925053772398 \tabularnewline
25 & 0.0400531552920941 & 0.0801063105841881 & 0.959946844707906 \tabularnewline
26 & 0.0224885624666126 & 0.0449771249332253 & 0.977511437533387 \tabularnewline
27 & 0.0153056451730292 & 0.0306112903460585 & 0.98469435482697 \tabularnewline
28 & 0.0104713337823253 & 0.0209426675646506 & 0.989528666217675 \tabularnewline
29 & 0.0171744949743313 & 0.0343489899486625 & 0.982825505025669 \tabularnewline
30 & 0.0219713865236503 & 0.0439427730473006 & 0.97802861347635 \tabularnewline
31 & 0.0247119575531347 & 0.0494239151062693 & 0.975288042446865 \tabularnewline
32 & 0.0166796161971856 & 0.0333592323943713 & 0.983320383802814 \tabularnewline
33 & 0.0354054186718977 & 0.0708108373437954 & 0.964594581328102 \tabularnewline
34 & 0.0503213059307923 & 0.100642611861585 & 0.949678694069208 \tabularnewline
35 & 0.0362039937957429 & 0.0724079875914858 & 0.963796006204257 \tabularnewline
36 & 0.0216375337894808 & 0.0432750675789615 & 0.97836246621052 \tabularnewline
37 & 0.0218972018671764 & 0.0437944037343528 & 0.978102798132824 \tabularnewline
38 & 0.0515960054087019 & 0.103192010817404 & 0.948403994591298 \tabularnewline
39 & 0.0473014436641991 & 0.0946028873283981 & 0.9526985563358 \tabularnewline
40 & 0.376239238051323 & 0.752478476102646 & 0.623760761948677 \tabularnewline
41 & 0.651300848147285 & 0.697398303705431 & 0.348699151852715 \tabularnewline
42 & 0.803605859104718 & 0.392788281790563 & 0.196394140895282 \tabularnewline
43 & 0.81100651834271 & 0.37798696331458 & 0.18899348165729 \tabularnewline
44 & 0.764497724261226 & 0.471004551477549 & 0.235502275738775 \tabularnewline
45 & 0.746033825259599 & 0.507932349480802 & 0.253966174740401 \tabularnewline
\hline
\end{tabular}
%Source: https://freestatistics.org/blog/index.php?pk=102615&T=5

[TABLE]
[ROW][C]Goldfeld-Quandt test for Heteroskedasticity[/C][/ROW]
[ROW][C]p-values[/C][C]Alternative Hypothesis[/C][/ROW]
[ROW][C]breakpoint index[/C][C]greater[/C][C]2-sided[/C][C]less[/C][/ROW]
[ROW][C]15[/C][C]0.842348099723416[/C][C]0.315303800553168[/C][C]0.157651900276584[/C][/ROW]
[ROW][C]16[/C][C]0.72899685263979[/C][C]0.54200629472042[/C][C]0.27100314736021[/C][/ROW]
[ROW][C]17[/C][C]0.599459584989421[/C][C]0.801080830021158[/C][C]0.400540415010579[/C][/ROW]
[ROW][C]18[/C][C]0.505045278358172[/C][C]0.989909443283655[/C][C]0.494954721641827[/C][/ROW]
[ROW][C]19[/C][C]0.401107552105817[/C][C]0.802215104211634[/C][C]0.598892447894183[/C][/ROW]
[ROW][C]20[/C][C]0.292621612089708[/C][C]0.585243224179416[/C][C]0.707378387910292[/C][/ROW]
[ROW][C]21[/C][C]0.200088548776059[/C][C]0.400177097552118[/C][C]0.799911451223941[/C][/ROW]
[ROW][C]22[/C][C]0.149530081600464[/C][C]0.299060163200928[/C][C]0.850469918399536[/C][/ROW]
[ROW][C]23[/C][C]0.0940345854952136[/C][C]0.188069170990427[/C][C]0.905965414504786[/C][/ROW]
[ROW][C]24[/C][C]0.0590749462276024[/C][C]0.118149892455205[/C][C]0.940925053772398[/C][/ROW]
[ROW][C]25[/C][C]0.0400531552920941[/C][C]0.0801063105841881[/C][C]0.959946844707906[/C][/ROW]
[ROW][C]26[/C][C]0.0224885624666126[/C][C]0.0449771249332253[/C][C]0.977511437533387[/C][/ROW]
[ROW][C]27[/C][C]0.0153056451730292[/C][C]0.0306112903460585[/C][C]0.98469435482697[/C][/ROW]
[ROW][C]28[/C][C]0.0104713337823253[/C][C]0.0209426675646506[/C][C]0.989528666217675[/C][/ROW]
[ROW][C]29[/C][C]0.0171744949743313[/C][C]0.0343489899486625[/C][C]0.982825505025669[/C][/ROW]
[ROW][C]30[/C][C]0.0219713865236503[/C][C]0.0439427730473006[/C][C]0.97802861347635[/C][/ROW]
[ROW][C]31[/C][C]0.0247119575531347[/C][C]0.0494239151062693[/C][C]0.975288042446865[/C][/ROW]
[ROW][C]32[/C][C]0.0166796161971856[/C][C]0.0333592323943713[/C][C]0.983320383802814[/C][/ROW]
[ROW][C]33[/C][C]0.0354054186718977[/C][C]0.0708108373437954[/C][C]0.964594581328102[/C][/ROW]
[ROW][C]34[/C][C]0.0503213059307923[/C][C]0.100642611861585[/C][C]0.949678694069208[/C][/ROW]
[ROW][C]35[/C][C]0.0362039937957429[/C][C]0.0724079875914858[/C][C]0.963796006204257[/C][/ROW]
[ROW][C]36[/C][C]0.0216375337894808[/C][C]0.0432750675789615[/C][C]0.97836246621052[/C][/ROW]
[ROW][C]37[/C][C]0.0218972018671764[/C][C]0.0437944037343528[/C][C]0.978102798132824[/C][/ROW]
[ROW][C]38[/C][C]0.0515960054087019[/C][C]0.103192010817404[/C][C]0.948403994591298[/C][/ROW]
[ROW][C]39[/C][C]0.0473014436641991[/C][C]0.0946028873283981[/C][C]0.9526985563358[/C][/ROW]
[ROW][C]40[/C][C]0.376239238051323[/C][C]0.752478476102646[/C][C]0.623760761948677[/C][/ROW]
[ROW][C]41[/C][C]0.651300848147285[/C][C]0.697398303705431[/C][C]0.348699151852715[/C][/ROW]
[ROW][C]42[/C][C]0.803605859104718[/C][C]0.392788281790563[/C][C]0.196394140895282[/C][/ROW]
[ROW][C]43[/C][C]0.81100651834271[/C][C]0.37798696331458[/C][C]0.18899348165729[/C][/ROW]
[ROW][C]44[/C][C]0.764497724261226[/C][C]0.471004551477549[/C][C]0.235502275738775[/C][/ROW]
[ROW][C]45[/C][C]0.746033825259599[/C][C]0.507932349480802[/C][C]0.253966174740401[/C][/ROW]
[/TABLE]
Source: https://freestatistics.org/blog/index.php?pk=102615&T=5

Globally Unique Identifier (entire table): ba.freestatistics.org/blog/index.php?pk=102615&T=5

As an alternative you can also use a QR Code:  

The GUIDs for individual cells are displayed in the table below:

Goldfeld-Quandt test for Heteroskedasticity
p-valuesAlternative Hypothesis
breakpoint indexgreater2-sidedless
150.8423480997234160.3153038005531680.157651900276584
160.728996852639790.542006294720420.27100314736021
170.5994595849894210.8010808300211580.400540415010579
180.5050452783581720.9899094432836550.494954721641827
190.4011075521058170.8022151042116340.598892447894183
200.2926216120897080.5852432241794160.707378387910292
210.2000885487760590.4001770975521180.799911451223941
220.1495300816004640.2990601632009280.850469918399536
230.09403458549521360.1880691709904270.905965414504786
240.05907494622760240.1181498924552050.940925053772398
250.04005315529209410.08010631058418810.959946844707906
260.02248856246661260.04497712493322530.977511437533387
270.01530564517302920.03061129034605850.98469435482697
280.01047133378232530.02094266756465060.989528666217675
290.01717449497433130.03434898994866250.982825505025669
300.02197138652365030.04394277304730060.97802861347635
310.02471195755313470.04942391510626930.975288042446865
320.01667961619718560.03335923239437130.983320383802814
330.03540541867189770.07081083734379540.964594581328102
340.05032130593079230.1006426118615850.949678694069208
350.03620399379574290.07240798759148580.963796006204257
360.02163753378948080.04327506757896150.97836246621052
370.02189720186717640.04379440373435280.978102798132824
380.05159600540870190.1031920108174040.948403994591298
390.04730144366419910.09460288732839810.9526985563358
400.3762392380513230.7524784761026460.623760761948677
410.6513008481472850.6973983037054310.348699151852715
420.8036058591047180.3927882817905630.196394140895282
430.811006518342710.377986963314580.18899348165729
440.7644977242612260.4710045514775490.235502275738775
450.7460338252595990.5079323494808020.253966174740401


Meta Analysis of Goldfeld-Quandt test for Heteroskedasticity
Description# significant tests% significant testsOK/NOK
1% type I error level00OK
5% type I error level90.290322580645161NOK
10% type I error level130.419354838709677NOK

\begin{tabular}{lllllllll}
\hline
Meta Analysis of Goldfeld-Quandt test for Heteroskedasticity \tabularnewline
Description & # significant tests & % significant tests & OK/NOK \tabularnewline
1% type I error level & 0 & 0 & OK \tabularnewline
5% type I error level & 9 & 0.290322580645161 & NOK \tabularnewline
10% type I error level & 13 & 0.419354838709677 & NOK \tabularnewline
\hline
\end{tabular}
%Source: https://freestatistics.org/blog/index.php?pk=102615&T=6

[TABLE]
[ROW][C]Meta Analysis of Goldfeld-Quandt test for Heteroskedasticity[/C][/ROW]
[ROW][C]Description[/C][C]# significant tests[/C][C]% significant tests[/C][C]OK/NOK[/C][/ROW]
[ROW][C]1% type I error level[/C][C]0[/C][C]0[/C][C]OK[/C][/ROW]
[ROW][C]5% type I error level[/C][C]9[/C][C]0.290322580645161[/C][C]NOK[/C][/ROW]
[ROW][C]10% type I error level[/C][C]13[/C][C]0.419354838709677[/C][C]NOK[/C][/ROW]
[/TABLE]
Source: https://freestatistics.org/blog/index.php?pk=102615&T=6

Globally Unique Identifier (entire table): ba.freestatistics.org/blog/index.php?pk=102615&T=6

As an alternative you can also use a QR Code:  

The GUIDs for individual cells are displayed in the table below:

Meta Analysis of Goldfeld-Quandt test for Heteroskedasticity
Description# significant tests% significant testsOK/NOK
1% type I error level00OK
5% type I error level90.290322580645161NOK
10% type I error level130.419354838709677NOK


Parameters (Session):
par1 = 1 ; par2 = 0 ; par3 = 0 ; par4 = 12 ;
Parameters (R input):
par1 = 1 ; par2 = Include Monthly Dummies ; par3 = No Linear Trend ;
R code (references can be found in the software module):
library(lattice)
library(lmtest)
n25 <- 25 #minimum number of obs. for Goldfeld-Quandt test
par1 <- as.numeric(par1)
x <- t(y)
k <- length(x[1,])
n <- length(x[,1])
x1 <- cbind(x[,par1], x[,1:k!=par1])
mycolnames <- c(colnames(x)[par1], colnames(x)[1:k!=par1])
colnames(x1) <- mycolnames #colnames(x)[par1]
x <- x1
if (par3 == 'First Differences'){
x2 <- array(0, dim=c(n-1,k), dimnames=list(1:(n-1), paste('(1-B)',colnames(x),sep='')))
for (i in 1:n-1) {
for (j in 1:k) {
x2[i,j] <- x[i+1,j] - x[i,j]
}
}
x <- x2
}
if (par2 == 'Include Monthly Dummies'){
x2 <- array(0, dim=c(n,11), dimnames=list(1:n, paste('M', seq(1:11), sep ='')))
for (i in 1:11){
x2[seq(i,n,12),i] <- 1
}
x <- cbind(x, x2)
}
if (par2 == 'Include Quarterly Dummies'){
x2 <- array(0, dim=c(n,3), dimnames=list(1:n, paste('Q', seq(1:3), sep ='')))
for (i in 1:3){
x2[seq(i,n,4),i] <- 1
}
x <- cbind(x, x2)
}
k <- length(x[1,])
if (par3 == 'Linear Trend'){
x <- cbind(x, c(1:n))
colnames(x)[k+1] <- 't'
}
x
k <- length(x[1,])
df <- as.data.frame(x)
(mylm <- lm(df))
(mysum <- summary(mylm))
if (n > n25) {
kp3 <- k + 3
nmkm3 <- n - k - 3
gqarr <- array(NA, dim=c(nmkm3-kp3+1,3))
numgqtests <- 0
numsignificant1 <- 0
numsignificant5 <- 0
numsignificant10 <- 0
for (mypoint in kp3:nmkm3) {
j <- 0
numgqtests <- numgqtests + 1
for (myalt in c('greater', 'two.sided', 'less')) {
j <- j + 1
gqarr[mypoint-kp3+1,j] <- gqtest(mylm, point=mypoint, alternative=myalt)$p.value
}
if (gqarr[mypoint-kp3+1,2] < 0.01) numsignificant1 <- numsignificant1 + 1
if (gqarr[mypoint-kp3+1,2] < 0.05) numsignificant5 <- numsignificant5 + 1
if (gqarr[mypoint-kp3+1,2] < 0.10) numsignificant10 <- numsignificant10 + 1
}
gqarr
}
bitmap(file='test0.png')
plot(x[,1], type='l', main='Actuals and Interpolation', ylab='value of Actuals and Interpolation (dots)', xlab='time or index')
points(x[,1]-mysum$resid)
grid()
dev.off()
bitmap(file='test1.png')
plot(mysum$resid, type='b', pch=19, main='Residuals', ylab='value of Residuals', xlab='time or index')
grid()
dev.off()
bitmap(file='test2.png')
hist(mysum$resid, main='Residual Histogram', xlab='values of Residuals')
grid()
dev.off()
bitmap(file='test3.png')
densityplot(~mysum$resid,col='black',main='Residual Density Plot', xlab='values of Residuals')
dev.off()
bitmap(file='test4.png')
qqnorm(mysum$resid, main='Residual Normal Q-Q Plot')
qqline(mysum$resid)
grid()
dev.off()
(myerror <- as.ts(mysum$resid))
bitmap(file='test5.png')
dum <- cbind(lag(myerror,k=1),myerror)
dum
dum1 <- dum[2:length(myerror),]
dum1
z <- as.data.frame(dum1)
z
plot(z,main=paste('Residual Lag plot, lowess, and regression line'), ylab='values of Residuals', xlab='lagged values of Residuals')
lines(lowess(z))
abline(lm(z))
grid()
dev.off()
bitmap(file='test6.png')
acf(mysum$resid, lag.max=length(mysum$resid)/2, main='Residual Autocorrelation Function')
grid()
dev.off()
bitmap(file='test7.png')
pacf(mysum$resid, lag.max=length(mysum$resid)/2, main='Residual Partial Autocorrelation Function')
grid()
dev.off()
bitmap(file='test8.png')
opar <- par(mfrow = c(2,2), oma = c(0, 0, 1.1, 0))
plot(mylm, las = 1, sub='Residual Diagnostics')
par(opar)
dev.off()
if (n > n25) {
bitmap(file='test9.png')
plot(kp3:nmkm3,gqarr[,2], main='Goldfeld-Quandt test',ylab='2-sided p-value',xlab='breakpoint')
grid()
dev.off()
}
load(file='createtable')
a<-table.start()
a<-table.row.start(a)
a<-table.element(a, 'Multiple Linear Regression - Estimated Regression Equation', 1, TRUE)
a<-table.row.end(a)
myeq <- colnames(x)[1]
myeq <- paste(myeq, '[t] = ', sep='')
for (i in 1:k){
if (mysum$coefficients[i,1] > 0) myeq <- paste(myeq, '+', '')
myeq <- paste(myeq, mysum$coefficients[i,1], sep=' ')
if (rownames(mysum$coefficients)[i] != '(Intercept)') {
myeq <- paste(myeq, rownames(mysum$coefficients)[i], sep='')
if (rownames(mysum$coefficients)[i] != 't') myeq <- paste(myeq, '[t]', sep='')
}
}
myeq <- paste(myeq, ' + e[t]')
a<-table.row.start(a)
a<-table.element(a, myeq)
a<-table.row.end(a)
a<-table.end(a)
table.save(a,file='mytable1.tab')
a<-table.start()
a<-table.row.start(a)
a<-table.element(a,hyperlink('ols1.htm','Multiple Linear Regression - Ordinary Least Squares',''), 6, TRUE)
a<-table.row.end(a)
a<-table.row.start(a)
a<-table.element(a,'Variable',header=TRUE)
a<-table.element(a,'Parameter',header=TRUE)
a<-table.element(a,'S.D.',header=TRUE)
a<-table.element(a,'T-STAT
H0: parameter = 0',header=TRUE)
a<-table.element(a,'2-tail p-value',header=TRUE)
a<-table.element(a,'1-tail p-value',header=TRUE)
a<-table.row.end(a)
for (i in 1:k){
a<-table.row.start(a)
a<-table.element(a,rownames(mysum$coefficients)[i],header=TRUE)
a<-table.element(a,mysum$coefficients[i,1])
a<-table.element(a, round(mysum$coefficients[i,2],6))
a<-table.element(a, round(mysum$coefficients[i,3],4))
a<-table.element(a, round(mysum$coefficients[i,4],6))
a<-table.element(a, round(mysum$coefficients[i,4]/2,6))
a<-table.row.end(a)
}
a<-table.end(a)
table.save(a,file='mytable2.tab')
a<-table.start()
a<-table.row.start(a)
a<-table.element(a, 'Multiple Linear Regression - Regression Statistics', 2, TRUE)
a<-table.row.end(a)
a<-table.row.start(a)
a<-table.element(a, 'Multiple R',1,TRUE)
a<-table.element(a, sqrt(mysum$r.squared))
a<-table.row.end(a)
a<-table.row.start(a)
a<-table.element(a, 'R-squared',1,TRUE)
a<-table.element(a, mysum$r.squared)
a<-table.row.end(a)
a<-table.row.start(a)
a<-table.element(a, 'Adjusted R-squared',1,TRUE)
a<-table.element(a, mysum$adj.r.squared)
a<-table.row.end(a)
a<-table.row.start(a)
a<-table.element(a, 'F-TEST (value)',1,TRUE)
a<-table.element(a, mysum$fstatistic[1])
a<-table.row.end(a)
a<-table.row.start(a)
a<-table.element(a, 'F-TEST (DF numerator)',1,TRUE)
a<-table.element(a, mysum$fstatistic[2])
a<-table.row.end(a)
a<-table.row.start(a)
a<-table.element(a, 'F-TEST (DF denominator)',1,TRUE)
a<-table.element(a, mysum$fstatistic[3])
a<-table.row.end(a)
a<-table.row.start(a)
a<-table.element(a, 'p-value',1,TRUE)
a<-table.element(a, 1-pf(mysum$fstatistic[1],mysum$fstatistic[2],mysum$fstatistic[3]))
a<-table.row.end(a)
a<-table.row.start(a)
a<-table.element(a, 'Multiple Linear Regression - Residual Statistics', 2, TRUE)
a<-table.row.end(a)
a<-table.row.start(a)
a<-table.element(a, 'Residual Standard Deviation',1,TRUE)
a<-table.element(a, mysum$sigma)
a<-table.row.end(a)
a<-table.row.start(a)
a<-table.element(a, 'Sum Squared Residuals',1,TRUE)
a<-table.element(a, sum(myerror*myerror))
a<-table.row.end(a)
a<-table.end(a)
table.save(a,file='mytable3.tab')
a<-table.start()
a<-table.row.start(a)
a<-table.element(a, 'Multiple Linear Regression - Actuals, Interpolation, and Residuals', 4, TRUE)
a<-table.row.end(a)
a<-table.row.start(a)
a<-table.element(a, 'Time or Index', 1, TRUE)
a<-table.element(a, 'Actuals', 1, TRUE)
a<-table.element(a, 'Interpolation
Forecast', 1, TRUE)
a<-table.element(a, 'Residuals
Prediction Error', 1, TRUE)
a<-table.row.end(a)
for (i in 1:n) {
a<-table.row.start(a)
a<-table.element(a,i, 1, TRUE)
a<-table.element(a,x[i])
a<-table.element(a,x[i]-mysum$resid[i])
a<-table.element(a,mysum$resid[i])
a<-table.row.end(a)
}
a<-table.end(a)
table.save(a,file='mytable4.tab')
if (n > n25) {
a<-table.start()
a<-table.row.start(a)
a<-table.element(a,'Goldfeld-Quandt test for Heteroskedasticity',4,TRUE)
a<-table.row.end(a)
a<-table.row.start(a)
a<-table.element(a,'p-values',header=TRUE)
a<-table.element(a,'Alternative Hypothesis',3,header=TRUE)
a<-table.row.end(a)
a<-table.row.start(a)
a<-table.element(a,'breakpoint index',header=TRUE)
a<-table.element(a,'greater',header=TRUE)
a<-table.element(a,'2-sided',header=TRUE)
a<-table.element(a,'less',header=TRUE)
a<-table.row.end(a)
for (mypoint in kp3:nmkm3) {
a<-table.row.start(a)
a<-table.element(a,mypoint,header=TRUE)
a<-table.element(a,gqarr[mypoint-kp3+1,1])
a<-table.element(a,gqarr[mypoint-kp3+1,2])
a<-table.element(a,gqarr[mypoint-kp3+1,3])
a<-table.row.end(a)
}
a<-table.end(a)
table.save(a,file='mytable5.tab')
a<-table.start()
a<-table.row.start(a)
a<-table.element(a,'Meta Analysis of Goldfeld-Quandt test for Heteroskedasticity',4,TRUE)
a<-table.row.end(a)
a<-table.row.start(a)
a<-table.element(a,'Description',header=TRUE)
a<-table.element(a,'# significant tests',header=TRUE)
a<-table.element(a,'% significant tests',header=TRUE)
a<-table.element(a,'OK/NOK',header=TRUE)
a<-table.row.end(a)
a<-table.row.start(a)
a<-table.element(a,'1% type I error level',header=TRUE)
a<-table.element(a,numsignificant1)
a<-table.element(a,numsignificant1/numgqtests)
if (numsignificant1/numgqtests < 0.01) dum <- 'OK' else dum <- 'NOK'
a<-table.element(a,dum)
a<-table.row.end(a)
a<-table.row.start(a)
a<-table.element(a,'5% type I error level',header=TRUE)
a<-table.element(a,numsignificant5)
a<-table.element(a,numsignificant5/numgqtests)
if (numsignificant5/numgqtests < 0.05) dum <- 'OK' else dum <- 'NOK'
a<-table.element(a,dum)
a<-table.row.end(a)
a<-table.row.start(a)
a<-table.element(a,'10% type I error level',header=TRUE)
a<-table.element(a,numsignificant10)
a<-table.element(a,numsignificant10/numgqtests)
if (numsignificant10/numgqtests < 0.1) dum <- 'OK' else dum <- 'NOK'
a<-table.element(a,dum)
a<-table.row.end(a)
a<-table.end(a)
table.save(a,file='mytable6.tab')
}