Free Statistics

of Irreproducible Research!

Author's title

Author*The author of this computation has been verified*
R Software Modulerwasp_multipleregression.wasp
Title produced by softwareMultiple Regression
Date of computationSun, 28 Nov 2010 15:31:42 +0000
Cite this page as followsStatistical Computations at FreeStatistics.org, Office for Research Development and Education, URL https://freestatistics.org/blog/index.php?v=date/2010/Nov/28/t1290958220kxq75msc0c3xr7b.htm/, Retrieved Thu, 02 May 2024 23:32:11 +0000
Statistical Computations at FreeStatistics.org, Office for Research Development and Education, URL https://freestatistics.org/blog/index.php?pk=102618, Retrieved Thu, 02 May 2024 23:32:11 +0000
QR Codes:

Original text written by user:
IsPrivate?No (this computation is public)
User-defined keywords
Estimated Impact204
Family? (F = Feedback message, R = changed R code, M = changed R Module, P = changed Parameters, D = changed Data)
-     [Multiple Regression] [Q1 The Seatbeltlaw] [2007-11-14 19:27:43] [8cd6641b921d30ebe00b648d1481bba0]
- RMPD  [Multiple Regression] [Seatbelt] [2009-11-12 13:54:52] [b98453cac15ba1066b407e146608df68]
- R PD    [Multiple Regression] [Aantal reizigers ...] [2010-11-26 01:03:33] [97ad38b1c3b35a5feca8b85f7bc7b3ff]
-   PD        [Multiple Regression] [Montly dummie] [2010-11-28 15:31:42] [ecfb965f5669057f3ac5b58964283289] [Current]
Feedback Forum

Post a new message
Dataseries X:
63.152
60.106
72.616
73.159
68.848
77.056
62.246
60.777
64.513
58.353
56.511
44.554
71.414
65.719
80.997
69.826
65.386
75.589
65.520
59.003
63.961
59.716
57.520
42.886
69.805
64.656
80.353
71.321
76.577
81.580
71.127
63.478
48.152
69.236
57.038
43.621
69.551
72.009
72.140
81.519
73.310
80.406
70.697
59.328
68.281
70.041
51.244
46.538
61.443
62.256
73.117
74.155
65.191
77.889
68.688
59.983
65.470
65.089
54.795
47.123


Summary of computational transaction
Raw Inputview raw input (R code)
Raw Outputview raw output of R engine
Computing time6 seconds
R Server'Gwilym Jenkins' @ 72.249.127.135

\begin{tabular}{lllllllll}
\hline
Summary of computational transaction \tabularnewline
Raw Input & view raw input (R code)  \tabularnewline
Raw Output & view raw output of R engine  \tabularnewline
Computing time & 6 seconds \tabularnewline
R Server & 'Gwilym Jenkins' @ 72.249.127.135 \tabularnewline
\hline
\end{tabular}
%Source: https://freestatistics.org/blog/index.php?pk=102618&T=0

[TABLE]
[ROW][C]Summary of computational transaction[/C][/ROW]
[ROW][C]Raw Input[/C][C]view raw input (R code) [/C][/ROW]
[ROW][C]Raw Output[/C][C]view raw output of R engine [/C][/ROW]
[ROW][C]Computing time[/C][C]6 seconds[/C][/ROW]
[ROW][C]R Server[/C][C]'Gwilym Jenkins' @ 72.249.127.135[/C][/ROW]
[/TABLE]
Source: https://freestatistics.org/blog/index.php?pk=102618&T=0

Globally Unique Identifier (entire table): ba.freestatistics.org/blog/index.php?pk=102618&T=0

As an alternative you can also use a QR Code:  

The GUIDs for individual cells are displayed in the table below:

Summary of computational transaction
Raw Inputview raw input (R code)
Raw Outputview raw output of R engine
Computing time6 seconds
R Server'Gwilym Jenkins' @ 72.249.127.135


Multiple Linear Regression - Estimated Regression Equation
Yt[t] = + 44.9444 + 22.1286000000001M1[t] + 20.0048M2[t] + 30.9002000000000M3[t] + 29.0516M4[t] + 24.918M5[t] + 33.5596M6[t] + 22.7112M7[t] + 15.5694M8[t] + 17.131M9[t] + 19.5426M10[t] + 10.4772M11[t] + e[t]

\begin{tabular}{lllllllll}
\hline
Multiple Linear Regression - Estimated Regression Equation \tabularnewline
Yt[t] =  +  44.9444 +  22.1286000000001M1[t] +  20.0048M2[t] +  30.9002000000000M3[t] +  29.0516M4[t] +  24.918M5[t] +  33.5596M6[t] +  22.7112M7[t] +  15.5694M8[t] +  17.131M9[t] +  19.5426M10[t] +  10.4772M11[t]  + e[t] \tabularnewline
\hline
\end{tabular}
%Source: https://freestatistics.org/blog/index.php?pk=102618&T=1

[TABLE]
[ROW][C]Multiple Linear Regression - Estimated Regression Equation[/C][/ROW]
[ROW][C]Yt[t] =  +  44.9444 +  22.1286000000001M1[t] +  20.0048M2[t] +  30.9002000000000M3[t] +  29.0516M4[t] +  24.918M5[t] +  33.5596M6[t] +  22.7112M7[t] +  15.5694M8[t] +  17.131M9[t] +  19.5426M10[t] +  10.4772M11[t]  + e[t][/C][/ROW]
[/TABLE]
Source: https://freestatistics.org/blog/index.php?pk=102618&T=1

Globally Unique Identifier (entire table): ba.freestatistics.org/blog/index.php?pk=102618&T=1

As an alternative you can also use a QR Code:  

The GUIDs for individual cells are displayed in the table below:

Multiple Linear Regression - Estimated Regression Equation
Yt[t] = + 44.9444 + 22.1286000000001M1[t] + 20.0048M2[t] + 30.9002000000000M3[t] + 29.0516M4[t] + 24.918M5[t] + 33.5596M6[t] + 22.7112M7[t] + 15.5694M8[t] + 17.131M9[t] + 19.5426M10[t] + 10.4772M11[t] + e[t]


Multiple Linear Regression - Ordinary Least Squares
VariableParameterS.D.T-STATH0: parameter = 02-tail p-value1-tail p-value
(Intercept)44.94441.95897722.942800
M122.12860000000012.7704127.987500
M220.00482.7704127.220900
M330.90020000000002.77041211.153600
M429.05162.77041210.486400
M524.9182.7704128.994300
M633.55962.77041212.113600
M722.71122.7704128.197800
M815.56942.7704125.61991e-060
M917.1312.7704126.183600
M1019.54262.7704127.05400
M1110.47722.7704123.78180.0004310.000216

\begin{tabular}{lllllllll}
\hline
Multiple Linear Regression - Ordinary Least Squares \tabularnewline
Variable & Parameter & S.D. & T-STATH0: parameter = 0 & 2-tail p-value & 1-tail p-value \tabularnewline
(Intercept) & 44.9444 & 1.958977 & 22.9428 & 0 & 0 \tabularnewline
M1 & 22.1286000000001 & 2.770412 & 7.9875 & 0 & 0 \tabularnewline
M2 & 20.0048 & 2.770412 & 7.2209 & 0 & 0 \tabularnewline
M3 & 30.9002000000000 & 2.770412 & 11.1536 & 0 & 0 \tabularnewline
M4 & 29.0516 & 2.770412 & 10.4864 & 0 & 0 \tabularnewline
M5 & 24.918 & 2.770412 & 8.9943 & 0 & 0 \tabularnewline
M6 & 33.5596 & 2.770412 & 12.1136 & 0 & 0 \tabularnewline
M7 & 22.7112 & 2.770412 & 8.1978 & 0 & 0 \tabularnewline
M8 & 15.5694 & 2.770412 & 5.6199 & 1e-06 & 0 \tabularnewline
M9 & 17.131 & 2.770412 & 6.1836 & 0 & 0 \tabularnewline
M10 & 19.5426 & 2.770412 & 7.054 & 0 & 0 \tabularnewline
M11 & 10.4772 & 2.770412 & 3.7818 & 0.000431 & 0.000216 \tabularnewline
\hline
\end{tabular}
%Source: https://freestatistics.org/blog/index.php?pk=102618&T=2

[TABLE]
[ROW][C]Multiple Linear Regression - Ordinary Least Squares[/C][/ROW]
[ROW][C]Variable[/C][C]Parameter[/C][C]S.D.[/C][C]T-STATH0: parameter = 0[/C][C]2-tail p-value[/C][C]1-tail p-value[/C][/ROW]
[ROW][C](Intercept)[/C][C]44.9444[/C][C]1.958977[/C][C]22.9428[/C][C]0[/C][C]0[/C][/ROW]
[ROW][C]M1[/C][C]22.1286000000001[/C][C]2.770412[/C][C]7.9875[/C][C]0[/C][C]0[/C][/ROW]
[ROW][C]M2[/C][C]20.0048[/C][C]2.770412[/C][C]7.2209[/C][C]0[/C][C]0[/C][/ROW]
[ROW][C]M3[/C][C]30.9002000000000[/C][C]2.770412[/C][C]11.1536[/C][C]0[/C][C]0[/C][/ROW]
[ROW][C]M4[/C][C]29.0516[/C][C]2.770412[/C][C]10.4864[/C][C]0[/C][C]0[/C][/ROW]
[ROW][C]M5[/C][C]24.918[/C][C]2.770412[/C][C]8.9943[/C][C]0[/C][C]0[/C][/ROW]
[ROW][C]M6[/C][C]33.5596[/C][C]2.770412[/C][C]12.1136[/C][C]0[/C][C]0[/C][/ROW]
[ROW][C]M7[/C][C]22.7112[/C][C]2.770412[/C][C]8.1978[/C][C]0[/C][C]0[/C][/ROW]
[ROW][C]M8[/C][C]15.5694[/C][C]2.770412[/C][C]5.6199[/C][C]1e-06[/C][C]0[/C][/ROW]
[ROW][C]M9[/C][C]17.131[/C][C]2.770412[/C][C]6.1836[/C][C]0[/C][C]0[/C][/ROW]
[ROW][C]M10[/C][C]19.5426[/C][C]2.770412[/C][C]7.054[/C][C]0[/C][C]0[/C][/ROW]
[ROW][C]M11[/C][C]10.4772[/C][C]2.770412[/C][C]3.7818[/C][C]0.000431[/C][C]0.000216[/C][/ROW]
[/TABLE]
Source: https://freestatistics.org/blog/index.php?pk=102618&T=2

Globally Unique Identifier (entire table): ba.freestatistics.org/blog/index.php?pk=102618&T=2

As an alternative you can also use a QR Code:  

The GUIDs for individual cells are displayed in the table below:

Multiple Linear Regression - Ordinary Least Squares
VariableParameterS.D.T-STATH0: parameter = 02-tail p-value1-tail p-value
(Intercept)44.94441.95897722.942800
M122.12860000000012.7704127.987500
M220.00482.7704127.220900
M330.90020000000002.77041211.153600
M429.05162.77041210.486400
M524.9182.7704128.994300
M633.55962.77041212.113600
M722.71122.7704128.197800
M815.56942.7704125.61991e-060
M917.1312.7704126.183600
M1019.54262.7704127.05400
M1110.47722.7704123.78180.0004310.000216


Multiple Linear Regression - Regression Statistics
Multiple R0.914125792852386
R-squared0.835625965158004
Adjusted R-squared0.797956915506713
F-TEST (value)22.1833567051345
F-TEST (DF numerator)11
F-TEST (DF denominator)48
p-value3.5527136788005e-15
Multiple Linear Regression - Residual Statistics
Residual Standard Deviation4.38040539124709
Sum Squared Residuals921.021666799997

\begin{tabular}{lllllllll}
\hline
Multiple Linear Regression - Regression Statistics \tabularnewline
Multiple R & 0.914125792852386 \tabularnewline
R-squared & 0.835625965158004 \tabularnewline
Adjusted R-squared & 0.797956915506713 \tabularnewline
F-TEST (value) & 22.1833567051345 \tabularnewline
F-TEST (DF numerator) & 11 \tabularnewline
F-TEST (DF denominator) & 48 \tabularnewline
p-value & 3.5527136788005e-15 \tabularnewline
Multiple Linear Regression - Residual Statistics \tabularnewline
Residual Standard Deviation & 4.38040539124709 \tabularnewline
Sum Squared Residuals & 921.021666799997 \tabularnewline
\hline
\end{tabular}
%Source: https://freestatistics.org/blog/index.php?pk=102618&T=3

[TABLE]
[ROW][C]Multiple Linear Regression - Regression Statistics[/C][/ROW]
[ROW][C]Multiple R[/C][C]0.914125792852386[/C][/ROW]
[ROW][C]R-squared[/C][C]0.835625965158004[/C][/ROW]
[ROW][C]Adjusted R-squared[/C][C]0.797956915506713[/C][/ROW]
[ROW][C]F-TEST (value)[/C][C]22.1833567051345[/C][/ROW]
[ROW][C]F-TEST (DF numerator)[/C][C]11[/C][/ROW]
[ROW][C]F-TEST (DF denominator)[/C][C]48[/C][/ROW]
[ROW][C]p-value[/C][C]3.5527136788005e-15[/C][/ROW]
[ROW][C]Multiple Linear Regression - Residual Statistics[/C][/ROW]
[ROW][C]Residual Standard Deviation[/C][C]4.38040539124709[/C][/ROW]
[ROW][C]Sum Squared Residuals[/C][C]921.021666799997[/C][/ROW]
[/TABLE]
Source: https://freestatistics.org/blog/index.php?pk=102618&T=3

Globally Unique Identifier (entire table): ba.freestatistics.org/blog/index.php?pk=102618&T=3

As an alternative you can also use a QR Code:  

The GUIDs for individual cells are displayed in the table below:

Multiple Linear Regression - Regression Statistics
Multiple R0.914125792852386
R-squared0.835625965158004
Adjusted R-squared0.797956915506713
F-TEST (value)22.1833567051345
F-TEST (DF numerator)11
F-TEST (DF denominator)48
p-value3.5527136788005e-15
Multiple Linear Regression - Residual Statistics
Residual Standard Deviation4.38040539124709
Sum Squared Residuals921.021666799997


Multiple Linear Regression - Actuals, Interpolation, and Residuals
Time or IndexActualsInterpolationForecastResidualsPrediction Error
163.15267.0729999999998-3.9209999999998
260.10664.9492-4.84320000000002
372.61675.8446-3.22859999999997
473.15973.996-0.836999999999917
568.84869.8624-1.01440000000000
677.05678.504-1.448
762.24667.6556-5.40959999999995
860.77760.51380.263200000000004
964.51362.07542.4376
1058.35364.487-6.13399999999998
1156.51155.42161.08940000000000
1244.55444.9444-0.390399999999999
1371.41467.0734.34099999999995
1465.71964.94920.769799999999996
1580.99775.84465.15239999999999
1669.82673.996-4.17000000000003
1765.38669.8624-4.47640000000001
1875.58978.504-2.915
1965.5267.6556-2.13560000000001
2059.00360.5138-1.51080000000000
2163.96162.07541.8856
2259.71664.487-4.771
2357.5255.42162.09840000000000
2442.88644.9444-2.05839999999999
2569.80567.0732.73199999999996
2664.65664.9492-0.293199999999991
2780.35375.84464.50839999999998
2871.32173.996-2.67500000000002
2976.57769.86246.7146
3081.5878.5043.076
3171.12767.65563.47139999999998
3263.47860.51382.9642
3348.15262.0754-13.9234
3469.23664.4874.749
3557.03855.42161.61640000000000
3643.62144.9444-1.32339999999999
3769.55167.0732.47799999999995
3872.00964.94927.0598
3972.1475.8446-3.70460000000001
4081.51973.9967.52299999999998
4173.3169.86243.4476
4280.40678.5041.90200000000000
4370.69767.65563.04139999999999
4459.32860.5138-1.1858
4568.28162.07546.2056
4670.04164.4875.55399999999999
4751.24455.4216-4.1776
4846.53844.94441.59360000000000
4961.44367.073-5.63000000000005
5062.25664.9492-2.69320000000000
5173.11775.8446-2.72760000000001
5274.15573.9960.158999999999981
5365.19169.8624-4.6714
5477.88978.504-0.615000000000005
5568.68867.65561.03239999999999
5659.98360.5138-0.530800000000005
5765.4762.07543.3946
5865.08964.4870.601999999999994
5954.79555.4216-0.626599999999998
6047.12344.94442.17860000000000

\begin{tabular}{lllllllll}
\hline
Multiple Linear Regression - Actuals, Interpolation, and Residuals \tabularnewline
Time or Index & Actuals & InterpolationForecast & ResidualsPrediction Error \tabularnewline
1 & 63.152 & 67.0729999999998 & -3.9209999999998 \tabularnewline
2 & 60.106 & 64.9492 & -4.84320000000002 \tabularnewline
3 & 72.616 & 75.8446 & -3.22859999999997 \tabularnewline
4 & 73.159 & 73.996 & -0.836999999999917 \tabularnewline
5 & 68.848 & 69.8624 & -1.01440000000000 \tabularnewline
6 & 77.056 & 78.504 & -1.448 \tabularnewline
7 & 62.246 & 67.6556 & -5.40959999999995 \tabularnewline
8 & 60.777 & 60.5138 & 0.263200000000004 \tabularnewline
9 & 64.513 & 62.0754 & 2.4376 \tabularnewline
10 & 58.353 & 64.487 & -6.13399999999998 \tabularnewline
11 & 56.511 & 55.4216 & 1.08940000000000 \tabularnewline
12 & 44.554 & 44.9444 & -0.390399999999999 \tabularnewline
13 & 71.414 & 67.073 & 4.34099999999995 \tabularnewline
14 & 65.719 & 64.9492 & 0.769799999999996 \tabularnewline
15 & 80.997 & 75.8446 & 5.15239999999999 \tabularnewline
16 & 69.826 & 73.996 & -4.17000000000003 \tabularnewline
17 & 65.386 & 69.8624 & -4.47640000000001 \tabularnewline
18 & 75.589 & 78.504 & -2.915 \tabularnewline
19 & 65.52 & 67.6556 & -2.13560000000001 \tabularnewline
20 & 59.003 & 60.5138 & -1.51080000000000 \tabularnewline
21 & 63.961 & 62.0754 & 1.8856 \tabularnewline
22 & 59.716 & 64.487 & -4.771 \tabularnewline
23 & 57.52 & 55.4216 & 2.09840000000000 \tabularnewline
24 & 42.886 & 44.9444 & -2.05839999999999 \tabularnewline
25 & 69.805 & 67.073 & 2.73199999999996 \tabularnewline
26 & 64.656 & 64.9492 & -0.293199999999991 \tabularnewline
27 & 80.353 & 75.8446 & 4.50839999999998 \tabularnewline
28 & 71.321 & 73.996 & -2.67500000000002 \tabularnewline
29 & 76.577 & 69.8624 & 6.7146 \tabularnewline
30 & 81.58 & 78.504 & 3.076 \tabularnewline
31 & 71.127 & 67.6556 & 3.47139999999998 \tabularnewline
32 & 63.478 & 60.5138 & 2.9642 \tabularnewline
33 & 48.152 & 62.0754 & -13.9234 \tabularnewline
34 & 69.236 & 64.487 & 4.749 \tabularnewline
35 & 57.038 & 55.4216 & 1.61640000000000 \tabularnewline
36 & 43.621 & 44.9444 & -1.32339999999999 \tabularnewline
37 & 69.551 & 67.073 & 2.47799999999995 \tabularnewline
38 & 72.009 & 64.9492 & 7.0598 \tabularnewline
39 & 72.14 & 75.8446 & -3.70460000000001 \tabularnewline
40 & 81.519 & 73.996 & 7.52299999999998 \tabularnewline
41 & 73.31 & 69.8624 & 3.4476 \tabularnewline
42 & 80.406 & 78.504 & 1.90200000000000 \tabularnewline
43 & 70.697 & 67.6556 & 3.04139999999999 \tabularnewline
44 & 59.328 & 60.5138 & -1.1858 \tabularnewline
45 & 68.281 & 62.0754 & 6.2056 \tabularnewline
46 & 70.041 & 64.487 & 5.55399999999999 \tabularnewline
47 & 51.244 & 55.4216 & -4.1776 \tabularnewline
48 & 46.538 & 44.9444 & 1.59360000000000 \tabularnewline
49 & 61.443 & 67.073 & -5.63000000000005 \tabularnewline
50 & 62.256 & 64.9492 & -2.69320000000000 \tabularnewline
51 & 73.117 & 75.8446 & -2.72760000000001 \tabularnewline
52 & 74.155 & 73.996 & 0.158999999999981 \tabularnewline
53 & 65.191 & 69.8624 & -4.6714 \tabularnewline
54 & 77.889 & 78.504 & -0.615000000000005 \tabularnewline
55 & 68.688 & 67.6556 & 1.03239999999999 \tabularnewline
56 & 59.983 & 60.5138 & -0.530800000000005 \tabularnewline
57 & 65.47 & 62.0754 & 3.3946 \tabularnewline
58 & 65.089 & 64.487 & 0.601999999999994 \tabularnewline
59 & 54.795 & 55.4216 & -0.626599999999998 \tabularnewline
60 & 47.123 & 44.9444 & 2.17860000000000 \tabularnewline
\hline
\end{tabular}
%Source: https://freestatistics.org/blog/index.php?pk=102618&T=4

[TABLE]
[ROW][C]Multiple Linear Regression - Actuals, Interpolation, and Residuals[/C][/ROW]
[ROW][C]Time or Index[/C][C]Actuals[/C][C]InterpolationForecast[/C][C]ResidualsPrediction Error[/C][/ROW]
[ROW][C]1[/C][C]63.152[/C][C]67.0729999999998[/C][C]-3.9209999999998[/C][/ROW]
[ROW][C]2[/C][C]60.106[/C][C]64.9492[/C][C]-4.84320000000002[/C][/ROW]
[ROW][C]3[/C][C]72.616[/C][C]75.8446[/C][C]-3.22859999999997[/C][/ROW]
[ROW][C]4[/C][C]73.159[/C][C]73.996[/C][C]-0.836999999999917[/C][/ROW]
[ROW][C]5[/C][C]68.848[/C][C]69.8624[/C][C]-1.01440000000000[/C][/ROW]
[ROW][C]6[/C][C]77.056[/C][C]78.504[/C][C]-1.448[/C][/ROW]
[ROW][C]7[/C][C]62.246[/C][C]67.6556[/C][C]-5.40959999999995[/C][/ROW]
[ROW][C]8[/C][C]60.777[/C][C]60.5138[/C][C]0.263200000000004[/C][/ROW]
[ROW][C]9[/C][C]64.513[/C][C]62.0754[/C][C]2.4376[/C][/ROW]
[ROW][C]10[/C][C]58.353[/C][C]64.487[/C][C]-6.13399999999998[/C][/ROW]
[ROW][C]11[/C][C]56.511[/C][C]55.4216[/C][C]1.08940000000000[/C][/ROW]
[ROW][C]12[/C][C]44.554[/C][C]44.9444[/C][C]-0.390399999999999[/C][/ROW]
[ROW][C]13[/C][C]71.414[/C][C]67.073[/C][C]4.34099999999995[/C][/ROW]
[ROW][C]14[/C][C]65.719[/C][C]64.9492[/C][C]0.769799999999996[/C][/ROW]
[ROW][C]15[/C][C]80.997[/C][C]75.8446[/C][C]5.15239999999999[/C][/ROW]
[ROW][C]16[/C][C]69.826[/C][C]73.996[/C][C]-4.17000000000003[/C][/ROW]
[ROW][C]17[/C][C]65.386[/C][C]69.8624[/C][C]-4.47640000000001[/C][/ROW]
[ROW][C]18[/C][C]75.589[/C][C]78.504[/C][C]-2.915[/C][/ROW]
[ROW][C]19[/C][C]65.52[/C][C]67.6556[/C][C]-2.13560000000001[/C][/ROW]
[ROW][C]20[/C][C]59.003[/C][C]60.5138[/C][C]-1.51080000000000[/C][/ROW]
[ROW][C]21[/C][C]63.961[/C][C]62.0754[/C][C]1.8856[/C][/ROW]
[ROW][C]22[/C][C]59.716[/C][C]64.487[/C][C]-4.771[/C][/ROW]
[ROW][C]23[/C][C]57.52[/C][C]55.4216[/C][C]2.09840000000000[/C][/ROW]
[ROW][C]24[/C][C]42.886[/C][C]44.9444[/C][C]-2.05839999999999[/C][/ROW]
[ROW][C]25[/C][C]69.805[/C][C]67.073[/C][C]2.73199999999996[/C][/ROW]
[ROW][C]26[/C][C]64.656[/C][C]64.9492[/C][C]-0.293199999999991[/C][/ROW]
[ROW][C]27[/C][C]80.353[/C][C]75.8446[/C][C]4.50839999999998[/C][/ROW]
[ROW][C]28[/C][C]71.321[/C][C]73.996[/C][C]-2.67500000000002[/C][/ROW]
[ROW][C]29[/C][C]76.577[/C][C]69.8624[/C][C]6.7146[/C][/ROW]
[ROW][C]30[/C][C]81.58[/C][C]78.504[/C][C]3.076[/C][/ROW]
[ROW][C]31[/C][C]71.127[/C][C]67.6556[/C][C]3.47139999999998[/C][/ROW]
[ROW][C]32[/C][C]63.478[/C][C]60.5138[/C][C]2.9642[/C][/ROW]
[ROW][C]33[/C][C]48.152[/C][C]62.0754[/C][C]-13.9234[/C][/ROW]
[ROW][C]34[/C][C]69.236[/C][C]64.487[/C][C]4.749[/C][/ROW]
[ROW][C]35[/C][C]57.038[/C][C]55.4216[/C][C]1.61640000000000[/C][/ROW]
[ROW][C]36[/C][C]43.621[/C][C]44.9444[/C][C]-1.32339999999999[/C][/ROW]
[ROW][C]37[/C][C]69.551[/C][C]67.073[/C][C]2.47799999999995[/C][/ROW]
[ROW][C]38[/C][C]72.009[/C][C]64.9492[/C][C]7.0598[/C][/ROW]
[ROW][C]39[/C][C]72.14[/C][C]75.8446[/C][C]-3.70460000000001[/C][/ROW]
[ROW][C]40[/C][C]81.519[/C][C]73.996[/C][C]7.52299999999998[/C][/ROW]
[ROW][C]41[/C][C]73.31[/C][C]69.8624[/C][C]3.4476[/C][/ROW]
[ROW][C]42[/C][C]80.406[/C][C]78.504[/C][C]1.90200000000000[/C][/ROW]
[ROW][C]43[/C][C]70.697[/C][C]67.6556[/C][C]3.04139999999999[/C][/ROW]
[ROW][C]44[/C][C]59.328[/C][C]60.5138[/C][C]-1.1858[/C][/ROW]
[ROW][C]45[/C][C]68.281[/C][C]62.0754[/C][C]6.2056[/C][/ROW]
[ROW][C]46[/C][C]70.041[/C][C]64.487[/C][C]5.55399999999999[/C][/ROW]
[ROW][C]47[/C][C]51.244[/C][C]55.4216[/C][C]-4.1776[/C][/ROW]
[ROW][C]48[/C][C]46.538[/C][C]44.9444[/C][C]1.59360000000000[/C][/ROW]
[ROW][C]49[/C][C]61.443[/C][C]67.073[/C][C]-5.63000000000005[/C][/ROW]
[ROW][C]50[/C][C]62.256[/C][C]64.9492[/C][C]-2.69320000000000[/C][/ROW]
[ROW][C]51[/C][C]73.117[/C][C]75.8446[/C][C]-2.72760000000001[/C][/ROW]
[ROW][C]52[/C][C]74.155[/C][C]73.996[/C][C]0.158999999999981[/C][/ROW]
[ROW][C]53[/C][C]65.191[/C][C]69.8624[/C][C]-4.6714[/C][/ROW]
[ROW][C]54[/C][C]77.889[/C][C]78.504[/C][C]-0.615000000000005[/C][/ROW]
[ROW][C]55[/C][C]68.688[/C][C]67.6556[/C][C]1.03239999999999[/C][/ROW]
[ROW][C]56[/C][C]59.983[/C][C]60.5138[/C][C]-0.530800000000005[/C][/ROW]
[ROW][C]57[/C][C]65.47[/C][C]62.0754[/C][C]3.3946[/C][/ROW]
[ROW][C]58[/C][C]65.089[/C][C]64.487[/C][C]0.601999999999994[/C][/ROW]
[ROW][C]59[/C][C]54.795[/C][C]55.4216[/C][C]-0.626599999999998[/C][/ROW]
[ROW][C]60[/C][C]47.123[/C][C]44.9444[/C][C]2.17860000000000[/C][/ROW]
[/TABLE]
Source: https://freestatistics.org/blog/index.php?pk=102618&T=4

Globally Unique Identifier (entire table): ba.freestatistics.org/blog/index.php?pk=102618&T=4

As an alternative you can also use a QR Code:  

The GUIDs for individual cells are displayed in the table below:

Multiple Linear Regression - Actuals, Interpolation, and Residuals
Time or IndexActualsInterpolationForecastResidualsPrediction Error
163.15267.0729999999998-3.9209999999998
260.10664.9492-4.84320000000002
372.61675.8446-3.22859999999997
473.15973.996-0.836999999999917
568.84869.8624-1.01440000000000
677.05678.504-1.448
762.24667.6556-5.40959999999995
860.77760.51380.263200000000004
964.51362.07542.4376
1058.35364.487-6.13399999999998
1156.51155.42161.08940000000000
1244.55444.9444-0.390399999999999
1371.41467.0734.34099999999995
1465.71964.94920.769799999999996
1580.99775.84465.15239999999999
1669.82673.996-4.17000000000003
1765.38669.8624-4.47640000000001
1875.58978.504-2.915
1965.5267.6556-2.13560000000001
2059.00360.5138-1.51080000000000
2163.96162.07541.8856
2259.71664.487-4.771
2357.5255.42162.09840000000000
2442.88644.9444-2.05839999999999
2569.80567.0732.73199999999996
2664.65664.9492-0.293199999999991
2780.35375.84464.50839999999998
2871.32173.996-2.67500000000002
2976.57769.86246.7146
3081.5878.5043.076
3171.12767.65563.47139999999998
3263.47860.51382.9642
3348.15262.0754-13.9234
3469.23664.4874.749
3557.03855.42161.61640000000000
3643.62144.9444-1.32339999999999
3769.55167.0732.47799999999995
3872.00964.94927.0598
3972.1475.8446-3.70460000000001
4081.51973.9967.52299999999998
4173.3169.86243.4476
4280.40678.5041.90200000000000
4370.69767.65563.04139999999999
4459.32860.5138-1.1858
4568.28162.07546.2056
4670.04164.4875.55399999999999
4751.24455.4216-4.1776
4846.53844.94441.59360000000000
4961.44367.073-5.63000000000005
5062.25664.9492-2.69320000000000
5173.11775.8446-2.72760000000001
5274.15573.9960.158999999999981
5365.19169.8624-4.6714
5477.88978.504-0.615000000000005
5568.68867.65561.03239999999999
5659.98360.5138-0.530800000000005
5765.4762.07543.3946
5865.08964.4870.601999999999994
5954.79555.4216-0.626599999999998
6047.12344.94442.17860000000000


Goldfeld-Quandt test for Heteroskedasticity
p-valuesAlternative Hypothesis
breakpoint indexgreater2-sidedless
150.70792545438350.5841490912330010.292074545616500
160.5986326155855480.8027347688289040.401367384414452
170.505817284133840.988365431732320.49418271586616
180.3850676646931770.7701353293863530.614932335306823
190.3056432319685120.6112864639370240.694356768031488
200.2133101887753330.4266203775506650.786689811224667
210.140817981063970.281635962127940.85918201893603
220.1126829743297970.2253659486595930.887317025670203
230.0712046685031090.1424093370062180.928795331496891
240.04423075079488040.08846150158976080.95576924920512
250.03080997254266220.06161994508532440.969190027457338
260.01832025474484690.03664050948969370.981679745255153
270.01857922648925240.03715845297850490.981420773510748
280.01281421807890590.02562843615781180.987185781921094
290.05912029750273760.1182405950054750.940879702497262
300.05529234818817740.1105846963763550.944707651811823
310.06621288388561060.1324257677712210.933787116114389
320.05193759277992880.1038751855598580.948062407220071
330.8153011775772780.3693976448454430.184698822422722
340.8336128315649390.3327743368701220.166387168435061
350.7959035570909280.4081928858181450.204096442909072
360.7396755083819140.5206489832361710.260324491618086
370.7820449845573720.4359100308852560.217955015442628
380.9209264589665140.1581470820669710.0790735410334856
390.8843439853373480.2313120293253050.115656014662652
400.946276345560650.1074473088786980.053723654439349
410.987655324061940.02468935187611820.0123446759380591
420.977186107671880.04562778465624000.0228138923281200
430.954739776440120.09052044711975980.0452602235598799
440.8948898422695550.210220315460890.105110157730445
450.8398759735788120.3202480528423760.160124026421188

\begin{tabular}{lllllllll}
\hline
Goldfeld-Quandt test for Heteroskedasticity \tabularnewline
p-values & Alternative Hypothesis \tabularnewline
breakpoint index & greater & 2-sided & less \tabularnewline
15 & 0.7079254543835 & 0.584149091233001 & 0.292074545616500 \tabularnewline
16 & 0.598632615585548 & 0.802734768828904 & 0.401367384414452 \tabularnewline
17 & 0.50581728413384 & 0.98836543173232 & 0.49418271586616 \tabularnewline
18 & 0.385067664693177 & 0.770135329386353 & 0.614932335306823 \tabularnewline
19 & 0.305643231968512 & 0.611286463937024 & 0.694356768031488 \tabularnewline
20 & 0.213310188775333 & 0.426620377550665 & 0.786689811224667 \tabularnewline
21 & 0.14081798106397 & 0.28163596212794 & 0.85918201893603 \tabularnewline
22 & 0.112682974329797 & 0.225365948659593 & 0.887317025670203 \tabularnewline
23 & 0.071204668503109 & 0.142409337006218 & 0.928795331496891 \tabularnewline
24 & 0.0442307507948804 & 0.0884615015897608 & 0.95576924920512 \tabularnewline
25 & 0.0308099725426622 & 0.0616199450853244 & 0.969190027457338 \tabularnewline
26 & 0.0183202547448469 & 0.0366405094896937 & 0.981679745255153 \tabularnewline
27 & 0.0185792264892524 & 0.0371584529785049 & 0.981420773510748 \tabularnewline
28 & 0.0128142180789059 & 0.0256284361578118 & 0.987185781921094 \tabularnewline
29 & 0.0591202975027376 & 0.118240595005475 & 0.940879702497262 \tabularnewline
30 & 0.0552923481881774 & 0.110584696376355 & 0.944707651811823 \tabularnewline
31 & 0.0662128838856106 & 0.132425767771221 & 0.933787116114389 \tabularnewline
32 & 0.0519375927799288 & 0.103875185559858 & 0.948062407220071 \tabularnewline
33 & 0.815301177577278 & 0.369397644845443 & 0.184698822422722 \tabularnewline
34 & 0.833612831564939 & 0.332774336870122 & 0.166387168435061 \tabularnewline
35 & 0.795903557090928 & 0.408192885818145 & 0.204096442909072 \tabularnewline
36 & 0.739675508381914 & 0.520648983236171 & 0.260324491618086 \tabularnewline
37 & 0.782044984557372 & 0.435910030885256 & 0.217955015442628 \tabularnewline
38 & 0.920926458966514 & 0.158147082066971 & 0.0790735410334856 \tabularnewline
39 & 0.884343985337348 & 0.231312029325305 & 0.115656014662652 \tabularnewline
40 & 0.94627634556065 & 0.107447308878698 & 0.053723654439349 \tabularnewline
41 & 0.98765532406194 & 0.0246893518761182 & 0.0123446759380591 \tabularnewline
42 & 0.97718610767188 & 0.0456277846562400 & 0.0228138923281200 \tabularnewline
43 & 0.95473977644012 & 0.0905204471197598 & 0.0452602235598799 \tabularnewline
44 & 0.894889842269555 & 0.21022031546089 & 0.105110157730445 \tabularnewline
45 & 0.839875973578812 & 0.320248052842376 & 0.160124026421188 \tabularnewline
\hline
\end{tabular}
%Source: https://freestatistics.org/blog/index.php?pk=102618&T=5

[TABLE]
[ROW][C]Goldfeld-Quandt test for Heteroskedasticity[/C][/ROW]
[ROW][C]p-values[/C][C]Alternative Hypothesis[/C][/ROW]
[ROW][C]breakpoint index[/C][C]greater[/C][C]2-sided[/C][C]less[/C][/ROW]
[ROW][C]15[/C][C]0.7079254543835[/C][C]0.584149091233001[/C][C]0.292074545616500[/C][/ROW]
[ROW][C]16[/C][C]0.598632615585548[/C][C]0.802734768828904[/C][C]0.401367384414452[/C][/ROW]
[ROW][C]17[/C][C]0.50581728413384[/C][C]0.98836543173232[/C][C]0.49418271586616[/C][/ROW]
[ROW][C]18[/C][C]0.385067664693177[/C][C]0.770135329386353[/C][C]0.614932335306823[/C][/ROW]
[ROW][C]19[/C][C]0.305643231968512[/C][C]0.611286463937024[/C][C]0.694356768031488[/C][/ROW]
[ROW][C]20[/C][C]0.213310188775333[/C][C]0.426620377550665[/C][C]0.786689811224667[/C][/ROW]
[ROW][C]21[/C][C]0.14081798106397[/C][C]0.28163596212794[/C][C]0.85918201893603[/C][/ROW]
[ROW][C]22[/C][C]0.112682974329797[/C][C]0.225365948659593[/C][C]0.887317025670203[/C][/ROW]
[ROW][C]23[/C][C]0.071204668503109[/C][C]0.142409337006218[/C][C]0.928795331496891[/C][/ROW]
[ROW][C]24[/C][C]0.0442307507948804[/C][C]0.0884615015897608[/C][C]0.95576924920512[/C][/ROW]
[ROW][C]25[/C][C]0.0308099725426622[/C][C]0.0616199450853244[/C][C]0.969190027457338[/C][/ROW]
[ROW][C]26[/C][C]0.0183202547448469[/C][C]0.0366405094896937[/C][C]0.981679745255153[/C][/ROW]
[ROW][C]27[/C][C]0.0185792264892524[/C][C]0.0371584529785049[/C][C]0.981420773510748[/C][/ROW]
[ROW][C]28[/C][C]0.0128142180789059[/C][C]0.0256284361578118[/C][C]0.987185781921094[/C][/ROW]
[ROW][C]29[/C][C]0.0591202975027376[/C][C]0.118240595005475[/C][C]0.940879702497262[/C][/ROW]
[ROW][C]30[/C][C]0.0552923481881774[/C][C]0.110584696376355[/C][C]0.944707651811823[/C][/ROW]
[ROW][C]31[/C][C]0.0662128838856106[/C][C]0.132425767771221[/C][C]0.933787116114389[/C][/ROW]
[ROW][C]32[/C][C]0.0519375927799288[/C][C]0.103875185559858[/C][C]0.948062407220071[/C][/ROW]
[ROW][C]33[/C][C]0.815301177577278[/C][C]0.369397644845443[/C][C]0.184698822422722[/C][/ROW]
[ROW][C]34[/C][C]0.833612831564939[/C][C]0.332774336870122[/C][C]0.166387168435061[/C][/ROW]
[ROW][C]35[/C][C]0.795903557090928[/C][C]0.408192885818145[/C][C]0.204096442909072[/C][/ROW]
[ROW][C]36[/C][C]0.739675508381914[/C][C]0.520648983236171[/C][C]0.260324491618086[/C][/ROW]
[ROW][C]37[/C][C]0.782044984557372[/C][C]0.435910030885256[/C][C]0.217955015442628[/C][/ROW]
[ROW][C]38[/C][C]0.920926458966514[/C][C]0.158147082066971[/C][C]0.0790735410334856[/C][/ROW]
[ROW][C]39[/C][C]0.884343985337348[/C][C]0.231312029325305[/C][C]0.115656014662652[/C][/ROW]
[ROW][C]40[/C][C]0.94627634556065[/C][C]0.107447308878698[/C][C]0.053723654439349[/C][/ROW]
[ROW][C]41[/C][C]0.98765532406194[/C][C]0.0246893518761182[/C][C]0.0123446759380591[/C][/ROW]
[ROW][C]42[/C][C]0.97718610767188[/C][C]0.0456277846562400[/C][C]0.0228138923281200[/C][/ROW]
[ROW][C]43[/C][C]0.95473977644012[/C][C]0.0905204471197598[/C][C]0.0452602235598799[/C][/ROW]
[ROW][C]44[/C][C]0.894889842269555[/C][C]0.21022031546089[/C][C]0.105110157730445[/C][/ROW]
[ROW][C]45[/C][C]0.839875973578812[/C][C]0.320248052842376[/C][C]0.160124026421188[/C][/ROW]
[/TABLE]
Source: https://freestatistics.org/blog/index.php?pk=102618&T=5

Globally Unique Identifier (entire table): ba.freestatistics.org/blog/index.php?pk=102618&T=5

As an alternative you can also use a QR Code:  

The GUIDs for individual cells are displayed in the table below:

Goldfeld-Quandt test for Heteroskedasticity
p-valuesAlternative Hypothesis
breakpoint indexgreater2-sidedless
150.70792545438350.5841490912330010.292074545616500
160.5986326155855480.8027347688289040.401367384414452
170.505817284133840.988365431732320.49418271586616
180.3850676646931770.7701353293863530.614932335306823
190.3056432319685120.6112864639370240.694356768031488
200.2133101887753330.4266203775506650.786689811224667
210.140817981063970.281635962127940.85918201893603
220.1126829743297970.2253659486595930.887317025670203
230.0712046685031090.1424093370062180.928795331496891
240.04423075079488040.08846150158976080.95576924920512
250.03080997254266220.06161994508532440.969190027457338
260.01832025474484690.03664050948969370.981679745255153
270.01857922648925240.03715845297850490.981420773510748
280.01281421807890590.02562843615781180.987185781921094
290.05912029750273760.1182405950054750.940879702497262
300.05529234818817740.1105846963763550.944707651811823
310.06621288388561060.1324257677712210.933787116114389
320.05193759277992880.1038751855598580.948062407220071
330.8153011775772780.3693976448454430.184698822422722
340.8336128315649390.3327743368701220.166387168435061
350.7959035570909280.4081928858181450.204096442909072
360.7396755083819140.5206489832361710.260324491618086
370.7820449845573720.4359100308852560.217955015442628
380.9209264589665140.1581470820669710.0790735410334856
390.8843439853373480.2313120293253050.115656014662652
400.946276345560650.1074473088786980.053723654439349
410.987655324061940.02468935187611820.0123446759380591
420.977186107671880.04562778465624000.0228138923281200
430.954739776440120.09052044711975980.0452602235598799
440.8948898422695550.210220315460890.105110157730445
450.8398759735788120.3202480528423760.160124026421188


Meta Analysis of Goldfeld-Quandt test for Heteroskedasticity
Description# significant tests% significant testsOK/NOK
1% type I error level00OK
5% type I error level50.161290322580645NOK
10% type I error level80.258064516129032NOK

\begin{tabular}{lllllllll}
\hline
Meta Analysis of Goldfeld-Quandt test for Heteroskedasticity \tabularnewline
Description & # significant tests & % significant tests & OK/NOK \tabularnewline
1% type I error level & 0 & 0 & OK \tabularnewline
5% type I error level & 5 & 0.161290322580645 & NOK \tabularnewline
10% type I error level & 8 & 0.258064516129032 & NOK \tabularnewline
\hline
\end{tabular}
%Source: https://freestatistics.org/blog/index.php?pk=102618&T=6

[TABLE]
[ROW][C]Meta Analysis of Goldfeld-Quandt test for Heteroskedasticity[/C][/ROW]
[ROW][C]Description[/C][C]# significant tests[/C][C]% significant tests[/C][C]OK/NOK[/C][/ROW]
[ROW][C]1% type I error level[/C][C]0[/C][C]0[/C][C]OK[/C][/ROW]
[ROW][C]5% type I error level[/C][C]5[/C][C]0.161290322580645[/C][C]NOK[/C][/ROW]
[ROW][C]10% type I error level[/C][C]8[/C][C]0.258064516129032[/C][C]NOK[/C][/ROW]
[/TABLE]
Source: https://freestatistics.org/blog/index.php?pk=102618&T=6

Globally Unique Identifier (entire table): ba.freestatistics.org/blog/index.php?pk=102618&T=6

As an alternative you can also use a QR Code:  

The GUIDs for individual cells are displayed in the table below:

Meta Analysis of Goldfeld-Quandt test for Heteroskedasticity
Description# significant tests% significant testsOK/NOK
1% type I error level00OK
5% type I error level50.161290322580645NOK
10% type I error level80.258064516129032NOK


Parameters (Session):
par1 = 1 ; par2 = Include Monthly Dummies ; par3 = No Linear Trend ;
Parameters (R input):
par1 = 1 ; par2 = Include Monthly Dummies ; par3 = No Linear Trend ;
R code (references can be found in the software module):
library(lattice)
library(lmtest)
n25 <- 25 #minimum number of obs. for Goldfeld-Quandt test
par1 <- as.numeric(par1)
x <- t(y)
k <- length(x[1,])
n <- length(x[,1])
x1 <- cbind(x[,par1], x[,1:k!=par1])
mycolnames <- c(colnames(x)[par1], colnames(x)[1:k!=par1])
colnames(x1) <- mycolnames #colnames(x)[par1]
x <- x1
if (par3 == 'First Differences'){
x2 <- array(0, dim=c(n-1,k), dimnames=list(1:(n-1), paste('(1-B)',colnames(x),sep='')))
for (i in 1:n-1) {
for (j in 1:k) {
x2[i,j] <- x[i+1,j] - x[i,j]
}
}
x <- x2
}
if (par2 == 'Include Monthly Dummies'){
x2 <- array(0, dim=c(n,11), dimnames=list(1:n, paste('M', seq(1:11), sep ='')))
for (i in 1:11){
x2[seq(i,n,12),i] <- 1
}
x <- cbind(x, x2)
}
if (par2 == 'Include Quarterly Dummies'){
x2 <- array(0, dim=c(n,3), dimnames=list(1:n, paste('Q', seq(1:3), sep ='')))
for (i in 1:3){
x2[seq(i,n,4),i] <- 1
}
x <- cbind(x, x2)
}
k <- length(x[1,])
if (par3 == 'Linear Trend'){
x <- cbind(x, c(1:n))
colnames(x)[k+1] <- 't'
}
x
k <- length(x[1,])
df <- as.data.frame(x)
(mylm <- lm(df))
(mysum <- summary(mylm))
if (n > n25) {
kp3 <- k + 3
nmkm3 <- n - k - 3
gqarr <- array(NA, dim=c(nmkm3-kp3+1,3))
numgqtests <- 0
numsignificant1 <- 0
numsignificant5 <- 0
numsignificant10 <- 0
for (mypoint in kp3:nmkm3) {
j <- 0
numgqtests <- numgqtests + 1
for (myalt in c('greater', 'two.sided', 'less')) {
j <- j + 1
gqarr[mypoint-kp3+1,j] <- gqtest(mylm, point=mypoint, alternative=myalt)$p.value
}
if (gqarr[mypoint-kp3+1,2] < 0.01) numsignificant1 <- numsignificant1 + 1
if (gqarr[mypoint-kp3+1,2] < 0.05) numsignificant5 <- numsignificant5 + 1
if (gqarr[mypoint-kp3+1,2] < 0.10) numsignificant10 <- numsignificant10 + 1
}
gqarr
}
bitmap(file='test0.png')
plot(x[,1], type='l', main='Actuals and Interpolation', ylab='value of Actuals and Interpolation (dots)', xlab='time or index')
points(x[,1]-mysum$resid)
grid()
dev.off()
bitmap(file='test1.png')
plot(mysum$resid, type='b', pch=19, main='Residuals', ylab='value of Residuals', xlab='time or index')
grid()
dev.off()
bitmap(file='test2.png')
hist(mysum$resid, main='Residual Histogram', xlab='values of Residuals')
grid()
dev.off()
bitmap(file='test3.png')
densityplot(~mysum$resid,col='black',main='Residual Density Plot', xlab='values of Residuals')
dev.off()
bitmap(file='test4.png')
qqnorm(mysum$resid, main='Residual Normal Q-Q Plot')
qqline(mysum$resid)
grid()
dev.off()
(myerror <- as.ts(mysum$resid))
bitmap(file='test5.png')
dum <- cbind(lag(myerror,k=1),myerror)
dum
dum1 <- dum[2:length(myerror),]
dum1
z <- as.data.frame(dum1)
z
plot(z,main=paste('Residual Lag plot, lowess, and regression line'), ylab='values of Residuals', xlab='lagged values of Residuals')
lines(lowess(z))
abline(lm(z))
grid()
dev.off()
bitmap(file='test6.png')
acf(mysum$resid, lag.max=length(mysum$resid)/2, main='Residual Autocorrelation Function')
grid()
dev.off()
bitmap(file='test7.png')
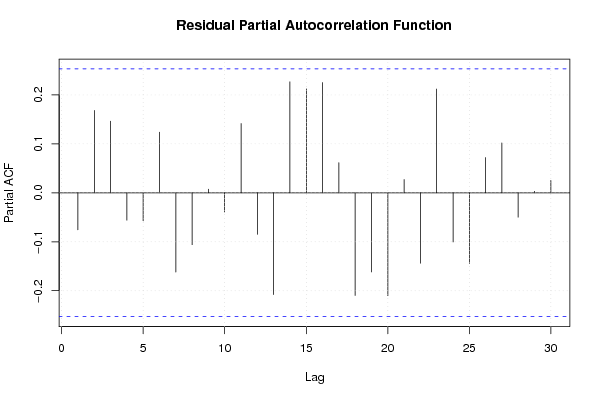
pacf(mysum$resid, lag.max=length(mysum$resid)/2, main='Residual Partial Autocorrelation Function')
grid()
dev.off()
bitmap(file='test8.png')
opar <- par(mfrow = c(2,2), oma = c(0, 0, 1.1, 0))
plot(mylm, las = 1, sub='Residual Diagnostics')
par(opar)
dev.off()
if (n > n25) {
bitmap(file='test9.png')
plot(kp3:nmkm3,gqarr[,2], main='Goldfeld-Quandt test',ylab='2-sided p-value',xlab='breakpoint')
grid()
dev.off()
}
load(file='createtable')
a<-table.start()
a<-table.row.start(a)
a<-table.element(a, 'Multiple Linear Regression - Estimated Regression Equation', 1, TRUE)
a<-table.row.end(a)
myeq <- colnames(x)[1]
myeq <- paste(myeq, '[t] = ', sep='')
for (i in 1:k){
if (mysum$coefficients[i,1] > 0) myeq <- paste(myeq, '+', '')
myeq <- paste(myeq, mysum$coefficients[i,1], sep=' ')
if (rownames(mysum$coefficients)[i] != '(Intercept)') {
myeq <- paste(myeq, rownames(mysum$coefficients)[i], sep='')
if (rownames(mysum$coefficients)[i] != 't') myeq <- paste(myeq, '[t]', sep='')
}
}
myeq <- paste(myeq, ' + e[t]')
a<-table.row.start(a)
a<-table.element(a, myeq)
a<-table.row.end(a)
a<-table.end(a)
table.save(a,file='mytable1.tab')
a<-table.start()
a<-table.row.start(a)
a<-table.element(a,hyperlink('ols1.htm','Multiple Linear Regression - Ordinary Least Squares',''), 6, TRUE)
a<-table.row.end(a)
a<-table.row.start(a)
a<-table.element(a,'Variable',header=TRUE)
a<-table.element(a,'Parameter',header=TRUE)
a<-table.element(a,'S.D.',header=TRUE)
a<-table.element(a,'T-STAT
H0: parameter = 0',header=TRUE)
a<-table.element(a,'2-tail p-value',header=TRUE)
a<-table.element(a,'1-tail p-value',header=TRUE)
a<-table.row.end(a)
for (i in 1:k){
a<-table.row.start(a)
a<-table.element(a,rownames(mysum$coefficients)[i],header=TRUE)
a<-table.element(a,mysum$coefficients[i,1])
a<-table.element(a, round(mysum$coefficients[i,2],6))
a<-table.element(a, round(mysum$coefficients[i,3],4))
a<-table.element(a, round(mysum$coefficients[i,4],6))
a<-table.element(a, round(mysum$coefficients[i,4]/2,6))
a<-table.row.end(a)
}
a<-table.end(a)
table.save(a,file='mytable2.tab')
a<-table.start()
a<-table.row.start(a)
a<-table.element(a, 'Multiple Linear Regression - Regression Statistics', 2, TRUE)
a<-table.row.end(a)
a<-table.row.start(a)
a<-table.element(a, 'Multiple R',1,TRUE)
a<-table.element(a, sqrt(mysum$r.squared))
a<-table.row.end(a)
a<-table.row.start(a)
a<-table.element(a, 'R-squared',1,TRUE)
a<-table.element(a, mysum$r.squared)
a<-table.row.end(a)
a<-table.row.start(a)
a<-table.element(a, 'Adjusted R-squared',1,TRUE)
a<-table.element(a, mysum$adj.r.squared)
a<-table.row.end(a)
a<-table.row.start(a)
a<-table.element(a, 'F-TEST (value)',1,TRUE)
a<-table.element(a, mysum$fstatistic[1])
a<-table.row.end(a)
a<-table.row.start(a)
a<-table.element(a, 'F-TEST (DF numerator)',1,TRUE)
a<-table.element(a, mysum$fstatistic[2])
a<-table.row.end(a)
a<-table.row.start(a)
a<-table.element(a, 'F-TEST (DF denominator)',1,TRUE)
a<-table.element(a, mysum$fstatistic[3])
a<-table.row.end(a)
a<-table.row.start(a)
a<-table.element(a, 'p-value',1,TRUE)
a<-table.element(a, 1-pf(mysum$fstatistic[1],mysum$fstatistic[2],mysum$fstatistic[3]))
a<-table.row.end(a)
a<-table.row.start(a)
a<-table.element(a, 'Multiple Linear Regression - Residual Statistics', 2, TRUE)
a<-table.row.end(a)
a<-table.row.start(a)
a<-table.element(a, 'Residual Standard Deviation',1,TRUE)
a<-table.element(a, mysum$sigma)
a<-table.row.end(a)
a<-table.row.start(a)
a<-table.element(a, 'Sum Squared Residuals',1,TRUE)
a<-table.element(a, sum(myerror*myerror))
a<-table.row.end(a)
a<-table.end(a)
table.save(a,file='mytable3.tab')
a<-table.start()
a<-table.row.start(a)
a<-table.element(a, 'Multiple Linear Regression - Actuals, Interpolation, and Residuals', 4, TRUE)
a<-table.row.end(a)
a<-table.row.start(a)
a<-table.element(a, 'Time or Index', 1, TRUE)
a<-table.element(a, 'Actuals', 1, TRUE)
a<-table.element(a, 'Interpolation
Forecast', 1, TRUE)
a<-table.element(a, 'Residuals
Prediction Error', 1, TRUE)
a<-table.row.end(a)
for (i in 1:n) {
a<-table.row.start(a)
a<-table.element(a,i, 1, TRUE)
a<-table.element(a,x[i])
a<-table.element(a,x[i]-mysum$resid[i])
a<-table.element(a,mysum$resid[i])
a<-table.row.end(a)
}
a<-table.end(a)
table.save(a,file='mytable4.tab')
if (n > n25) {
a<-table.start()
a<-table.row.start(a)
a<-table.element(a,'Goldfeld-Quandt test for Heteroskedasticity',4,TRUE)
a<-table.row.end(a)
a<-table.row.start(a)
a<-table.element(a,'p-values',header=TRUE)
a<-table.element(a,'Alternative Hypothesis',3,header=TRUE)
a<-table.row.end(a)
a<-table.row.start(a)
a<-table.element(a,'breakpoint index',header=TRUE)
a<-table.element(a,'greater',header=TRUE)
a<-table.element(a,'2-sided',header=TRUE)
a<-table.element(a,'less',header=TRUE)
a<-table.row.end(a)
for (mypoint in kp3:nmkm3) {
a<-table.row.start(a)
a<-table.element(a,mypoint,header=TRUE)
a<-table.element(a,gqarr[mypoint-kp3+1,1])
a<-table.element(a,gqarr[mypoint-kp3+1,2])
a<-table.element(a,gqarr[mypoint-kp3+1,3])
a<-table.row.end(a)
}
a<-table.end(a)
table.save(a,file='mytable5.tab')
a<-table.start()
a<-table.row.start(a)
a<-table.element(a,'Meta Analysis of Goldfeld-Quandt test for Heteroskedasticity',4,TRUE)
a<-table.row.end(a)
a<-table.row.start(a)
a<-table.element(a,'Description',header=TRUE)
a<-table.element(a,'# significant tests',header=TRUE)
a<-table.element(a,'% significant tests',header=TRUE)
a<-table.element(a,'OK/NOK',header=TRUE)
a<-table.row.end(a)
a<-table.row.start(a)
a<-table.element(a,'1% type I error level',header=TRUE)
a<-table.element(a,numsignificant1)
a<-table.element(a,numsignificant1/numgqtests)
if (numsignificant1/numgqtests < 0.01) dum <- 'OK' else dum <- 'NOK'
a<-table.element(a,dum)
a<-table.row.end(a)
a<-table.row.start(a)
a<-table.element(a,'5% type I error level',header=TRUE)
a<-table.element(a,numsignificant5)
a<-table.element(a,numsignificant5/numgqtests)
if (numsignificant5/numgqtests < 0.05) dum <- 'OK' else dum <- 'NOK'
a<-table.element(a,dum)
a<-table.row.end(a)
a<-table.row.start(a)
a<-table.element(a,'10% type I error level',header=TRUE)
a<-table.element(a,numsignificant10)
a<-table.element(a,numsignificant10/numgqtests)
if (numsignificant10/numgqtests < 0.1) dum <- 'OK' else dum <- 'NOK'
a<-table.element(a,dum)
a<-table.row.end(a)
a<-table.end(a)
table.save(a,file='mytable6.tab')
}