Free Statistics

of Irreproducible Research!

Author's title

Author*The author of this computation has been verified*
R Software Modulerwasp_multipleregression.wasp
Title produced by softwareMultiple Regression
Date of computationSun, 28 Nov 2010 16:11:23 +0000
Cite this page as followsStatistical Computations at FreeStatistics.org, Office for Research Development and Education, URL https://freestatistics.org/blog/index.php?v=date/2010/Nov/28/t1290960611lvcjrh5xwwfg1xr.htm/, Retrieved Thu, 02 May 2024 22:00:56 +0000
Statistical Computations at FreeStatistics.org, Office for Research Development and Education, URL https://freestatistics.org/blog/index.php?pk=102634, Retrieved Thu, 02 May 2024 22:00:56 +0000
QR Codes:

Original text written by user:
IsPrivate?No (this computation is public)
User-defined keywords
Estimated Impact235
Family? (F = Feedback message, R = changed R code, M = changed R Module, P = changed Parameters, D = changed Data)
-     [Multiple Regression] [Q1 The Seatbeltlaw] [2007-11-14 19:27:43] [8cd6641b921d30ebe00b648d1481bba0]
- RMPD  [Multiple Regression] [Seatbelt] [2009-11-12 13:54:52] [b98453cac15ba1066b407e146608df68]
- R PD    [Multiple Regression] [Aantal reizigers ...] [2010-11-26 01:03:33] [97ad38b1c3b35a5feca8b85f7bc7b3ff]
-    D      [Multiple Regression] [Aantal reizigers ...] [2010-11-26 01:44:20] [97ad38b1c3b35a5feca8b85f7bc7b3ff]
-    D        [Multiple Regression] [Aantal reizigers ...] [2010-11-26 01:59:36] [97ad38b1c3b35a5feca8b85f7bc7b3ff]
-   PD            [Multiple Regression] [Regressiemodel] [2010-11-28 16:11:23] [ecfb965f5669057f3ac5b58964283289] [Current]
F   PD              [Multiple Regression] [autoregression wi...] [2010-11-30 16:17:19] [3df61981e9f4dafed65341be376c4457]
Feedback Forum

Post a new message
Dataseries X:
68.848	73.159	72.616	60.106	63.152
77.056	68.848	73.159	72.616	60.106
62.246	77.056	68.848	73.159	72.616
60.777	62.246	77.056	68.848	73.159
64.513	60.777	62.246	77.056	68.848
58.353	64.513	60.777	62.246	77.056
56.511	58.353	64.513	60.777	62.246
44.554	56.511	58.353	64.513	60.777
71.414	44.554	56.511	58.353	64.513
65.719	71.414	44.554	56.511	58.353
80.997	65.719	71.414	44.554	56.511
69.826	80.997	65.719	71.414	44.554
65.386	69.826	80.997	65.719	71.414
75.589	65.386	69.826	80.997	65.719
65.520	75.589	65.386	69.826	80.997
59.003	65.520	75.589	65.386	69.826
63.961	59.003	65.520	75.589	65.386
59.716	63.961	59.003	65.520	75.589
57.520	59.716	63.961	59.003	65.520
42.886	57.520	59.716	63.961	59.003
69.805	42.886	57.520	59.716	63.961
64.656	69.805	42.886	57.520	59.716
80.353	64.656	69.805	42.886	57.520
71.321	80.353	64.656	69.805	42.886
76.577	71.321	80.353	64.656	69.805
81.580	76.577	71.321	80.353	64.656
71.127	81.580	76.577	71.321	80.353
63.478	71.127	81.580	76.577	71.321
48.152	63.478	71.127	81.580	76.577
69.236	48.152	63.478	71.127	81.580
57.038	69.236	48.152	63.478	71.127
43.621	57.038	69.236	48.152	63.478
69.551	43.621	57.038	69.236	48.152
72.009	69.551	43.621	57.038	69.236
72.140	72.009	69.551	43.621	57.038
81.519	72.140	72.009	69.551	43.621
73.310	81.519	72.140	72.009	69.551
80.406	73.310	81.519	72.140	72.009
70.697	80.406	73.310	81.519	72.140
59.328	70.697	80.406	73.310	81.519
68.281	59.328	70.697	80.406	73.310
70.041	68.281	59.328	70.697	80.406
51.244	70.041	68.281	59.328	70.697
46.538	51.244	70.041	68.281	59.328
61.443	46.538	51.244	70.041	68.281
62.256	61.443	46.538	51.244	70.041
73.117	62.256	61.443	46.538	51.244
74.155	73.117	62.256	61.443	46.538
65.191	74.155	73.117	62.256	61.443
77.889	65.191	74.155	73.117	62.256
68.688	77.889	65.191	74.155	73.117
59.983	68.688	77.889	65.191	74.155
65.470	59.983	68.688	77.889	65.191
65.089	65.470	59.983	68.688	77.889
54.795	65.089	65.470	59.983	68.688
47.123	54.795	65.089	65.470	59.983


Summary of computational transaction
Raw Inputview raw input (R code)
Raw Outputview raw output of R engine
Computing time6 seconds
R Server'George Udny Yule' @ 72.249.76.132

\begin{tabular}{lllllllll}
\hline
Summary of computational transaction \tabularnewline
Raw Input & view raw input (R code)  \tabularnewline
Raw Output & view raw output of R engine  \tabularnewline
Computing time & 6 seconds \tabularnewline
R Server & 'George Udny Yule' @ 72.249.76.132 \tabularnewline
\hline
\end{tabular}
%Source: https://freestatistics.org/blog/index.php?pk=102634&T=0

[TABLE]
[ROW][C]Summary of computational transaction[/C][/ROW]
[ROW][C]Raw Input[/C][C]view raw input (R code) [/C][/ROW]
[ROW][C]Raw Output[/C][C]view raw output of R engine [/C][/ROW]
[ROW][C]Computing time[/C][C]6 seconds[/C][/ROW]
[ROW][C]R Server[/C][C]'George Udny Yule' @ 72.249.76.132[/C][/ROW]
[/TABLE]
Source: https://freestatistics.org/blog/index.php?pk=102634&T=0

Globally Unique Identifier (entire table): ba.freestatistics.org/blog/index.php?pk=102634&T=0

As an alternative you can also use a QR Code:  

The GUIDs for individual cells are displayed in the table below:

Summary of computational transaction
Raw Inputview raw input (R code)
Raw Outputview raw output of R engine
Computing time6 seconds
R Server'George Udny Yule' @ 72.249.76.132


Multiple Linear Regression - Estimated Regression Equation
Yt[t] = + 64.6987662633607 -0.132646690016129`Yt-1`[t] + 0.169440930713412`Yt-2`[t] + 0.153212945603548`Yt-3`[t] -0.0442066950446977`Yt-4`[t] -4.85820399237455M1[t] + 1.78511364782675M2[t] -6.45172660810019M3[t] -15.9451711714370M4[t] -14.9994820948072M5[t] -9.12649588972515M6[t] -17.5219597850958M7[t] -30.1652515478012M8[t] -7.32381920473443M9[t] -2.70606622771052M10[t] + 4.85219699734078M11[t] + e[t]

\begin{tabular}{lllllllll}
\hline
Multiple Linear Regression - Estimated Regression Equation \tabularnewline
Yt[t] =  +  64.6987662633607 -0.132646690016129`Yt-1`[t] +  0.169440930713412`Yt-2`[t] +  0.153212945603548`Yt-3`[t] -0.0442066950446977`Yt-4`[t] -4.85820399237455M1[t] +  1.78511364782675M2[t] -6.45172660810019M3[t] -15.9451711714370M4[t] -14.9994820948072M5[t] -9.12649588972515M6[t] -17.5219597850958M7[t] -30.1652515478012M8[t] -7.32381920473443M9[t] -2.70606622771052M10[t] +  4.85219699734078M11[t]  + e[t] \tabularnewline
\hline
\end{tabular}
%Source: https://freestatistics.org/blog/index.php?pk=102634&T=1

[TABLE]
[ROW][C]Multiple Linear Regression - Estimated Regression Equation[/C][/ROW]
[ROW][C]Yt[t] =  +  64.6987662633607 -0.132646690016129`Yt-1`[t] +  0.169440930713412`Yt-2`[t] +  0.153212945603548`Yt-3`[t] -0.0442066950446977`Yt-4`[t] -4.85820399237455M1[t] +  1.78511364782675M2[t] -6.45172660810019M3[t] -15.9451711714370M4[t] -14.9994820948072M5[t] -9.12649588972515M6[t] -17.5219597850958M7[t] -30.1652515478012M8[t] -7.32381920473443M9[t] -2.70606622771052M10[t] +  4.85219699734078M11[t]  + e[t][/C][/ROW]
[/TABLE]
Source: https://freestatistics.org/blog/index.php?pk=102634&T=1

Globally Unique Identifier (entire table): ba.freestatistics.org/blog/index.php?pk=102634&T=1

As an alternative you can also use a QR Code:  

The GUIDs for individual cells are displayed in the table below:

Multiple Linear Regression - Estimated Regression Equation
Yt[t] = + 64.6987662633607 -0.132646690016129`Yt-1`[t] + 0.169440930713412`Yt-2`[t] + 0.153212945603548`Yt-3`[t] -0.0442066950446977`Yt-4`[t] -4.85820399237455M1[t] + 1.78511364782675M2[t] -6.45172660810019M3[t] -15.9451711714370M4[t] -14.9994820948072M5[t] -9.12649588972515M6[t] -17.5219597850958M7[t] -30.1652515478012M8[t] -7.32381920473443M9[t] -2.70606622771052M10[t] + 4.85219699734078M11[t] + e[t]


Multiple Linear Regression - Ordinary Least Squares
VariableParameterS.D.T-STATH0: parameter = 02-tail p-value1-tail p-value
(Intercept)64.698766263360719.5105843.31610.0019490.000975
`Yt-1`-0.1326466900161290.158219-0.83840.4068030.203401
`Yt-2`0.1694409307134120.1569081.07990.2866670.143333
`Yt-3`0.1532129456035480.1527581.0030.3219010.16095
`Yt-4`-0.04420669504469770.153921-0.28720.7754390.387719
M1-4.858203992374554.656622-1.04330.3030790.151539
M21.785113647826754.8463240.36830.7145590.35728
M3-6.451726608100195.736756-1.12460.267450.133725
M4-15.94517117143705.814409-2.74240.0090810.00454
M5-14.99948209480726.200785-2.4190.0202060.010103
M6-9.126495889725156.976841-1.30810.1983030.099151
M7-17.52195978509585.414095-3.23640.0024340.001217
M8-30.16525154780125.390629-5.59592e-061e-06
M9-7.323819204734437.269757-1.00740.3197810.15989
M10-2.706066227710526.500739-0.41630.6794370.339719
M114.852196997340785.1280840.94620.3497270.174864

\begin{tabular}{lllllllll}
\hline
Multiple Linear Regression - Ordinary Least Squares \tabularnewline
Variable & Parameter & S.D. & T-STATH0: parameter = 0 & 2-tail p-value & 1-tail p-value \tabularnewline
(Intercept) & 64.6987662633607 & 19.510584 & 3.3161 & 0.001949 & 0.000975 \tabularnewline
`Yt-1` & -0.132646690016129 & 0.158219 & -0.8384 & 0.406803 & 0.203401 \tabularnewline
`Yt-2` & 0.169440930713412 & 0.156908 & 1.0799 & 0.286667 & 0.143333 \tabularnewline
`Yt-3` & 0.153212945603548 & 0.152758 & 1.003 & 0.321901 & 0.16095 \tabularnewline
`Yt-4` & -0.0442066950446977 & 0.153921 & -0.2872 & 0.775439 & 0.387719 \tabularnewline
M1 & -4.85820399237455 & 4.656622 & -1.0433 & 0.303079 & 0.151539 \tabularnewline
M2 & 1.78511364782675 & 4.846324 & 0.3683 & 0.714559 & 0.35728 \tabularnewline
M3 & -6.45172660810019 & 5.736756 & -1.1246 & 0.26745 & 0.133725 \tabularnewline
M4 & -15.9451711714370 & 5.814409 & -2.7424 & 0.009081 & 0.00454 \tabularnewline
M5 & -14.9994820948072 & 6.200785 & -2.419 & 0.020206 & 0.010103 \tabularnewline
M6 & -9.12649588972515 & 6.976841 & -1.3081 & 0.198303 & 0.099151 \tabularnewline
M7 & -17.5219597850958 & 5.414095 & -3.2364 & 0.002434 & 0.001217 \tabularnewline
M8 & -30.1652515478012 & 5.390629 & -5.5959 & 2e-06 & 1e-06 \tabularnewline
M9 & -7.32381920473443 & 7.269757 & -1.0074 & 0.319781 & 0.15989 \tabularnewline
M10 & -2.70606622771052 & 6.500739 & -0.4163 & 0.679437 & 0.339719 \tabularnewline
M11 & 4.85219699734078 & 5.128084 & 0.9462 & 0.349727 & 0.174864 \tabularnewline
\hline
\end{tabular}
%Source: https://freestatistics.org/blog/index.php?pk=102634&T=2

[TABLE]
[ROW][C]Multiple Linear Regression - Ordinary Least Squares[/C][/ROW]
[ROW][C]Variable[/C][C]Parameter[/C][C]S.D.[/C][C]T-STATH0: parameter = 0[/C][C]2-tail p-value[/C][C]1-tail p-value[/C][/ROW]
[ROW][C](Intercept)[/C][C]64.6987662633607[/C][C]19.510584[/C][C]3.3161[/C][C]0.001949[/C][C]0.000975[/C][/ROW]
[ROW][C]`Yt-1`[/C][C]-0.132646690016129[/C][C]0.158219[/C][C]-0.8384[/C][C]0.406803[/C][C]0.203401[/C][/ROW]
[ROW][C]`Yt-2`[/C][C]0.169440930713412[/C][C]0.156908[/C][C]1.0799[/C][C]0.286667[/C][C]0.143333[/C][/ROW]
[ROW][C]`Yt-3`[/C][C]0.153212945603548[/C][C]0.152758[/C][C]1.003[/C][C]0.321901[/C][C]0.16095[/C][/ROW]
[ROW][C]`Yt-4`[/C][C]-0.0442066950446977[/C][C]0.153921[/C][C]-0.2872[/C][C]0.775439[/C][C]0.387719[/C][/ROW]
[ROW][C]M1[/C][C]-4.85820399237455[/C][C]4.656622[/C][C]-1.0433[/C][C]0.303079[/C][C]0.151539[/C][/ROW]
[ROW][C]M2[/C][C]1.78511364782675[/C][C]4.846324[/C][C]0.3683[/C][C]0.714559[/C][C]0.35728[/C][/ROW]
[ROW][C]M3[/C][C]-6.45172660810019[/C][C]5.736756[/C][C]-1.1246[/C][C]0.26745[/C][C]0.133725[/C][/ROW]
[ROW][C]M4[/C][C]-15.9451711714370[/C][C]5.814409[/C][C]-2.7424[/C][C]0.009081[/C][C]0.00454[/C][/ROW]
[ROW][C]M5[/C][C]-14.9994820948072[/C][C]6.200785[/C][C]-2.419[/C][C]0.020206[/C][C]0.010103[/C][/ROW]
[ROW][C]M6[/C][C]-9.12649588972515[/C][C]6.976841[/C][C]-1.3081[/C][C]0.198303[/C][C]0.099151[/C][/ROW]
[ROW][C]M7[/C][C]-17.5219597850958[/C][C]5.414095[/C][C]-3.2364[/C][C]0.002434[/C][C]0.001217[/C][/ROW]
[ROW][C]M8[/C][C]-30.1652515478012[/C][C]5.390629[/C][C]-5.5959[/C][C]2e-06[/C][C]1e-06[/C][/ROW]
[ROW][C]M9[/C][C]-7.32381920473443[/C][C]7.269757[/C][C]-1.0074[/C][C]0.319781[/C][C]0.15989[/C][/ROW]
[ROW][C]M10[/C][C]-2.70606622771052[/C][C]6.500739[/C][C]-0.4163[/C][C]0.679437[/C][C]0.339719[/C][/ROW]
[ROW][C]M11[/C][C]4.85219699734078[/C][C]5.128084[/C][C]0.9462[/C][C]0.349727[/C][C]0.174864[/C][/ROW]
[/TABLE]
Source: https://freestatistics.org/blog/index.php?pk=102634&T=2

Globally Unique Identifier (entire table): ba.freestatistics.org/blog/index.php?pk=102634&T=2

As an alternative you can also use a QR Code:  

The GUIDs for individual cells are displayed in the table below:

Multiple Linear Regression - Ordinary Least Squares
VariableParameterS.D.T-STATH0: parameter = 02-tail p-value1-tail p-value
(Intercept)64.698766263360719.5105843.31610.0019490.000975
`Yt-1`-0.1326466900161290.158219-0.83840.4068030.203401
`Yt-2`0.1694409307134120.1569081.07990.2866670.143333
`Yt-3`0.1532129456035480.1527581.0030.3219010.16095
`Yt-4`-0.04420669504469770.153921-0.28720.7754390.387719
M1-4.858203992374554.656622-1.04330.3030790.151539
M21.785113647826754.8463240.36830.7145590.35728
M3-6.451726608100195.736756-1.12460.267450.133725
M4-15.94517117143705.814409-2.74240.0090810.00454
M5-14.99948209480726.200785-2.4190.0202060.010103
M6-9.126495889725156.976841-1.30810.1983030.099151
M7-17.52195978509585.414095-3.23640.0024340.001217
M8-30.16525154780125.390629-5.59592e-061e-06
M9-7.323819204734437.269757-1.00740.3197810.15989
M10-2.706066227710526.500739-0.41630.6794370.339719
M114.852196997340785.1280840.94620.3497270.174864


Multiple Linear Regression - Regression Statistics
Multiple R0.923623163761997
R-squared0.853079748637721
Adjusted R-squared0.797984654376866
F-TEST (value)15.4837696546758
F-TEST (DF numerator)15
F-TEST (DF denominator)40
p-value3.78119757726836e-12
Multiple Linear Regression - Residual Statistics
Residual Standard Deviation4.4772364972384
Sum Squared Residuals801.825866088144

\begin{tabular}{lllllllll}
\hline
Multiple Linear Regression - Regression Statistics \tabularnewline
Multiple R & 0.923623163761997 \tabularnewline
R-squared & 0.853079748637721 \tabularnewline
Adjusted R-squared & 0.797984654376866 \tabularnewline
F-TEST (value) & 15.4837696546758 \tabularnewline
F-TEST (DF numerator) & 15 \tabularnewline
F-TEST (DF denominator) & 40 \tabularnewline
p-value & 3.78119757726836e-12 \tabularnewline
Multiple Linear Regression - Residual Statistics \tabularnewline
Residual Standard Deviation & 4.4772364972384 \tabularnewline
Sum Squared Residuals & 801.825866088144 \tabularnewline
\hline
\end{tabular}
%Source: https://freestatistics.org/blog/index.php?pk=102634&T=3

[TABLE]
[ROW][C]Multiple Linear Regression - Regression Statistics[/C][/ROW]
[ROW][C]Multiple R[/C][C]0.923623163761997[/C][/ROW]
[ROW][C]R-squared[/C][C]0.853079748637721[/C][/ROW]
[ROW][C]Adjusted R-squared[/C][C]0.797984654376866[/C][/ROW]
[ROW][C]F-TEST (value)[/C][C]15.4837696546758[/C][/ROW]
[ROW][C]F-TEST (DF numerator)[/C][C]15[/C][/ROW]
[ROW][C]F-TEST (DF denominator)[/C][C]40[/C][/ROW]
[ROW][C]p-value[/C][C]3.78119757726836e-12[/C][/ROW]
[ROW][C]Multiple Linear Regression - Residual Statistics[/C][/ROW]
[ROW][C]Residual Standard Deviation[/C][C]4.4772364972384[/C][/ROW]
[ROW][C]Sum Squared Residuals[/C][C]801.825866088144[/C][/ROW]
[/TABLE]
Source: https://freestatistics.org/blog/index.php?pk=102634&T=3

Globally Unique Identifier (entire table): ba.freestatistics.org/blog/index.php?pk=102634&T=3

As an alternative you can also use a QR Code:  

The GUIDs for individual cells are displayed in the table below:

Multiple Linear Regression - Regression Statistics
Multiple R0.923623163761997
R-squared0.853079748637721
Adjusted R-squared0.797984654376866
F-TEST (value)15.4837696546758
F-TEST (DF numerator)15
F-TEST (DF denominator)40
p-value3.78119757726836e-12
Multiple Linear Regression - Residual Statistics
Residual Standard Deviation4.4772364972384
Sum Squared Residuals801.825866088144


Multiple Linear Regression - Actuals, Interpolation, and Residuals
Time or IndexActualsInterpolationForecastResidualsPrediction Error
168.84868.8576618037653-0.00966180376527437
277.05678.2161732926101-1.16017329261011
362.24667.6902780271788-5.44427802717881
460.77760.8675968583704-0.0905968583704075
564.51360.94687065861993.56612934138012
658.35363.4434478252682-5.09044782526823
756.51156.9277501940626-0.416750194062605
844.55444.12238070096780.431619299032193
971.41467.12881136457854.28518863542152
1065.71966.1477640349025-0.428764034902504
1180.99777.26209510024863.73490489975138
1269.82674.0622350439893-4.23623504398927
1365.38671.2146062111117-5.82860621111166
1475.58979.1465950291956-3.55759502919558
1565.5266.4171111604364-0.897111160436408
1659.00359.8016594468055-0.798659446805518
1763.96161.66521568090852.29578431909145
1859.71663.7825509926081-4.06655099260812
1957.5256.23688887673981.28311112326023
2042.88644.21333731034-1.32733731034004
2169.80567.75426328313752.05073671686247
2264.65666.1729032234765-1.51690322347653
2380.35376.83030432565113.52269567434893
2471.32173.7947609408698-2.47376094086976
2576.57770.81544266130845.76155733869157
2681.5877.86378269250553.71621730749454
2771.12767.77616076144973.35083923855034
2863.47861.72154713694661.75645286305339
2948.15262.4448586744621-14.2928586744621
3069.23667.2320333560022.00396664399806
3157.03852.73316170659814.30483829340185
3243.62143.2703822579480.350617742052007
3369.55169.7325483214792-0.181548321479206
3472.00965.83643819020866.17256180979145
3572.1475.9458343595914-3.80583435959141
3681.51976.05867936046685.46032063953321
3773.3169.2088966421394.10110335786108
3880.40678.4417082892981.96429171070208
3970.69769.3038596605551.39314033944504
4059.32860.6282949916434-1.30029499164338
4168.28162.88703411239485.39396588760526
4270.04163.84482536357966.19617463642044
4351.24455.4202327700799-4.17623277007994
4446.53847.442818295615-0.904818295615059
4561.44367.5973770308048-6.15437703080479
4662.25666.4828945514124-4.22689455141241
4773.11776.5687662145089-3.45176621450890
4874.15572.90532465467421.24967534532583
4965.19169.2153926816757-4.02439268167572
5077.88978.851740696391-0.962740696390921
5168.68867.09059039038021.59740960961984
5259.98359.54990156623410.433098433765919
5365.4762.43302087361473.03697912638529
5465.08964.13214246254220.956857537457838
5554.79555.7899664525195-0.994966452519525
5647.12345.67308143512911.44991856487089

\begin{tabular}{lllllllll}
\hline
Multiple Linear Regression - Actuals, Interpolation, and Residuals \tabularnewline
Time or Index & Actuals & InterpolationForecast & ResidualsPrediction Error \tabularnewline
1 & 68.848 & 68.8576618037653 & -0.00966180376527437 \tabularnewline
2 & 77.056 & 78.2161732926101 & -1.16017329261011 \tabularnewline
3 & 62.246 & 67.6902780271788 & -5.44427802717881 \tabularnewline
4 & 60.777 & 60.8675968583704 & -0.0905968583704075 \tabularnewline
5 & 64.513 & 60.9468706586199 & 3.56612934138012 \tabularnewline
6 & 58.353 & 63.4434478252682 & -5.09044782526823 \tabularnewline
7 & 56.511 & 56.9277501940626 & -0.416750194062605 \tabularnewline
8 & 44.554 & 44.1223807009678 & 0.431619299032193 \tabularnewline
9 & 71.414 & 67.1288113645785 & 4.28518863542152 \tabularnewline
10 & 65.719 & 66.1477640349025 & -0.428764034902504 \tabularnewline
11 & 80.997 & 77.2620951002486 & 3.73490489975138 \tabularnewline
12 & 69.826 & 74.0622350439893 & -4.23623504398927 \tabularnewline
13 & 65.386 & 71.2146062111117 & -5.82860621111166 \tabularnewline
14 & 75.589 & 79.1465950291956 & -3.55759502919558 \tabularnewline
15 & 65.52 & 66.4171111604364 & -0.897111160436408 \tabularnewline
16 & 59.003 & 59.8016594468055 & -0.798659446805518 \tabularnewline
17 & 63.961 & 61.6652156809085 & 2.29578431909145 \tabularnewline
18 & 59.716 & 63.7825509926081 & -4.06655099260812 \tabularnewline
19 & 57.52 & 56.2368888767398 & 1.28311112326023 \tabularnewline
20 & 42.886 & 44.21333731034 & -1.32733731034004 \tabularnewline
21 & 69.805 & 67.7542632831375 & 2.05073671686247 \tabularnewline
22 & 64.656 & 66.1729032234765 & -1.51690322347653 \tabularnewline
23 & 80.353 & 76.8303043256511 & 3.52269567434893 \tabularnewline
24 & 71.321 & 73.7947609408698 & -2.47376094086976 \tabularnewline
25 & 76.577 & 70.8154426613084 & 5.76155733869157 \tabularnewline
26 & 81.58 & 77.8637826925055 & 3.71621730749454 \tabularnewline
27 & 71.127 & 67.7761607614497 & 3.35083923855034 \tabularnewline
28 & 63.478 & 61.7215471369466 & 1.75645286305339 \tabularnewline
29 & 48.152 & 62.4448586744621 & -14.2928586744621 \tabularnewline
30 & 69.236 & 67.232033356002 & 2.00396664399806 \tabularnewline
31 & 57.038 & 52.7331617065981 & 4.30483829340185 \tabularnewline
32 & 43.621 & 43.270382257948 & 0.350617742052007 \tabularnewline
33 & 69.551 & 69.7325483214792 & -0.181548321479206 \tabularnewline
34 & 72.009 & 65.8364381902086 & 6.17256180979145 \tabularnewline
35 & 72.14 & 75.9458343595914 & -3.80583435959141 \tabularnewline
36 & 81.519 & 76.0586793604668 & 5.46032063953321 \tabularnewline
37 & 73.31 & 69.208896642139 & 4.10110335786108 \tabularnewline
38 & 80.406 & 78.441708289298 & 1.96429171070208 \tabularnewline
39 & 70.697 & 69.303859660555 & 1.39314033944504 \tabularnewline
40 & 59.328 & 60.6282949916434 & -1.30029499164338 \tabularnewline
41 & 68.281 & 62.8870341123948 & 5.39396588760526 \tabularnewline
42 & 70.041 & 63.8448253635796 & 6.19617463642044 \tabularnewline
43 & 51.244 & 55.4202327700799 & -4.17623277007994 \tabularnewline
44 & 46.538 & 47.442818295615 & -0.904818295615059 \tabularnewline
45 & 61.443 & 67.5973770308048 & -6.15437703080479 \tabularnewline
46 & 62.256 & 66.4828945514124 & -4.22689455141241 \tabularnewline
47 & 73.117 & 76.5687662145089 & -3.45176621450890 \tabularnewline
48 & 74.155 & 72.9053246546742 & 1.24967534532583 \tabularnewline
49 & 65.191 & 69.2153926816757 & -4.02439268167572 \tabularnewline
50 & 77.889 & 78.851740696391 & -0.962740696390921 \tabularnewline
51 & 68.688 & 67.0905903903802 & 1.59740960961984 \tabularnewline
52 & 59.983 & 59.5499015662341 & 0.433098433765919 \tabularnewline
53 & 65.47 & 62.4330208736147 & 3.03697912638529 \tabularnewline
54 & 65.089 & 64.1321424625422 & 0.956857537457838 \tabularnewline
55 & 54.795 & 55.7899664525195 & -0.994966452519525 \tabularnewline
56 & 47.123 & 45.6730814351291 & 1.44991856487089 \tabularnewline
\hline
\end{tabular}
%Source: https://freestatistics.org/blog/index.php?pk=102634&T=4

[TABLE]
[ROW][C]Multiple Linear Regression - Actuals, Interpolation, and Residuals[/C][/ROW]
[ROW][C]Time or Index[/C][C]Actuals[/C][C]InterpolationForecast[/C][C]ResidualsPrediction Error[/C][/ROW]
[ROW][C]1[/C][C]68.848[/C][C]68.8576618037653[/C][C]-0.00966180376527437[/C][/ROW]
[ROW][C]2[/C][C]77.056[/C][C]78.2161732926101[/C][C]-1.16017329261011[/C][/ROW]
[ROW][C]3[/C][C]62.246[/C][C]67.6902780271788[/C][C]-5.44427802717881[/C][/ROW]
[ROW][C]4[/C][C]60.777[/C][C]60.8675968583704[/C][C]-0.0905968583704075[/C][/ROW]
[ROW][C]5[/C][C]64.513[/C][C]60.9468706586199[/C][C]3.56612934138012[/C][/ROW]
[ROW][C]6[/C][C]58.353[/C][C]63.4434478252682[/C][C]-5.09044782526823[/C][/ROW]
[ROW][C]7[/C][C]56.511[/C][C]56.9277501940626[/C][C]-0.416750194062605[/C][/ROW]
[ROW][C]8[/C][C]44.554[/C][C]44.1223807009678[/C][C]0.431619299032193[/C][/ROW]
[ROW][C]9[/C][C]71.414[/C][C]67.1288113645785[/C][C]4.28518863542152[/C][/ROW]
[ROW][C]10[/C][C]65.719[/C][C]66.1477640349025[/C][C]-0.428764034902504[/C][/ROW]
[ROW][C]11[/C][C]80.997[/C][C]77.2620951002486[/C][C]3.73490489975138[/C][/ROW]
[ROW][C]12[/C][C]69.826[/C][C]74.0622350439893[/C][C]-4.23623504398927[/C][/ROW]
[ROW][C]13[/C][C]65.386[/C][C]71.2146062111117[/C][C]-5.82860621111166[/C][/ROW]
[ROW][C]14[/C][C]75.589[/C][C]79.1465950291956[/C][C]-3.55759502919558[/C][/ROW]
[ROW][C]15[/C][C]65.52[/C][C]66.4171111604364[/C][C]-0.897111160436408[/C][/ROW]
[ROW][C]16[/C][C]59.003[/C][C]59.8016594468055[/C][C]-0.798659446805518[/C][/ROW]
[ROW][C]17[/C][C]63.961[/C][C]61.6652156809085[/C][C]2.29578431909145[/C][/ROW]
[ROW][C]18[/C][C]59.716[/C][C]63.7825509926081[/C][C]-4.06655099260812[/C][/ROW]
[ROW][C]19[/C][C]57.52[/C][C]56.2368888767398[/C][C]1.28311112326023[/C][/ROW]
[ROW][C]20[/C][C]42.886[/C][C]44.21333731034[/C][C]-1.32733731034004[/C][/ROW]
[ROW][C]21[/C][C]69.805[/C][C]67.7542632831375[/C][C]2.05073671686247[/C][/ROW]
[ROW][C]22[/C][C]64.656[/C][C]66.1729032234765[/C][C]-1.51690322347653[/C][/ROW]
[ROW][C]23[/C][C]80.353[/C][C]76.8303043256511[/C][C]3.52269567434893[/C][/ROW]
[ROW][C]24[/C][C]71.321[/C][C]73.7947609408698[/C][C]-2.47376094086976[/C][/ROW]
[ROW][C]25[/C][C]76.577[/C][C]70.8154426613084[/C][C]5.76155733869157[/C][/ROW]
[ROW][C]26[/C][C]81.58[/C][C]77.8637826925055[/C][C]3.71621730749454[/C][/ROW]
[ROW][C]27[/C][C]71.127[/C][C]67.7761607614497[/C][C]3.35083923855034[/C][/ROW]
[ROW][C]28[/C][C]63.478[/C][C]61.7215471369466[/C][C]1.75645286305339[/C][/ROW]
[ROW][C]29[/C][C]48.152[/C][C]62.4448586744621[/C][C]-14.2928586744621[/C][/ROW]
[ROW][C]30[/C][C]69.236[/C][C]67.232033356002[/C][C]2.00396664399806[/C][/ROW]
[ROW][C]31[/C][C]57.038[/C][C]52.7331617065981[/C][C]4.30483829340185[/C][/ROW]
[ROW][C]32[/C][C]43.621[/C][C]43.270382257948[/C][C]0.350617742052007[/C][/ROW]
[ROW][C]33[/C][C]69.551[/C][C]69.7325483214792[/C][C]-0.181548321479206[/C][/ROW]
[ROW][C]34[/C][C]72.009[/C][C]65.8364381902086[/C][C]6.17256180979145[/C][/ROW]
[ROW][C]35[/C][C]72.14[/C][C]75.9458343595914[/C][C]-3.80583435959141[/C][/ROW]
[ROW][C]36[/C][C]81.519[/C][C]76.0586793604668[/C][C]5.46032063953321[/C][/ROW]
[ROW][C]37[/C][C]73.31[/C][C]69.208896642139[/C][C]4.10110335786108[/C][/ROW]
[ROW][C]38[/C][C]80.406[/C][C]78.441708289298[/C][C]1.96429171070208[/C][/ROW]
[ROW][C]39[/C][C]70.697[/C][C]69.303859660555[/C][C]1.39314033944504[/C][/ROW]
[ROW][C]40[/C][C]59.328[/C][C]60.6282949916434[/C][C]-1.30029499164338[/C][/ROW]
[ROW][C]41[/C][C]68.281[/C][C]62.8870341123948[/C][C]5.39396588760526[/C][/ROW]
[ROW][C]42[/C][C]70.041[/C][C]63.8448253635796[/C][C]6.19617463642044[/C][/ROW]
[ROW][C]43[/C][C]51.244[/C][C]55.4202327700799[/C][C]-4.17623277007994[/C][/ROW]
[ROW][C]44[/C][C]46.538[/C][C]47.442818295615[/C][C]-0.904818295615059[/C][/ROW]
[ROW][C]45[/C][C]61.443[/C][C]67.5973770308048[/C][C]-6.15437703080479[/C][/ROW]
[ROW][C]46[/C][C]62.256[/C][C]66.4828945514124[/C][C]-4.22689455141241[/C][/ROW]
[ROW][C]47[/C][C]73.117[/C][C]76.5687662145089[/C][C]-3.45176621450890[/C][/ROW]
[ROW][C]48[/C][C]74.155[/C][C]72.9053246546742[/C][C]1.24967534532583[/C][/ROW]
[ROW][C]49[/C][C]65.191[/C][C]69.2153926816757[/C][C]-4.02439268167572[/C][/ROW]
[ROW][C]50[/C][C]77.889[/C][C]78.851740696391[/C][C]-0.962740696390921[/C][/ROW]
[ROW][C]51[/C][C]68.688[/C][C]67.0905903903802[/C][C]1.59740960961984[/C][/ROW]
[ROW][C]52[/C][C]59.983[/C][C]59.5499015662341[/C][C]0.433098433765919[/C][/ROW]
[ROW][C]53[/C][C]65.47[/C][C]62.4330208736147[/C][C]3.03697912638529[/C][/ROW]
[ROW][C]54[/C][C]65.089[/C][C]64.1321424625422[/C][C]0.956857537457838[/C][/ROW]
[ROW][C]55[/C][C]54.795[/C][C]55.7899664525195[/C][C]-0.994966452519525[/C][/ROW]
[ROW][C]56[/C][C]47.123[/C][C]45.6730814351291[/C][C]1.44991856487089[/C][/ROW]
[/TABLE]
Source: https://freestatistics.org/blog/index.php?pk=102634&T=4

Globally Unique Identifier (entire table): ba.freestatistics.org/blog/index.php?pk=102634&T=4

As an alternative you can also use a QR Code:  

The GUIDs for individual cells are displayed in the table below:

Multiple Linear Regression - Actuals, Interpolation, and Residuals
Time or IndexActualsInterpolationForecastResidualsPrediction Error
168.84868.8576618037653-0.00966180376527437
277.05678.2161732926101-1.16017329261011
362.24667.6902780271788-5.44427802717881
460.77760.8675968583704-0.0905968583704075
564.51360.94687065861993.56612934138012
658.35363.4434478252682-5.09044782526823
756.51156.9277501940626-0.416750194062605
844.55444.12238070096780.431619299032193
971.41467.12881136457854.28518863542152
1065.71966.1477640349025-0.428764034902504
1180.99777.26209510024863.73490489975138
1269.82674.0622350439893-4.23623504398927
1365.38671.2146062111117-5.82860621111166
1475.58979.1465950291956-3.55759502919558
1565.5266.4171111604364-0.897111160436408
1659.00359.8016594468055-0.798659446805518
1763.96161.66521568090852.29578431909145
1859.71663.7825509926081-4.06655099260812
1957.5256.23688887673981.28311112326023
2042.88644.21333731034-1.32733731034004
2169.80567.75426328313752.05073671686247
2264.65666.1729032234765-1.51690322347653
2380.35376.83030432565113.52269567434893
2471.32173.7947609408698-2.47376094086976
2576.57770.81544266130845.76155733869157
2681.5877.86378269250553.71621730749454
2771.12767.77616076144973.35083923855034
2863.47861.72154713694661.75645286305339
2948.15262.4448586744621-14.2928586744621
3069.23667.2320333560022.00396664399806
3157.03852.73316170659814.30483829340185
3243.62143.2703822579480.350617742052007
3369.55169.7325483214792-0.181548321479206
3472.00965.83643819020866.17256180979145
3572.1475.9458343595914-3.80583435959141
3681.51976.05867936046685.46032063953321
3773.3169.2088966421394.10110335786108
3880.40678.4417082892981.96429171070208
3970.69769.3038596605551.39314033944504
4059.32860.6282949916434-1.30029499164338
4168.28162.88703411239485.39396588760526
4270.04163.84482536357966.19617463642044
4351.24455.4202327700799-4.17623277007994
4446.53847.442818295615-0.904818295615059
4561.44367.5973770308048-6.15437703080479
4662.25666.4828945514124-4.22689455141241
4773.11776.5687662145089-3.45176621450890
4874.15572.90532465467421.24967534532583
4965.19169.2153926816757-4.02439268167572
5077.88978.851740696391-0.962740696390921
5168.68867.09059039038021.59740960961984
5259.98359.54990156623410.433098433765919
5365.4762.43302087361473.03697912638529
5465.08964.13214246254220.956857537457838
5554.79555.7899664525195-0.994966452519525
5647.12345.67308143512911.44991856487089


Goldfeld-Quandt test for Heteroskedasticity
p-valuesAlternative Hypothesis
breakpoint indexgreater2-sidedless
190.02177549297021360.04355098594042720.978224507029786
200.005002049430314350.01000409886062870.994997950569686
210.001593765184450820.003187530368901630.99840623481555
220.000623386250671630.001246772501343260.999376613749328
230.0003042102740252560.0006084205480505120.999695789725975
249.5528673106095e-050.000191057346212190.999904471326894
250.05566593353743810.1113318670748760.944334066462562
260.02780233308099410.05560466616198830.972197666919006
270.01816131905673430.03632263811346860.981838680943266
280.008159171868084350.01631834373616870.991840828131916
290.882926852828830.234146294342340.11707314717117
300.9713584950121050.05728300997578980.0286415049878949
310.9491716773340190.1016566453319620.0508283226659811
320.9524055661011080.09518886779778450.0475944338988923
330.939891148820680.120217702358640.06010885117932
340.9234743715185910.1530512569628170.0765256284814086
350.8693217443760110.2613565112479770.130678255623989
360.88900590005440.2219881998911980.110994099945599
370.8128675675899520.3742648648200960.187132432410048

\begin{tabular}{lllllllll}
\hline
Goldfeld-Quandt test for Heteroskedasticity \tabularnewline
p-values & Alternative Hypothesis \tabularnewline
breakpoint index & greater & 2-sided & less \tabularnewline
19 & 0.0217754929702136 & 0.0435509859404272 & 0.978224507029786 \tabularnewline
20 & 0.00500204943031435 & 0.0100040988606287 & 0.994997950569686 \tabularnewline
21 & 0.00159376518445082 & 0.00318753036890163 & 0.99840623481555 \tabularnewline
22 & 0.00062338625067163 & 0.00124677250134326 & 0.999376613749328 \tabularnewline
23 & 0.000304210274025256 & 0.000608420548050512 & 0.999695789725975 \tabularnewline
24 & 9.5528673106095e-05 & 0.00019105734621219 & 0.999904471326894 \tabularnewline
25 & 0.0556659335374381 & 0.111331867074876 & 0.944334066462562 \tabularnewline
26 & 0.0278023330809941 & 0.0556046661619883 & 0.972197666919006 \tabularnewline
27 & 0.0181613190567343 & 0.0363226381134686 & 0.981838680943266 \tabularnewline
28 & 0.00815917186808435 & 0.0163183437361687 & 0.991840828131916 \tabularnewline
29 & 0.88292685282883 & 0.23414629434234 & 0.11707314717117 \tabularnewline
30 & 0.971358495012105 & 0.0572830099757898 & 0.0286415049878949 \tabularnewline
31 & 0.949171677334019 & 0.101656645331962 & 0.0508283226659811 \tabularnewline
32 & 0.952405566101108 & 0.0951888677977845 & 0.0475944338988923 \tabularnewline
33 & 0.93989114882068 & 0.12021770235864 & 0.06010885117932 \tabularnewline
34 & 0.923474371518591 & 0.153051256962817 & 0.0765256284814086 \tabularnewline
35 & 0.869321744376011 & 0.261356511247977 & 0.130678255623989 \tabularnewline
36 & 0.8890059000544 & 0.221988199891198 & 0.110994099945599 \tabularnewline
37 & 0.812867567589952 & 0.374264864820096 & 0.187132432410048 \tabularnewline
\hline
\end{tabular}
%Source: https://freestatistics.org/blog/index.php?pk=102634&T=5

[TABLE]
[ROW][C]Goldfeld-Quandt test for Heteroskedasticity[/C][/ROW]
[ROW][C]p-values[/C][C]Alternative Hypothesis[/C][/ROW]
[ROW][C]breakpoint index[/C][C]greater[/C][C]2-sided[/C][C]less[/C][/ROW]
[ROW][C]19[/C][C]0.0217754929702136[/C][C]0.0435509859404272[/C][C]0.978224507029786[/C][/ROW]
[ROW][C]20[/C][C]0.00500204943031435[/C][C]0.0100040988606287[/C][C]0.994997950569686[/C][/ROW]
[ROW][C]21[/C][C]0.00159376518445082[/C][C]0.00318753036890163[/C][C]0.99840623481555[/C][/ROW]
[ROW][C]22[/C][C]0.00062338625067163[/C][C]0.00124677250134326[/C][C]0.999376613749328[/C][/ROW]
[ROW][C]23[/C][C]0.000304210274025256[/C][C]0.000608420548050512[/C][C]0.999695789725975[/C][/ROW]
[ROW][C]24[/C][C]9.5528673106095e-05[/C][C]0.00019105734621219[/C][C]0.999904471326894[/C][/ROW]
[ROW][C]25[/C][C]0.0556659335374381[/C][C]0.111331867074876[/C][C]0.944334066462562[/C][/ROW]
[ROW][C]26[/C][C]0.0278023330809941[/C][C]0.0556046661619883[/C][C]0.972197666919006[/C][/ROW]
[ROW][C]27[/C][C]0.0181613190567343[/C][C]0.0363226381134686[/C][C]0.981838680943266[/C][/ROW]
[ROW][C]28[/C][C]0.00815917186808435[/C][C]0.0163183437361687[/C][C]0.991840828131916[/C][/ROW]
[ROW][C]29[/C][C]0.88292685282883[/C][C]0.23414629434234[/C][C]0.11707314717117[/C][/ROW]
[ROW][C]30[/C][C]0.971358495012105[/C][C]0.0572830099757898[/C][C]0.0286415049878949[/C][/ROW]
[ROW][C]31[/C][C]0.949171677334019[/C][C]0.101656645331962[/C][C]0.0508283226659811[/C][/ROW]
[ROW][C]32[/C][C]0.952405566101108[/C][C]0.0951888677977845[/C][C]0.0475944338988923[/C][/ROW]
[ROW][C]33[/C][C]0.93989114882068[/C][C]0.12021770235864[/C][C]0.06010885117932[/C][/ROW]
[ROW][C]34[/C][C]0.923474371518591[/C][C]0.153051256962817[/C][C]0.0765256284814086[/C][/ROW]
[ROW][C]35[/C][C]0.869321744376011[/C][C]0.261356511247977[/C][C]0.130678255623989[/C][/ROW]
[ROW][C]36[/C][C]0.8890059000544[/C][C]0.221988199891198[/C][C]0.110994099945599[/C][/ROW]
[ROW][C]37[/C][C]0.812867567589952[/C][C]0.374264864820096[/C][C]0.187132432410048[/C][/ROW]
[/TABLE]
Source: https://freestatistics.org/blog/index.php?pk=102634&T=5

Globally Unique Identifier (entire table): ba.freestatistics.org/blog/index.php?pk=102634&T=5

As an alternative you can also use a QR Code:  

The GUIDs for individual cells are displayed in the table below:

Goldfeld-Quandt test for Heteroskedasticity
p-valuesAlternative Hypothesis
breakpoint indexgreater2-sidedless
190.02177549297021360.04355098594042720.978224507029786
200.005002049430314350.01000409886062870.994997950569686
210.001593765184450820.003187530368901630.99840623481555
220.000623386250671630.001246772501343260.999376613749328
230.0003042102740252560.0006084205480505120.999695789725975
249.5528673106095e-050.000191057346212190.999904471326894
250.05566593353743810.1113318670748760.944334066462562
260.02780233308099410.05560466616198830.972197666919006
270.01816131905673430.03632263811346860.981838680943266
280.008159171868084350.01631834373616870.991840828131916
290.882926852828830.234146294342340.11707314717117
300.9713584950121050.05728300997578980.0286415049878949
310.9491716773340190.1016566453319620.0508283226659811
320.9524055661011080.09518886779778450.0475944338988923
330.939891148820680.120217702358640.06010885117932
340.9234743715185910.1530512569628170.0765256284814086
350.8693217443760110.2613565112479770.130678255623989
360.88900590005440.2219881998911980.110994099945599
370.8128675675899520.3742648648200960.187132432410048


Meta Analysis of Goldfeld-Quandt test for Heteroskedasticity
Description# significant tests% significant testsOK/NOK
1% type I error level40.210526315789474NOK
5% type I error level80.421052631578947NOK
10% type I error level110.578947368421053NOK

\begin{tabular}{lllllllll}
\hline
Meta Analysis of Goldfeld-Quandt test for Heteroskedasticity \tabularnewline
Description & # significant tests & % significant tests & OK/NOK \tabularnewline
1% type I error level & 4 & 0.210526315789474 & NOK \tabularnewline
5% type I error level & 8 & 0.421052631578947 & NOK \tabularnewline
10% type I error level & 11 & 0.578947368421053 & NOK \tabularnewline
\hline
\end{tabular}
%Source: https://freestatistics.org/blog/index.php?pk=102634&T=6

[TABLE]
[ROW][C]Meta Analysis of Goldfeld-Quandt test for Heteroskedasticity[/C][/ROW]
[ROW][C]Description[/C][C]# significant tests[/C][C]% significant tests[/C][C]OK/NOK[/C][/ROW]
[ROW][C]1% type I error level[/C][C]4[/C][C]0.210526315789474[/C][C]NOK[/C][/ROW]
[ROW][C]5% type I error level[/C][C]8[/C][C]0.421052631578947[/C][C]NOK[/C][/ROW]
[ROW][C]10% type I error level[/C][C]11[/C][C]0.578947368421053[/C][C]NOK[/C][/ROW]
[/TABLE]
Source: https://freestatistics.org/blog/index.php?pk=102634&T=6

Globally Unique Identifier (entire table): ba.freestatistics.org/blog/index.php?pk=102634&T=6

As an alternative you can also use a QR Code:  

The GUIDs for individual cells are displayed in the table below:

Meta Analysis of Goldfeld-Quandt test for Heteroskedasticity
Description# significant tests% significant testsOK/NOK
1% type I error level40.210526315789474NOK
5% type I error level80.421052631578947NOK
10% type I error level110.578947368421053NOK


Parameters (Session):
par1 = 1 ; par2 = Include Monthly Dummies ; par3 = No Linear Trend ;
Parameters (R input):
par1 = 1 ; par2 = Include Monthly Dummies ; par3 = No Linear Trend ;
R code (references can be found in the software module):
library(lattice)
library(lmtest)
n25 <- 25 #minimum number of obs. for Goldfeld-Quandt test
par1 <- as.numeric(par1)
x <- t(y)
k <- length(x[1,])
n <- length(x[,1])
x1 <- cbind(x[,par1], x[,1:k!=par1])
mycolnames <- c(colnames(x)[par1], colnames(x)[1:k!=par1])
colnames(x1) <- mycolnames #colnames(x)[par1]
x <- x1
if (par3 == 'First Differences'){
x2 <- array(0, dim=c(n-1,k), dimnames=list(1:(n-1), paste('(1-B)',colnames(x),sep='')))
for (i in 1:n-1) {
for (j in 1:k) {
x2[i,j] <- x[i+1,j] - x[i,j]
}
}
x <- x2
}
if (par2 == 'Include Monthly Dummies'){
x2 <- array(0, dim=c(n,11), dimnames=list(1:n, paste('M', seq(1:11), sep ='')))
for (i in 1:11){
x2[seq(i,n,12),i] <- 1
}
x <- cbind(x, x2)
}
if (par2 == 'Include Quarterly Dummies'){
x2 <- array(0, dim=c(n,3), dimnames=list(1:n, paste('Q', seq(1:3), sep ='')))
for (i in 1:3){
x2[seq(i,n,4),i] <- 1
}
x <- cbind(x, x2)
}
k <- length(x[1,])
if (par3 == 'Linear Trend'){
x <- cbind(x, c(1:n))
colnames(x)[k+1] <- 't'
}
x
k <- length(x[1,])
df <- as.data.frame(x)
(mylm <- lm(df))
(mysum <- summary(mylm))
if (n > n25) {
kp3 <- k + 3
nmkm3 <- n - k - 3
gqarr <- array(NA, dim=c(nmkm3-kp3+1,3))
numgqtests <- 0
numsignificant1 <- 0
numsignificant5 <- 0
numsignificant10 <- 0
for (mypoint in kp3:nmkm3) {
j <- 0
numgqtests <- numgqtests + 1
for (myalt in c('greater', 'two.sided', 'less')) {
j <- j + 1
gqarr[mypoint-kp3+1,j] <- gqtest(mylm, point=mypoint, alternative=myalt)$p.value
}
if (gqarr[mypoint-kp3+1,2] < 0.01) numsignificant1 <- numsignificant1 + 1
if (gqarr[mypoint-kp3+1,2] < 0.05) numsignificant5 <- numsignificant5 + 1
if (gqarr[mypoint-kp3+1,2] < 0.10) numsignificant10 <- numsignificant10 + 1
}
gqarr
}
bitmap(file='test0.png')
plot(x[,1], type='l', main='Actuals and Interpolation', ylab='value of Actuals and Interpolation (dots)', xlab='time or index')
points(x[,1]-mysum$resid)
grid()
dev.off()
bitmap(file='test1.png')
plot(mysum$resid, type='b', pch=19, main='Residuals', ylab='value of Residuals', xlab='time or index')
grid()
dev.off()
bitmap(file='test2.png')
hist(mysum$resid, main='Residual Histogram', xlab='values of Residuals')
grid()
dev.off()
bitmap(file='test3.png')
densityplot(~mysum$resid,col='black',main='Residual Density Plot', xlab='values of Residuals')
dev.off()
bitmap(file='test4.png')
qqnorm(mysum$resid, main='Residual Normal Q-Q Plot')
qqline(mysum$resid)
grid()
dev.off()
(myerror <- as.ts(mysum$resid))
bitmap(file='test5.png')
dum <- cbind(lag(myerror,k=1),myerror)
dum
dum1 <- dum[2:length(myerror),]
dum1
z <- as.data.frame(dum1)
z
plot(z,main=paste('Residual Lag plot, lowess, and regression line'), ylab='values of Residuals', xlab='lagged values of Residuals')
lines(lowess(z))
abline(lm(z))
grid()
dev.off()
bitmap(file='test6.png')
acf(mysum$resid, lag.max=length(mysum$resid)/2, main='Residual Autocorrelation Function')
grid()
dev.off()
bitmap(file='test7.png')
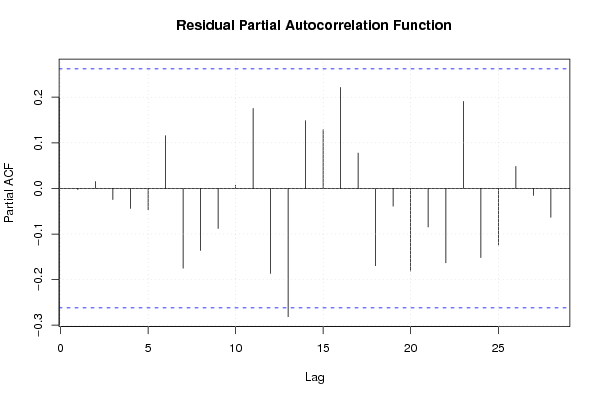
pacf(mysum$resid, lag.max=length(mysum$resid)/2, main='Residual Partial Autocorrelation Function')
grid()
dev.off()
bitmap(file='test8.png')
opar <- par(mfrow = c(2,2), oma = c(0, 0, 1.1, 0))
plot(mylm, las = 1, sub='Residual Diagnostics')
par(opar)
dev.off()
if (n > n25) {
bitmap(file='test9.png')
plot(kp3:nmkm3,gqarr[,2], main='Goldfeld-Quandt test',ylab='2-sided p-value',xlab='breakpoint')
grid()
dev.off()
}
load(file='createtable')
a<-table.start()
a<-table.row.start(a)
a<-table.element(a, 'Multiple Linear Regression - Estimated Regression Equation', 1, TRUE)
a<-table.row.end(a)
myeq <- colnames(x)[1]
myeq <- paste(myeq, '[t] = ', sep='')
for (i in 1:k){
if (mysum$coefficients[i,1] > 0) myeq <- paste(myeq, '+', '')
myeq <- paste(myeq, mysum$coefficients[i,1], sep=' ')
if (rownames(mysum$coefficients)[i] != '(Intercept)') {
myeq <- paste(myeq, rownames(mysum$coefficients)[i], sep='')
if (rownames(mysum$coefficients)[i] != 't') myeq <- paste(myeq, '[t]', sep='')
}
}
myeq <- paste(myeq, ' + e[t]')
a<-table.row.start(a)
a<-table.element(a, myeq)
a<-table.row.end(a)
a<-table.end(a)
table.save(a,file='mytable1.tab')
a<-table.start()
a<-table.row.start(a)
a<-table.element(a,hyperlink('ols1.htm','Multiple Linear Regression - Ordinary Least Squares',''), 6, TRUE)
a<-table.row.end(a)
a<-table.row.start(a)
a<-table.element(a,'Variable',header=TRUE)
a<-table.element(a,'Parameter',header=TRUE)
a<-table.element(a,'S.D.',header=TRUE)
a<-table.element(a,'T-STAT
H0: parameter = 0',header=TRUE)
a<-table.element(a,'2-tail p-value',header=TRUE)
a<-table.element(a,'1-tail p-value',header=TRUE)
a<-table.row.end(a)
for (i in 1:k){
a<-table.row.start(a)
a<-table.element(a,rownames(mysum$coefficients)[i],header=TRUE)
a<-table.element(a,mysum$coefficients[i,1])
a<-table.element(a, round(mysum$coefficients[i,2],6))
a<-table.element(a, round(mysum$coefficients[i,3],4))
a<-table.element(a, round(mysum$coefficients[i,4],6))
a<-table.element(a, round(mysum$coefficients[i,4]/2,6))
a<-table.row.end(a)
}
a<-table.end(a)
table.save(a,file='mytable2.tab')
a<-table.start()
a<-table.row.start(a)
a<-table.element(a, 'Multiple Linear Regression - Regression Statistics', 2, TRUE)
a<-table.row.end(a)
a<-table.row.start(a)
a<-table.element(a, 'Multiple R',1,TRUE)
a<-table.element(a, sqrt(mysum$r.squared))
a<-table.row.end(a)
a<-table.row.start(a)
a<-table.element(a, 'R-squared',1,TRUE)
a<-table.element(a, mysum$r.squared)
a<-table.row.end(a)
a<-table.row.start(a)
a<-table.element(a, 'Adjusted R-squared',1,TRUE)
a<-table.element(a, mysum$adj.r.squared)
a<-table.row.end(a)
a<-table.row.start(a)
a<-table.element(a, 'F-TEST (value)',1,TRUE)
a<-table.element(a, mysum$fstatistic[1])
a<-table.row.end(a)
a<-table.row.start(a)
a<-table.element(a, 'F-TEST (DF numerator)',1,TRUE)
a<-table.element(a, mysum$fstatistic[2])
a<-table.row.end(a)
a<-table.row.start(a)
a<-table.element(a, 'F-TEST (DF denominator)',1,TRUE)
a<-table.element(a, mysum$fstatistic[3])
a<-table.row.end(a)
a<-table.row.start(a)
a<-table.element(a, 'p-value',1,TRUE)
a<-table.element(a, 1-pf(mysum$fstatistic[1],mysum$fstatistic[2],mysum$fstatistic[3]))
a<-table.row.end(a)
a<-table.row.start(a)
a<-table.element(a, 'Multiple Linear Regression - Residual Statistics', 2, TRUE)
a<-table.row.end(a)
a<-table.row.start(a)
a<-table.element(a, 'Residual Standard Deviation',1,TRUE)
a<-table.element(a, mysum$sigma)
a<-table.row.end(a)
a<-table.row.start(a)
a<-table.element(a, 'Sum Squared Residuals',1,TRUE)
a<-table.element(a, sum(myerror*myerror))
a<-table.row.end(a)
a<-table.end(a)
table.save(a,file='mytable3.tab')
a<-table.start()
a<-table.row.start(a)
a<-table.element(a, 'Multiple Linear Regression - Actuals, Interpolation, and Residuals', 4, TRUE)
a<-table.row.end(a)
a<-table.row.start(a)
a<-table.element(a, 'Time or Index', 1, TRUE)
a<-table.element(a, 'Actuals', 1, TRUE)
a<-table.element(a, 'Interpolation
Forecast', 1, TRUE)
a<-table.element(a, 'Residuals
Prediction Error', 1, TRUE)
a<-table.row.end(a)
for (i in 1:n) {
a<-table.row.start(a)
a<-table.element(a,i, 1, TRUE)
a<-table.element(a,x[i])
a<-table.element(a,x[i]-mysum$resid[i])
a<-table.element(a,mysum$resid[i])
a<-table.row.end(a)
}
a<-table.end(a)
table.save(a,file='mytable4.tab')
if (n > n25) {
a<-table.start()
a<-table.row.start(a)
a<-table.element(a,'Goldfeld-Quandt test for Heteroskedasticity',4,TRUE)
a<-table.row.end(a)
a<-table.row.start(a)
a<-table.element(a,'p-values',header=TRUE)
a<-table.element(a,'Alternative Hypothesis',3,header=TRUE)
a<-table.row.end(a)
a<-table.row.start(a)
a<-table.element(a,'breakpoint index',header=TRUE)
a<-table.element(a,'greater',header=TRUE)
a<-table.element(a,'2-sided',header=TRUE)
a<-table.element(a,'less',header=TRUE)
a<-table.row.end(a)
for (mypoint in kp3:nmkm3) {
a<-table.row.start(a)
a<-table.element(a,mypoint,header=TRUE)
a<-table.element(a,gqarr[mypoint-kp3+1,1])
a<-table.element(a,gqarr[mypoint-kp3+1,2])
a<-table.element(a,gqarr[mypoint-kp3+1,3])
a<-table.row.end(a)
}
a<-table.end(a)
table.save(a,file='mytable5.tab')
a<-table.start()
a<-table.row.start(a)
a<-table.element(a,'Meta Analysis of Goldfeld-Quandt test for Heteroskedasticity',4,TRUE)
a<-table.row.end(a)
a<-table.row.start(a)
a<-table.element(a,'Description',header=TRUE)
a<-table.element(a,'# significant tests',header=TRUE)
a<-table.element(a,'% significant tests',header=TRUE)
a<-table.element(a,'OK/NOK',header=TRUE)
a<-table.row.end(a)
a<-table.row.start(a)
a<-table.element(a,'1% type I error level',header=TRUE)
a<-table.element(a,numsignificant1)
a<-table.element(a,numsignificant1/numgqtests)
if (numsignificant1/numgqtests < 0.01) dum <- 'OK' else dum <- 'NOK'
a<-table.element(a,dum)
a<-table.row.end(a)
a<-table.row.start(a)
a<-table.element(a,'5% type I error level',header=TRUE)
a<-table.element(a,numsignificant5)
a<-table.element(a,numsignificant5/numgqtests)
if (numsignificant5/numgqtests < 0.05) dum <- 'OK' else dum <- 'NOK'
a<-table.element(a,dum)
a<-table.row.end(a)
a<-table.row.start(a)
a<-table.element(a,'10% type I error level',header=TRUE)
a<-table.element(a,numsignificant10)
a<-table.element(a,numsignificant10/numgqtests)
if (numsignificant10/numgqtests < 0.1) dum <- 'OK' else dum <- 'NOK'
a<-table.element(a,dum)
a<-table.row.end(a)
a<-table.end(a)
table.save(a,file='mytable6.tab')
}