Free Statistics

of Irreproducible Research!

Author's title

Author*The author of this computation has been verified*
R Software Modulerwasp_multipleregression.wasp
Title produced by softwareMultiple Regression
Date of computationSun, 28 Nov 2010 20:12:54 +0000
Cite this page as followsStatistical Computations at FreeStatistics.org, Office for Research Development and Education, URL https://freestatistics.org/blog/index.php?v=date/2010/Nov/28/t1290975092g9gcgzv68v1rqju.htm/, Retrieved Thu, 02 May 2024 15:57:08 +0000
Statistical Computations at FreeStatistics.org, Office for Research Development and Education, URL https://freestatistics.org/blog/index.php?pk=102725, Retrieved Thu, 02 May 2024 15:57:08 +0000
QR Codes:

Original text written by user:
IsPrivate?No (this computation is public)
User-defined keywords
Estimated Impact144
Family? (F = Feedback message, R = changed R code, M = changed R Module, P = changed Parameters, D = changed Data)
-     [Multiple Regression] [HPC Retail Sales] [2008-03-08 13:40:54] [1c0f2c85e8a48e42648374b3bcceca26]
-  MPD  [Multiple Regression] [ws8 - Regressie a...] [2010-11-27 11:23:58] [4a7069087cf9e0eda253aeed7d8c30d6]
-    D      [Multiple Regression] [Paper - Regressie...] [2010-11-28 20:12:54] [cfd788255f1b1b5389e58d7f218c70bf] [Current]
-    D        [Multiple Regression] [Paper - Regressie...] [2010-11-29 17:52:52] [4a7069087cf9e0eda253aeed7d8c30d6]
Feedback Forum

Post a new message
Dataseries X:
376.974
377.632
378.205
370.861
369.167
371.551
382.842
381.903
384.502
392.058
384.359
388.884
386.586
387.495
385.705
378.67
377.367
376.911
389.827
387.82
387.267
380.575
372.402
376.74
377.795
376.126
370.804
367.98
367.866
366.121
379.421
378.519
372.423
355.072
344.693
342.892
344.178
337.606
327.103
323.953
316.532
306.307
327.225
329.573
313.761
307.836
300.074
304.198
306.122
300.414
292.133
290.616
280.244
285.179
305.486
305.957
293.886
289.441
288.776
299.149
306.532
309.914
313.468
314.901
309.16
316.15
336.544
339.196
326.738
320.838
318.62
331.533
335.378


Summary of computational transaction
Raw Inputview raw input (R code)
Raw Outputview raw output of R engine
Computing time7 seconds
R Server'George Udny Yule' @ 72.249.76.132

\begin{tabular}{lllllllll}
\hline
Summary of computational transaction \tabularnewline
Raw Input & view raw input (R code)  \tabularnewline
Raw Output & view raw output of R engine  \tabularnewline
Computing time & 7 seconds \tabularnewline
R Server & 'George Udny Yule' @ 72.249.76.132 \tabularnewline
\hline
\end{tabular}
%Source: https://freestatistics.org/blog/index.php?pk=102725&T=0

[TABLE]
[ROW][C]Summary of computational transaction[/C][/ROW]
[ROW][C]Raw Input[/C][C]view raw input (R code) [/C][/ROW]
[ROW][C]Raw Output[/C][C]view raw output of R engine [/C][/ROW]
[ROW][C]Computing time[/C][C]7 seconds[/C][/ROW]
[ROW][C]R Server[/C][C]'George Udny Yule' @ 72.249.76.132[/C][/ROW]
[/TABLE]
Source: https://freestatistics.org/blog/index.php?pk=102725&T=0

Globally Unique Identifier (entire table): ba.freestatistics.org/blog/index.php?pk=102725&T=0

As an alternative you can also use a QR Code:  

The GUIDs for individual cells are displayed in the table below:

Summary of computational transaction
Raw Inputview raw input (R code)
Raw Outputview raw output of R engine
Computing time7 seconds
R Server'George Udny Yule' @ 72.249.76.132


Multiple Linear Regression - Estimated Regression Equation
Maandelijksewerkloosheid[t] = + 399.088944444444 + 0.119125661375424M1[t] -6.30220105820107M2[t] -8.53696428571428M3[t] -10.5497275132276M4[t] -13.5971574074074M5[t] -11.8899206349206M6[t] + 6.02448280423279M7[t] + 7.68838624338623M8[t] + 1.68328968253969M9[t] -2.38280687830688M10[t] -7.13873677248678M11[t] -1.39340343915344t + e[t]

\begin{tabular}{lllllllll}
\hline
Multiple Linear Regression - Estimated Regression Equation \tabularnewline
Maandelijksewerkloosheid[t] =  +  399.088944444444 +  0.119125661375424M1[t] -6.30220105820107M2[t] -8.53696428571428M3[t] -10.5497275132276M4[t] -13.5971574074074M5[t] -11.8899206349206M6[t] +  6.02448280423279M7[t] +  7.68838624338623M8[t] +  1.68328968253969M9[t] -2.38280687830688M10[t] -7.13873677248678M11[t] -1.39340343915344t  + e[t] \tabularnewline
\hline
\end{tabular}
%Source: https://freestatistics.org/blog/index.php?pk=102725&T=1

[TABLE]
[ROW][C]Multiple Linear Regression - Estimated Regression Equation[/C][/ROW]
[ROW][C]Maandelijksewerkloosheid[t] =  +  399.088944444444 +  0.119125661375424M1[t] -6.30220105820107M2[t] -8.53696428571428M3[t] -10.5497275132276M4[t] -13.5971574074074M5[t] -11.8899206349206M6[t] +  6.02448280423279M7[t] +  7.68838624338623M8[t] +  1.68328968253969M9[t] -2.38280687830688M10[t] -7.13873677248678M11[t] -1.39340343915344t  + e[t][/C][/ROW]
[/TABLE]
Source: https://freestatistics.org/blog/index.php?pk=102725&T=1

Globally Unique Identifier (entire table): ba.freestatistics.org/blog/index.php?pk=102725&T=1

As an alternative you can also use a QR Code:  

The GUIDs for individual cells are displayed in the table below:

Multiple Linear Regression - Estimated Regression Equation
Maandelijksewerkloosheid[t] = + 399.088944444444 + 0.119125661375424M1[t] -6.30220105820107M2[t] -8.53696428571428M3[t] -10.5497275132276M4[t] -13.5971574074074M5[t] -11.8899206349206M6[t] + 6.02448280423279M7[t] + 7.68838624338623M8[t] + 1.68328968253969M9[t] -2.38280687830688M10[t] -7.13873677248678M11[t] -1.39340343915344t + e[t]


Multiple Linear Regression - Ordinary Least Squares
VariableParameterS.D.T-STATH0: parameter = 02-tail p-value1-tail p-value
(Intercept)399.0889444444449.56963441.703700
M10.11912566137542411.3083770.01050.991630.495815
M2-6.3022010582010711.775598-0.53520.5944950.297248
M3-8.5369642857142811.765123-0.72560.4708950.235447
M4-10.549727513227611.755742-0.89740.3730870.186543
M5-13.597157407407411.747459-1.15750.2516730.125837
M6-11.889920634920611.740275-1.01270.3152480.157624
M76.0244828042327911.7341940.51340.6095480.304774
M87.6883862433862311.7292150.65550.5146580.257329
M91.6832896825396911.7253420.14360.8863290.443165
M10-2.3828068783068811.722574-0.20330.8396150.419807
M11-7.1387367724867811.720913-0.60910.5447840.272392
t-1.393403439153440.113924-12.23100

\begin{tabular}{lllllllll}
\hline
Multiple Linear Regression - Ordinary Least Squares \tabularnewline
Variable & Parameter & S.D. & T-STATH0: parameter = 0 & 2-tail p-value & 1-tail p-value \tabularnewline
(Intercept) & 399.088944444444 & 9.569634 & 41.7037 & 0 & 0 \tabularnewline
M1 & 0.119125661375424 & 11.308377 & 0.0105 & 0.99163 & 0.495815 \tabularnewline
M2 & -6.30220105820107 & 11.775598 & -0.5352 & 0.594495 & 0.297248 \tabularnewline
M3 & -8.53696428571428 & 11.765123 & -0.7256 & 0.470895 & 0.235447 \tabularnewline
M4 & -10.5497275132276 & 11.755742 & -0.8974 & 0.373087 & 0.186543 \tabularnewline
M5 & -13.5971574074074 & 11.747459 & -1.1575 & 0.251673 & 0.125837 \tabularnewline
M6 & -11.8899206349206 & 11.740275 & -1.0127 & 0.315248 & 0.157624 \tabularnewline
M7 & 6.02448280423279 & 11.734194 & 0.5134 & 0.609548 & 0.304774 \tabularnewline
M8 & 7.68838624338623 & 11.729215 & 0.6555 & 0.514658 & 0.257329 \tabularnewline
M9 & 1.68328968253969 & 11.725342 & 0.1436 & 0.886329 & 0.443165 \tabularnewline
M10 & -2.38280687830688 & 11.722574 & -0.2033 & 0.839615 & 0.419807 \tabularnewline
M11 & -7.13873677248678 & 11.720913 & -0.6091 & 0.544784 & 0.272392 \tabularnewline
t & -1.39340343915344 & 0.113924 & -12.231 & 0 & 0 \tabularnewline
\hline
\end{tabular}
%Source: https://freestatistics.org/blog/index.php?pk=102725&T=2

[TABLE]
[ROW][C]Multiple Linear Regression - Ordinary Least Squares[/C][/ROW]
[ROW][C]Variable[/C][C]Parameter[/C][C]S.D.[/C][C]T-STATH0: parameter = 0[/C][C]2-tail p-value[/C][C]1-tail p-value[/C][/ROW]
[ROW][C](Intercept)[/C][C]399.088944444444[/C][C]9.569634[/C][C]41.7037[/C][C]0[/C][C]0[/C][/ROW]
[ROW][C]M1[/C][C]0.119125661375424[/C][C]11.308377[/C][C]0.0105[/C][C]0.99163[/C][C]0.495815[/C][/ROW]
[ROW][C]M2[/C][C]-6.30220105820107[/C][C]11.775598[/C][C]-0.5352[/C][C]0.594495[/C][C]0.297248[/C][/ROW]
[ROW][C]M3[/C][C]-8.53696428571428[/C][C]11.765123[/C][C]-0.7256[/C][C]0.470895[/C][C]0.235447[/C][/ROW]
[ROW][C]M4[/C][C]-10.5497275132276[/C][C]11.755742[/C][C]-0.8974[/C][C]0.373087[/C][C]0.186543[/C][/ROW]
[ROW][C]M5[/C][C]-13.5971574074074[/C][C]11.747459[/C][C]-1.1575[/C][C]0.251673[/C][C]0.125837[/C][/ROW]
[ROW][C]M6[/C][C]-11.8899206349206[/C][C]11.740275[/C][C]-1.0127[/C][C]0.315248[/C][C]0.157624[/C][/ROW]
[ROW][C]M7[/C][C]6.02448280423279[/C][C]11.734194[/C][C]0.5134[/C][C]0.609548[/C][C]0.304774[/C][/ROW]
[ROW][C]M8[/C][C]7.68838624338623[/C][C]11.729215[/C][C]0.6555[/C][C]0.514658[/C][C]0.257329[/C][/ROW]
[ROW][C]M9[/C][C]1.68328968253969[/C][C]11.725342[/C][C]0.1436[/C][C]0.886329[/C][C]0.443165[/C][/ROW]
[ROW][C]M10[/C][C]-2.38280687830688[/C][C]11.722574[/C][C]-0.2033[/C][C]0.839615[/C][C]0.419807[/C][/ROW]
[ROW][C]M11[/C][C]-7.13873677248678[/C][C]11.720913[/C][C]-0.6091[/C][C]0.544784[/C][C]0.272392[/C][/ROW]
[ROW][C]t[/C][C]-1.39340343915344[/C][C]0.113924[/C][C]-12.231[/C][C]0[/C][C]0[/C][/ROW]
[/TABLE]
Source: https://freestatistics.org/blog/index.php?pk=102725&T=2

Globally Unique Identifier (entire table): ba.freestatistics.org/blog/index.php?pk=102725&T=2

As an alternative you can also use a QR Code:  

The GUIDs for individual cells are displayed in the table below:

Multiple Linear Regression - Ordinary Least Squares
VariableParameterS.D.T-STATH0: parameter = 02-tail p-value1-tail p-value
(Intercept)399.0889444444449.56963441.703700
M10.11912566137542411.3083770.01050.991630.495815
M2-6.3022010582010711.775598-0.53520.5944950.297248
M3-8.5369642857142811.765123-0.72560.4708950.235447
M4-10.549727513227611.755742-0.89740.3730870.186543
M5-13.597157407407411.747459-1.15750.2516730.125837
M6-11.889920634920611.740275-1.01270.3152480.157624
M76.0244828042327911.7341940.51340.6095480.304774
M87.6883862433862311.7292150.65550.5146580.257329
M91.6832896825396911.7253420.14360.8863290.443165
M10-2.3828068783068811.722574-0.20330.8396150.419807
M11-7.1387367724867811.720913-0.60910.5447840.272392
t-1.393403439153440.113924-12.23100


Multiple Linear Regression - Regression Statistics
Multiple R0.849858359743331
R-squared0.722259231625625
Adjusted R-squared0.66671107795075
F-TEST (value)13.0023985289058
F-TEST (DF numerator)12
F-TEST (DF denominator)60
p-value1.38489220091742e-12
Multiple Linear Regression - Residual Statistics
Residual Standard Deviation20.300258574558
Sum Squared Residuals24726.029891635

\begin{tabular}{lllllllll}
\hline
Multiple Linear Regression - Regression Statistics \tabularnewline
Multiple R & 0.849858359743331 \tabularnewline
R-squared & 0.722259231625625 \tabularnewline
Adjusted R-squared & 0.66671107795075 \tabularnewline
F-TEST (value) & 13.0023985289058 \tabularnewline
F-TEST (DF numerator) & 12 \tabularnewline
F-TEST (DF denominator) & 60 \tabularnewline
p-value & 1.38489220091742e-12 \tabularnewline
Multiple Linear Regression - Residual Statistics \tabularnewline
Residual Standard Deviation & 20.300258574558 \tabularnewline
Sum Squared Residuals & 24726.029891635 \tabularnewline
\hline
\end{tabular}
%Source: https://freestatistics.org/blog/index.php?pk=102725&T=3

[TABLE]
[ROW][C]Multiple Linear Regression - Regression Statistics[/C][/ROW]
[ROW][C]Multiple R[/C][C]0.849858359743331[/C][/ROW]
[ROW][C]R-squared[/C][C]0.722259231625625[/C][/ROW]
[ROW][C]Adjusted R-squared[/C][C]0.66671107795075[/C][/ROW]
[ROW][C]F-TEST (value)[/C][C]13.0023985289058[/C][/ROW]
[ROW][C]F-TEST (DF numerator)[/C][C]12[/C][/ROW]
[ROW][C]F-TEST (DF denominator)[/C][C]60[/C][/ROW]
[ROW][C]p-value[/C][C]1.38489220091742e-12[/C][/ROW]
[ROW][C]Multiple Linear Regression - Residual Statistics[/C][/ROW]
[ROW][C]Residual Standard Deviation[/C][C]20.300258574558[/C][/ROW]
[ROW][C]Sum Squared Residuals[/C][C]24726.029891635[/C][/ROW]
[/TABLE]
Source: https://freestatistics.org/blog/index.php?pk=102725&T=3

Globally Unique Identifier (entire table): ba.freestatistics.org/blog/index.php?pk=102725&T=3

As an alternative you can also use a QR Code:  

The GUIDs for individual cells are displayed in the table below:

Multiple Linear Regression - Regression Statistics
Multiple R0.849858359743331
R-squared0.722259231625625
Adjusted R-squared0.66671107795075
F-TEST (value)13.0023985289058
F-TEST (DF numerator)12
F-TEST (DF denominator)60
p-value1.38489220091742e-12
Multiple Linear Regression - Residual Statistics
Residual Standard Deviation20.300258574558
Sum Squared Residuals24726.029891635


Multiple Linear Regression - Actuals, Interpolation, and Residuals
Time or IndexActualsInterpolationForecastResidualsPrediction Error
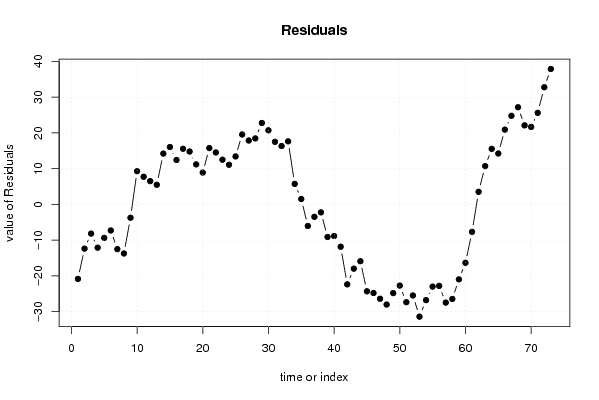
1376.974397.814666666668-20.8406666666681
2377.632389.999936507936-12.3679365079365
3378.205386.37176984127-8.16676984126978
4370.861382.965603174603-12.1046031746032
5369.167378.52476984127-9.35776984126975
6371.551378.838603174603-7.28760317460311
7382.842395.359603174603-12.5176031746031
8381.903395.630103174603-13.7271031746031
9384.502388.231603174603-3.72960317460311
10392.058382.7721031746039.28589682539687
11384.359376.622769841277.7362301587302
12388.884382.3681031746036.5158968253969
13386.586381.0938253968255.49217460317498
14387.495373.27909523809514.2159047619048
15385.705369.65092857142916.0540714285714
16378.67366.24476190476212.4252380952382
17377.367361.80392857142915.5630714285715
18376.911362.11776190476214.7932380952381
19389.827378.63876190476211.1882380952381
20387.82378.9092619047628.91073809523811
21387.267371.51076190476215.7562380952381
22380.575366.05126190476214.5237380952381
23372.402359.90192857142912.5000714285714
24376.74365.64726190476211.0927380952381
25377.795364.37298412698413.4220158730161
26376.126356.55825396825419.5677460317460
27370.804352.93008730158717.8739126984127
28367.98349.52392063492118.4560793650794
29367.866345.08308730158722.7829126984127
30366.121345.39692063492120.7240793650794
31379.421361.91792063492117.5030793650794
32378.519362.18842063492116.3305793650794
33372.423354.78992063492117.6330793650794
34355.072349.3304206349215.74157936507937
35344.693343.1810873015871.51191269841268
36342.892348.926420634921-6.03442063492065
37344.178347.652142857143-3.47414285714263
38337.606339.837412698413-2.23141269841271
39327.103336.209246031746-9.10624603174603
40323.953332.803079365079-8.8500793650794
41316.532328.362246031746-11.8302460317461
42306.307328.676079365079-22.3690793650794
43327.225345.197079365079-17.9720793650794
44329.573345.467579365079-15.8945793650794
45313.761338.069079365079-24.3080793650794
46307.836332.609579365079-24.7735793650794
47300.074326.460246031746-26.386246031746
48304.198332.205579365079-28.0075793650794
49306.122330.931301587301-24.8093015873014
50300.414323.116571428571-22.7025714285715
51292.133319.488404761905-27.3554047619048
52290.616316.082238095238-25.4662380952381
53280.244311.641404761905-31.3974047619048
54285.179311.955238095238-26.7762380952381
55305.486328.476238095238-22.9902380952381
56305.957328.746738095238-22.7897380952381
57293.886321.348238095238-27.4622380952381
58289.441315.888738095238-26.4477380952381
59288.776309.739404761905-20.9634047619048
60299.149315.484738095238-16.3357380952381
61306.532314.21046031746-7.67846031746016
62309.914306.395730158733.51826984126978
63313.468302.76756349206410.7004365079365
64314.901299.36139682539715.5396031746031
65309.16294.92056349206414.2394365079365
66316.15295.23439682539720.9156031746031
67336.544311.75539682539724.7886031746031
68339.196312.02589682539727.1701031746031
69326.738304.62739682539722.1106031746031
70320.838299.16789682539721.6701031746031
71318.62293.01856349206425.6014365079365
72331.533298.76389682539732.7691031746031
73335.378297.48961904761937.8883809523811

\begin{tabular}{lllllllll}
\hline
Multiple Linear Regression - Actuals, Interpolation, and Residuals \tabularnewline
Time or Index & Actuals & InterpolationForecast & ResidualsPrediction Error \tabularnewline
1 & 376.974 & 397.814666666668 & -20.8406666666681 \tabularnewline
2 & 377.632 & 389.999936507936 & -12.3679365079365 \tabularnewline
3 & 378.205 & 386.37176984127 & -8.16676984126978 \tabularnewline
4 & 370.861 & 382.965603174603 & -12.1046031746032 \tabularnewline
5 & 369.167 & 378.52476984127 & -9.35776984126975 \tabularnewline
6 & 371.551 & 378.838603174603 & -7.28760317460311 \tabularnewline
7 & 382.842 & 395.359603174603 & -12.5176031746031 \tabularnewline
8 & 381.903 & 395.630103174603 & -13.7271031746031 \tabularnewline
9 & 384.502 & 388.231603174603 & -3.72960317460311 \tabularnewline
10 & 392.058 & 382.772103174603 & 9.28589682539687 \tabularnewline
11 & 384.359 & 376.62276984127 & 7.7362301587302 \tabularnewline
12 & 388.884 & 382.368103174603 & 6.5158968253969 \tabularnewline
13 & 386.586 & 381.093825396825 & 5.49217460317498 \tabularnewline
14 & 387.495 & 373.279095238095 & 14.2159047619048 \tabularnewline
15 & 385.705 & 369.650928571429 & 16.0540714285714 \tabularnewline
16 & 378.67 & 366.244761904762 & 12.4252380952382 \tabularnewline
17 & 377.367 & 361.803928571429 & 15.5630714285715 \tabularnewline
18 & 376.911 & 362.117761904762 & 14.7932380952381 \tabularnewline
19 & 389.827 & 378.638761904762 & 11.1882380952381 \tabularnewline
20 & 387.82 & 378.909261904762 & 8.91073809523811 \tabularnewline
21 & 387.267 & 371.510761904762 & 15.7562380952381 \tabularnewline
22 & 380.575 & 366.051261904762 & 14.5237380952381 \tabularnewline
23 & 372.402 & 359.901928571429 & 12.5000714285714 \tabularnewline
24 & 376.74 & 365.647261904762 & 11.0927380952381 \tabularnewline
25 & 377.795 & 364.372984126984 & 13.4220158730161 \tabularnewline
26 & 376.126 & 356.558253968254 & 19.5677460317460 \tabularnewline
27 & 370.804 & 352.930087301587 & 17.8739126984127 \tabularnewline
28 & 367.98 & 349.523920634921 & 18.4560793650794 \tabularnewline
29 & 367.866 & 345.083087301587 & 22.7829126984127 \tabularnewline
30 & 366.121 & 345.396920634921 & 20.7240793650794 \tabularnewline
31 & 379.421 & 361.917920634921 & 17.5030793650794 \tabularnewline
32 & 378.519 & 362.188420634921 & 16.3305793650794 \tabularnewline
33 & 372.423 & 354.789920634921 & 17.6330793650794 \tabularnewline
34 & 355.072 & 349.330420634921 & 5.74157936507937 \tabularnewline
35 & 344.693 & 343.181087301587 & 1.51191269841268 \tabularnewline
36 & 342.892 & 348.926420634921 & -6.03442063492065 \tabularnewline
37 & 344.178 & 347.652142857143 & -3.47414285714263 \tabularnewline
38 & 337.606 & 339.837412698413 & -2.23141269841271 \tabularnewline
39 & 327.103 & 336.209246031746 & -9.10624603174603 \tabularnewline
40 & 323.953 & 332.803079365079 & -8.8500793650794 \tabularnewline
41 & 316.532 & 328.362246031746 & -11.8302460317461 \tabularnewline
42 & 306.307 & 328.676079365079 & -22.3690793650794 \tabularnewline
43 & 327.225 & 345.197079365079 & -17.9720793650794 \tabularnewline
44 & 329.573 & 345.467579365079 & -15.8945793650794 \tabularnewline
45 & 313.761 & 338.069079365079 & -24.3080793650794 \tabularnewline
46 & 307.836 & 332.609579365079 & -24.7735793650794 \tabularnewline
47 & 300.074 & 326.460246031746 & -26.386246031746 \tabularnewline
48 & 304.198 & 332.205579365079 & -28.0075793650794 \tabularnewline
49 & 306.122 & 330.931301587301 & -24.8093015873014 \tabularnewline
50 & 300.414 & 323.116571428571 & -22.7025714285715 \tabularnewline
51 & 292.133 & 319.488404761905 & -27.3554047619048 \tabularnewline
52 & 290.616 & 316.082238095238 & -25.4662380952381 \tabularnewline
53 & 280.244 & 311.641404761905 & -31.3974047619048 \tabularnewline
54 & 285.179 & 311.955238095238 & -26.7762380952381 \tabularnewline
55 & 305.486 & 328.476238095238 & -22.9902380952381 \tabularnewline
56 & 305.957 & 328.746738095238 & -22.7897380952381 \tabularnewline
57 & 293.886 & 321.348238095238 & -27.4622380952381 \tabularnewline
58 & 289.441 & 315.888738095238 & -26.4477380952381 \tabularnewline
59 & 288.776 & 309.739404761905 & -20.9634047619048 \tabularnewline
60 & 299.149 & 315.484738095238 & -16.3357380952381 \tabularnewline
61 & 306.532 & 314.21046031746 & -7.67846031746016 \tabularnewline
62 & 309.914 & 306.39573015873 & 3.51826984126978 \tabularnewline
63 & 313.468 & 302.767563492064 & 10.7004365079365 \tabularnewline
64 & 314.901 & 299.361396825397 & 15.5396031746031 \tabularnewline
65 & 309.16 & 294.920563492064 & 14.2394365079365 \tabularnewline
66 & 316.15 & 295.234396825397 & 20.9156031746031 \tabularnewline
67 & 336.544 & 311.755396825397 & 24.7886031746031 \tabularnewline
68 & 339.196 & 312.025896825397 & 27.1701031746031 \tabularnewline
69 & 326.738 & 304.627396825397 & 22.1106031746031 \tabularnewline
70 & 320.838 & 299.167896825397 & 21.6701031746031 \tabularnewline
71 & 318.62 & 293.018563492064 & 25.6014365079365 \tabularnewline
72 & 331.533 & 298.763896825397 & 32.7691031746031 \tabularnewline
73 & 335.378 & 297.489619047619 & 37.8883809523811 \tabularnewline
\hline
\end{tabular}
%Source: https://freestatistics.org/blog/index.php?pk=102725&T=4

[TABLE]
[ROW][C]Multiple Linear Regression - Actuals, Interpolation, and Residuals[/C][/ROW]
[ROW][C]Time or Index[/C][C]Actuals[/C][C]InterpolationForecast[/C][C]ResidualsPrediction Error[/C][/ROW]
[ROW][C]1[/C][C]376.974[/C][C]397.814666666668[/C][C]-20.8406666666681[/C][/ROW]
[ROW][C]2[/C][C]377.632[/C][C]389.999936507936[/C][C]-12.3679365079365[/C][/ROW]
[ROW][C]3[/C][C]378.205[/C][C]386.37176984127[/C][C]-8.16676984126978[/C][/ROW]
[ROW][C]4[/C][C]370.861[/C][C]382.965603174603[/C][C]-12.1046031746032[/C][/ROW]
[ROW][C]5[/C][C]369.167[/C][C]378.52476984127[/C][C]-9.35776984126975[/C][/ROW]
[ROW][C]6[/C][C]371.551[/C][C]378.838603174603[/C][C]-7.28760317460311[/C][/ROW]
[ROW][C]7[/C][C]382.842[/C][C]395.359603174603[/C][C]-12.5176031746031[/C][/ROW]
[ROW][C]8[/C][C]381.903[/C][C]395.630103174603[/C][C]-13.7271031746031[/C][/ROW]
[ROW][C]9[/C][C]384.502[/C][C]388.231603174603[/C][C]-3.72960317460311[/C][/ROW]
[ROW][C]10[/C][C]392.058[/C][C]382.772103174603[/C][C]9.28589682539687[/C][/ROW]
[ROW][C]11[/C][C]384.359[/C][C]376.62276984127[/C][C]7.7362301587302[/C][/ROW]
[ROW][C]12[/C][C]388.884[/C][C]382.368103174603[/C][C]6.5158968253969[/C][/ROW]
[ROW][C]13[/C][C]386.586[/C][C]381.093825396825[/C][C]5.49217460317498[/C][/ROW]
[ROW][C]14[/C][C]387.495[/C][C]373.279095238095[/C][C]14.2159047619048[/C][/ROW]
[ROW][C]15[/C][C]385.705[/C][C]369.650928571429[/C][C]16.0540714285714[/C][/ROW]
[ROW][C]16[/C][C]378.67[/C][C]366.244761904762[/C][C]12.4252380952382[/C][/ROW]
[ROW][C]17[/C][C]377.367[/C][C]361.803928571429[/C][C]15.5630714285715[/C][/ROW]
[ROW][C]18[/C][C]376.911[/C][C]362.117761904762[/C][C]14.7932380952381[/C][/ROW]
[ROW][C]19[/C][C]389.827[/C][C]378.638761904762[/C][C]11.1882380952381[/C][/ROW]
[ROW][C]20[/C][C]387.82[/C][C]378.909261904762[/C][C]8.91073809523811[/C][/ROW]
[ROW][C]21[/C][C]387.267[/C][C]371.510761904762[/C][C]15.7562380952381[/C][/ROW]
[ROW][C]22[/C][C]380.575[/C][C]366.051261904762[/C][C]14.5237380952381[/C][/ROW]
[ROW][C]23[/C][C]372.402[/C][C]359.901928571429[/C][C]12.5000714285714[/C][/ROW]
[ROW][C]24[/C][C]376.74[/C][C]365.647261904762[/C][C]11.0927380952381[/C][/ROW]
[ROW][C]25[/C][C]377.795[/C][C]364.372984126984[/C][C]13.4220158730161[/C][/ROW]
[ROW][C]26[/C][C]376.126[/C][C]356.558253968254[/C][C]19.5677460317460[/C][/ROW]
[ROW][C]27[/C][C]370.804[/C][C]352.930087301587[/C][C]17.8739126984127[/C][/ROW]
[ROW][C]28[/C][C]367.98[/C][C]349.523920634921[/C][C]18.4560793650794[/C][/ROW]
[ROW][C]29[/C][C]367.866[/C][C]345.083087301587[/C][C]22.7829126984127[/C][/ROW]
[ROW][C]30[/C][C]366.121[/C][C]345.396920634921[/C][C]20.7240793650794[/C][/ROW]
[ROW][C]31[/C][C]379.421[/C][C]361.917920634921[/C][C]17.5030793650794[/C][/ROW]
[ROW][C]32[/C][C]378.519[/C][C]362.188420634921[/C][C]16.3305793650794[/C][/ROW]
[ROW][C]33[/C][C]372.423[/C][C]354.789920634921[/C][C]17.6330793650794[/C][/ROW]
[ROW][C]34[/C][C]355.072[/C][C]349.330420634921[/C][C]5.74157936507937[/C][/ROW]
[ROW][C]35[/C][C]344.693[/C][C]343.181087301587[/C][C]1.51191269841268[/C][/ROW]
[ROW][C]36[/C][C]342.892[/C][C]348.926420634921[/C][C]-6.03442063492065[/C][/ROW]
[ROW][C]37[/C][C]344.178[/C][C]347.652142857143[/C][C]-3.47414285714263[/C][/ROW]
[ROW][C]38[/C][C]337.606[/C][C]339.837412698413[/C][C]-2.23141269841271[/C][/ROW]
[ROW][C]39[/C][C]327.103[/C][C]336.209246031746[/C][C]-9.10624603174603[/C][/ROW]
[ROW][C]40[/C][C]323.953[/C][C]332.803079365079[/C][C]-8.8500793650794[/C][/ROW]
[ROW][C]41[/C][C]316.532[/C][C]328.362246031746[/C][C]-11.8302460317461[/C][/ROW]
[ROW][C]42[/C][C]306.307[/C][C]328.676079365079[/C][C]-22.3690793650794[/C][/ROW]
[ROW][C]43[/C][C]327.225[/C][C]345.197079365079[/C][C]-17.9720793650794[/C][/ROW]
[ROW][C]44[/C][C]329.573[/C][C]345.467579365079[/C][C]-15.8945793650794[/C][/ROW]
[ROW][C]45[/C][C]313.761[/C][C]338.069079365079[/C][C]-24.3080793650794[/C][/ROW]
[ROW][C]46[/C][C]307.836[/C][C]332.609579365079[/C][C]-24.7735793650794[/C][/ROW]
[ROW][C]47[/C][C]300.074[/C][C]326.460246031746[/C][C]-26.386246031746[/C][/ROW]
[ROW][C]48[/C][C]304.198[/C][C]332.205579365079[/C][C]-28.0075793650794[/C][/ROW]
[ROW][C]49[/C][C]306.122[/C][C]330.931301587301[/C][C]-24.8093015873014[/C][/ROW]
[ROW][C]50[/C][C]300.414[/C][C]323.116571428571[/C][C]-22.7025714285715[/C][/ROW]
[ROW][C]51[/C][C]292.133[/C][C]319.488404761905[/C][C]-27.3554047619048[/C][/ROW]
[ROW][C]52[/C][C]290.616[/C][C]316.082238095238[/C][C]-25.4662380952381[/C][/ROW]
[ROW][C]53[/C][C]280.244[/C][C]311.641404761905[/C][C]-31.3974047619048[/C][/ROW]
[ROW][C]54[/C][C]285.179[/C][C]311.955238095238[/C][C]-26.7762380952381[/C][/ROW]
[ROW][C]55[/C][C]305.486[/C][C]328.476238095238[/C][C]-22.9902380952381[/C][/ROW]
[ROW][C]56[/C][C]305.957[/C][C]328.746738095238[/C][C]-22.7897380952381[/C][/ROW]
[ROW][C]57[/C][C]293.886[/C][C]321.348238095238[/C][C]-27.4622380952381[/C][/ROW]
[ROW][C]58[/C][C]289.441[/C][C]315.888738095238[/C][C]-26.4477380952381[/C][/ROW]
[ROW][C]59[/C][C]288.776[/C][C]309.739404761905[/C][C]-20.9634047619048[/C][/ROW]
[ROW][C]60[/C][C]299.149[/C][C]315.484738095238[/C][C]-16.3357380952381[/C][/ROW]
[ROW][C]61[/C][C]306.532[/C][C]314.21046031746[/C][C]-7.67846031746016[/C][/ROW]
[ROW][C]62[/C][C]309.914[/C][C]306.39573015873[/C][C]3.51826984126978[/C][/ROW]
[ROW][C]63[/C][C]313.468[/C][C]302.767563492064[/C][C]10.7004365079365[/C][/ROW]
[ROW][C]64[/C][C]314.901[/C][C]299.361396825397[/C][C]15.5396031746031[/C][/ROW]
[ROW][C]65[/C][C]309.16[/C][C]294.920563492064[/C][C]14.2394365079365[/C][/ROW]
[ROW][C]66[/C][C]316.15[/C][C]295.234396825397[/C][C]20.9156031746031[/C][/ROW]
[ROW][C]67[/C][C]336.544[/C][C]311.755396825397[/C][C]24.7886031746031[/C][/ROW]
[ROW][C]68[/C][C]339.196[/C][C]312.025896825397[/C][C]27.1701031746031[/C][/ROW]
[ROW][C]69[/C][C]326.738[/C][C]304.627396825397[/C][C]22.1106031746031[/C][/ROW]
[ROW][C]70[/C][C]320.838[/C][C]299.167896825397[/C][C]21.6701031746031[/C][/ROW]
[ROW][C]71[/C][C]318.62[/C][C]293.018563492064[/C][C]25.6014365079365[/C][/ROW]
[ROW][C]72[/C][C]331.533[/C][C]298.763896825397[/C][C]32.7691031746031[/C][/ROW]
[ROW][C]73[/C][C]335.378[/C][C]297.489619047619[/C][C]37.8883809523811[/C][/ROW]
[/TABLE]
Source: https://freestatistics.org/blog/index.php?pk=102725&T=4

Globally Unique Identifier (entire table): ba.freestatistics.org/blog/index.php?pk=102725&T=4

As an alternative you can also use a QR Code:  

The GUIDs for individual cells are displayed in the table below:

Multiple Linear Regression - Actuals, Interpolation, and Residuals
Time or IndexActualsInterpolationForecastResidualsPrediction Error
1376.974397.814666666668-20.8406666666681
2377.632389.999936507936-12.3679365079365
3378.205386.37176984127-8.16676984126978
4370.861382.965603174603-12.1046031746032
5369.167378.52476984127-9.35776984126975
6371.551378.838603174603-7.28760317460311
7382.842395.359603174603-12.5176031746031
8381.903395.630103174603-13.7271031746031
9384.502388.231603174603-3.72960317460311
10392.058382.7721031746039.28589682539687
11384.359376.622769841277.7362301587302
12388.884382.3681031746036.5158968253969
13386.586381.0938253968255.49217460317498
14387.495373.27909523809514.2159047619048
15385.705369.65092857142916.0540714285714
16378.67366.24476190476212.4252380952382
17377.367361.80392857142915.5630714285715
18376.911362.11776190476214.7932380952381
19389.827378.63876190476211.1882380952381
20387.82378.9092619047628.91073809523811
21387.267371.51076190476215.7562380952381
22380.575366.05126190476214.5237380952381
23372.402359.90192857142912.5000714285714
24376.74365.64726190476211.0927380952381
25377.795364.37298412698413.4220158730161
26376.126356.55825396825419.5677460317460
27370.804352.93008730158717.8739126984127
28367.98349.52392063492118.4560793650794
29367.866345.08308730158722.7829126984127
30366.121345.39692063492120.7240793650794
31379.421361.91792063492117.5030793650794
32378.519362.18842063492116.3305793650794
33372.423354.78992063492117.6330793650794
34355.072349.3304206349215.74157936507937
35344.693343.1810873015871.51191269841268
36342.892348.926420634921-6.03442063492065
37344.178347.652142857143-3.47414285714263
38337.606339.837412698413-2.23141269841271
39327.103336.209246031746-9.10624603174603
40323.953332.803079365079-8.8500793650794
41316.532328.362246031746-11.8302460317461
42306.307328.676079365079-22.3690793650794
43327.225345.197079365079-17.9720793650794
44329.573345.467579365079-15.8945793650794
45313.761338.069079365079-24.3080793650794
46307.836332.609579365079-24.7735793650794
47300.074326.460246031746-26.386246031746
48304.198332.205579365079-28.0075793650794
49306.122330.931301587301-24.8093015873014
50300.414323.116571428571-22.7025714285715
51292.133319.488404761905-27.3554047619048
52290.616316.082238095238-25.4662380952381
53280.244311.641404761905-31.3974047619048
54285.179311.955238095238-26.7762380952381
55305.486328.476238095238-22.9902380952381
56305.957328.746738095238-22.7897380952381
57293.886321.348238095238-27.4622380952381
58289.441315.888738095238-26.4477380952381
59288.776309.739404761905-20.9634047619048
60299.149315.484738095238-16.3357380952381
61306.532314.21046031746-7.67846031746016
62309.914306.395730158733.51826984126978
63313.468302.76756349206410.7004365079365
64314.901299.36139682539715.5396031746031
65309.16294.92056349206414.2394365079365
66316.15295.23439682539720.9156031746031
67336.544311.75539682539724.7886031746031
68339.196312.02589682539727.1701031746031
69326.738304.62739682539722.1106031746031
70320.838299.16789682539721.6701031746031
71318.62293.01856349206425.6014365079365
72331.533298.76389682539732.7691031746031
73335.378297.48961904761937.8883809523811


Goldfeld-Quandt test for Heteroskedasticity
p-valuesAlternative Hypothesis
breakpoint indexgreater2-sidedless
167.82716348216002e-050.0001565432696432000.999921728365178
172.64739844036383e-065.29479688072766e-060.99999735260156
181.07224366610251e-062.14448733220503e-060.999998927756334
195.8294858276586e-081.16589716553172e-070.999999941705142
205.17741895871307e-091.03548379174261e-080.999999994822581
215.37506316177653e-091.07501263235531e-080.999999994624937
225.83555960711212e-061.16711192142242e-050.999994164440393
231.61781803239488e-053.23563606478976e-050.999983821819676
241.88342885362498e-053.76685770724996e-050.999981165711464
257.03128401072435e-061.40625680214487e-050.99999296871599
263.45055823378163e-066.90111646756326e-060.999996549441766
272.82393443080600e-065.64786886161200e-060.99999717606557
281.20425709091510e-062.40851418183021e-060.99999879574291
295.96895638894492e-071.19379127778898e-060.99999940310436
303.91125133886769e-077.82250267773539e-070.999999608874866
312.17072092921056e-074.34144185842111e-070.999999782927907
321.26816881117096e-072.53633762234192e-070.99999987318312
333.08561776688866e-076.17123553377732e-070.999999691438223
342.11861642261216e-054.23723284522431e-050.999978813835774
350.0003584876669407730.0007169753338815470.99964151233306
360.00356908135870.00713816271740.9964309186413
370.009762727376306280.01952545475261260.990237272623694
380.03683390220969820.07366780441939640.963166097790302
390.1158732596435850.2317465192871710.884126740356415
400.2189340048188340.4378680096376680.781065995181166
410.4344384894959910.8688769789919810.565561510504009
420.604349319254930.791301361490140.39565068074507
430.6938890564198620.6122218871602750.306110943580138
440.784203405443650.4315931891126980.215796594556349
450.8919267359249970.2161465281500060.108073264075003
460.9654618572970170.06907628540596660.0345381427029833
470.9914148076321880.0171703847356230.0085851923678115
480.998151737510650.003696524978700320.00184826248935016
490.9999499163977460.0001001672045089315.00836022544653e-05
500.9999996745829586.50834084964026e-073.25417042482013e-07
510.999999942491321.15017359525667e-075.75086797628333e-08
520.9999999934709881.30580241381422e-086.52901206907111e-09
530.9999999675706536.48586940590337e-083.24293470295168e-08
540.9999994977070421.00458591651325e-065.02292958256626e-07
550.9999924650226081.50699547848338e-057.5349773924169e-06
560.9999412295585630.0001175408828741455.87704414370725e-05
570.9995532959005130.0008934081989737310.000446704099486866

\begin{tabular}{lllllllll}
\hline
Goldfeld-Quandt test for Heteroskedasticity \tabularnewline
p-values & Alternative Hypothesis \tabularnewline
breakpoint index & greater & 2-sided & less \tabularnewline
16 & 7.82716348216002e-05 & 0.000156543269643200 & 0.999921728365178 \tabularnewline
17 & 2.64739844036383e-06 & 5.29479688072766e-06 & 0.99999735260156 \tabularnewline
18 & 1.07224366610251e-06 & 2.14448733220503e-06 & 0.999998927756334 \tabularnewline
19 & 5.8294858276586e-08 & 1.16589716553172e-07 & 0.999999941705142 \tabularnewline
20 & 5.17741895871307e-09 & 1.03548379174261e-08 & 0.999999994822581 \tabularnewline
21 & 5.37506316177653e-09 & 1.07501263235531e-08 & 0.999999994624937 \tabularnewline
22 & 5.83555960711212e-06 & 1.16711192142242e-05 & 0.999994164440393 \tabularnewline
23 & 1.61781803239488e-05 & 3.23563606478976e-05 & 0.999983821819676 \tabularnewline
24 & 1.88342885362498e-05 & 3.76685770724996e-05 & 0.999981165711464 \tabularnewline
25 & 7.03128401072435e-06 & 1.40625680214487e-05 & 0.99999296871599 \tabularnewline
26 & 3.45055823378163e-06 & 6.90111646756326e-06 & 0.999996549441766 \tabularnewline
27 & 2.82393443080600e-06 & 5.64786886161200e-06 & 0.99999717606557 \tabularnewline
28 & 1.20425709091510e-06 & 2.40851418183021e-06 & 0.99999879574291 \tabularnewline
29 & 5.96895638894492e-07 & 1.19379127778898e-06 & 0.99999940310436 \tabularnewline
30 & 3.91125133886769e-07 & 7.82250267773539e-07 & 0.999999608874866 \tabularnewline
31 & 2.17072092921056e-07 & 4.34144185842111e-07 & 0.999999782927907 \tabularnewline
32 & 1.26816881117096e-07 & 2.53633762234192e-07 & 0.99999987318312 \tabularnewline
33 & 3.08561776688866e-07 & 6.17123553377732e-07 & 0.999999691438223 \tabularnewline
34 & 2.11861642261216e-05 & 4.23723284522431e-05 & 0.999978813835774 \tabularnewline
35 & 0.000358487666940773 & 0.000716975333881547 & 0.99964151233306 \tabularnewline
36 & 0.0035690813587 & 0.0071381627174 & 0.9964309186413 \tabularnewline
37 & 0.00976272737630628 & 0.0195254547526126 & 0.990237272623694 \tabularnewline
38 & 0.0368339022096982 & 0.0736678044193964 & 0.963166097790302 \tabularnewline
39 & 0.115873259643585 & 0.231746519287171 & 0.884126740356415 \tabularnewline
40 & 0.218934004818834 & 0.437868009637668 & 0.781065995181166 \tabularnewline
41 & 0.434438489495991 & 0.868876978991981 & 0.565561510504009 \tabularnewline
42 & 0.60434931925493 & 0.79130136149014 & 0.39565068074507 \tabularnewline
43 & 0.693889056419862 & 0.612221887160275 & 0.306110943580138 \tabularnewline
44 & 0.78420340544365 & 0.431593189112698 & 0.215796594556349 \tabularnewline
45 & 0.891926735924997 & 0.216146528150006 & 0.108073264075003 \tabularnewline
46 & 0.965461857297017 & 0.0690762854059666 & 0.0345381427029833 \tabularnewline
47 & 0.991414807632188 & 0.017170384735623 & 0.0085851923678115 \tabularnewline
48 & 0.99815173751065 & 0.00369652497870032 & 0.00184826248935016 \tabularnewline
49 & 0.999949916397746 & 0.000100167204508931 & 5.00836022544653e-05 \tabularnewline
50 & 0.999999674582958 & 6.50834084964026e-07 & 3.25417042482013e-07 \tabularnewline
51 & 0.99999994249132 & 1.15017359525667e-07 & 5.75086797628333e-08 \tabularnewline
52 & 0.999999993470988 & 1.30580241381422e-08 & 6.52901206907111e-09 \tabularnewline
53 & 0.999999967570653 & 6.48586940590337e-08 & 3.24293470295168e-08 \tabularnewline
54 & 0.999999497707042 & 1.00458591651325e-06 & 5.02292958256626e-07 \tabularnewline
55 & 0.999992465022608 & 1.50699547848338e-05 & 7.5349773924169e-06 \tabularnewline
56 & 0.999941229558563 & 0.000117540882874145 & 5.87704414370725e-05 \tabularnewline
57 & 0.999553295900513 & 0.000893408198973731 & 0.000446704099486866 \tabularnewline
\hline
\end{tabular}
%Source: https://freestatistics.org/blog/index.php?pk=102725&T=5

[TABLE]
[ROW][C]Goldfeld-Quandt test for Heteroskedasticity[/C][/ROW]
[ROW][C]p-values[/C][C]Alternative Hypothesis[/C][/ROW]
[ROW][C]breakpoint index[/C][C]greater[/C][C]2-sided[/C][C]less[/C][/ROW]
[ROW][C]16[/C][C]7.82716348216002e-05[/C][C]0.000156543269643200[/C][C]0.999921728365178[/C][/ROW]
[ROW][C]17[/C][C]2.64739844036383e-06[/C][C]5.29479688072766e-06[/C][C]0.99999735260156[/C][/ROW]
[ROW][C]18[/C][C]1.07224366610251e-06[/C][C]2.14448733220503e-06[/C][C]0.999998927756334[/C][/ROW]
[ROW][C]19[/C][C]5.8294858276586e-08[/C][C]1.16589716553172e-07[/C][C]0.999999941705142[/C][/ROW]
[ROW][C]20[/C][C]5.17741895871307e-09[/C][C]1.03548379174261e-08[/C][C]0.999999994822581[/C][/ROW]
[ROW][C]21[/C][C]5.37506316177653e-09[/C][C]1.07501263235531e-08[/C][C]0.999999994624937[/C][/ROW]
[ROW][C]22[/C][C]5.83555960711212e-06[/C][C]1.16711192142242e-05[/C][C]0.999994164440393[/C][/ROW]
[ROW][C]23[/C][C]1.61781803239488e-05[/C][C]3.23563606478976e-05[/C][C]0.999983821819676[/C][/ROW]
[ROW][C]24[/C][C]1.88342885362498e-05[/C][C]3.76685770724996e-05[/C][C]0.999981165711464[/C][/ROW]
[ROW][C]25[/C][C]7.03128401072435e-06[/C][C]1.40625680214487e-05[/C][C]0.99999296871599[/C][/ROW]
[ROW][C]26[/C][C]3.45055823378163e-06[/C][C]6.90111646756326e-06[/C][C]0.999996549441766[/C][/ROW]
[ROW][C]27[/C][C]2.82393443080600e-06[/C][C]5.64786886161200e-06[/C][C]0.99999717606557[/C][/ROW]
[ROW][C]28[/C][C]1.20425709091510e-06[/C][C]2.40851418183021e-06[/C][C]0.99999879574291[/C][/ROW]
[ROW][C]29[/C][C]5.96895638894492e-07[/C][C]1.19379127778898e-06[/C][C]0.99999940310436[/C][/ROW]
[ROW][C]30[/C][C]3.91125133886769e-07[/C][C]7.82250267773539e-07[/C][C]0.999999608874866[/C][/ROW]
[ROW][C]31[/C][C]2.17072092921056e-07[/C][C]4.34144185842111e-07[/C][C]0.999999782927907[/C][/ROW]
[ROW][C]32[/C][C]1.26816881117096e-07[/C][C]2.53633762234192e-07[/C][C]0.99999987318312[/C][/ROW]
[ROW][C]33[/C][C]3.08561776688866e-07[/C][C]6.17123553377732e-07[/C][C]0.999999691438223[/C][/ROW]
[ROW][C]34[/C][C]2.11861642261216e-05[/C][C]4.23723284522431e-05[/C][C]0.999978813835774[/C][/ROW]
[ROW][C]35[/C][C]0.000358487666940773[/C][C]0.000716975333881547[/C][C]0.99964151233306[/C][/ROW]
[ROW][C]36[/C][C]0.0035690813587[/C][C]0.0071381627174[/C][C]0.9964309186413[/C][/ROW]
[ROW][C]37[/C][C]0.00976272737630628[/C][C]0.0195254547526126[/C][C]0.990237272623694[/C][/ROW]
[ROW][C]38[/C][C]0.0368339022096982[/C][C]0.0736678044193964[/C][C]0.963166097790302[/C][/ROW]
[ROW][C]39[/C][C]0.115873259643585[/C][C]0.231746519287171[/C][C]0.884126740356415[/C][/ROW]
[ROW][C]40[/C][C]0.218934004818834[/C][C]0.437868009637668[/C][C]0.781065995181166[/C][/ROW]
[ROW][C]41[/C][C]0.434438489495991[/C][C]0.868876978991981[/C][C]0.565561510504009[/C][/ROW]
[ROW][C]42[/C][C]0.60434931925493[/C][C]0.79130136149014[/C][C]0.39565068074507[/C][/ROW]
[ROW][C]43[/C][C]0.693889056419862[/C][C]0.612221887160275[/C][C]0.306110943580138[/C][/ROW]
[ROW][C]44[/C][C]0.78420340544365[/C][C]0.431593189112698[/C][C]0.215796594556349[/C][/ROW]
[ROW][C]45[/C][C]0.891926735924997[/C][C]0.216146528150006[/C][C]0.108073264075003[/C][/ROW]
[ROW][C]46[/C][C]0.965461857297017[/C][C]0.0690762854059666[/C][C]0.0345381427029833[/C][/ROW]
[ROW][C]47[/C][C]0.991414807632188[/C][C]0.017170384735623[/C][C]0.0085851923678115[/C][/ROW]
[ROW][C]48[/C][C]0.99815173751065[/C][C]0.00369652497870032[/C][C]0.00184826248935016[/C][/ROW]
[ROW][C]49[/C][C]0.999949916397746[/C][C]0.000100167204508931[/C][C]5.00836022544653e-05[/C][/ROW]
[ROW][C]50[/C][C]0.999999674582958[/C][C]6.50834084964026e-07[/C][C]3.25417042482013e-07[/C][/ROW]
[ROW][C]51[/C][C]0.99999994249132[/C][C]1.15017359525667e-07[/C][C]5.75086797628333e-08[/C][/ROW]
[ROW][C]52[/C][C]0.999999993470988[/C][C]1.30580241381422e-08[/C][C]6.52901206907111e-09[/C][/ROW]
[ROW][C]53[/C][C]0.999999967570653[/C][C]6.48586940590337e-08[/C][C]3.24293470295168e-08[/C][/ROW]
[ROW][C]54[/C][C]0.999999497707042[/C][C]1.00458591651325e-06[/C][C]5.02292958256626e-07[/C][/ROW]
[ROW][C]55[/C][C]0.999992465022608[/C][C]1.50699547848338e-05[/C][C]7.5349773924169e-06[/C][/ROW]
[ROW][C]56[/C][C]0.999941229558563[/C][C]0.000117540882874145[/C][C]5.87704414370725e-05[/C][/ROW]
[ROW][C]57[/C][C]0.999553295900513[/C][C]0.000893408198973731[/C][C]0.000446704099486866[/C][/ROW]
[/TABLE]
Source: https://freestatistics.org/blog/index.php?pk=102725&T=5

Globally Unique Identifier (entire table): ba.freestatistics.org/blog/index.php?pk=102725&T=5

As an alternative you can also use a QR Code:  

The GUIDs for individual cells are displayed in the table below:

Goldfeld-Quandt test for Heteroskedasticity
p-valuesAlternative Hypothesis
breakpoint indexgreater2-sidedless
167.82716348216002e-050.0001565432696432000.999921728365178
172.64739844036383e-065.29479688072766e-060.99999735260156
181.07224366610251e-062.14448733220503e-060.999998927756334
195.8294858276586e-081.16589716553172e-070.999999941705142
205.17741895871307e-091.03548379174261e-080.999999994822581
215.37506316177653e-091.07501263235531e-080.999999994624937
225.83555960711212e-061.16711192142242e-050.999994164440393
231.61781803239488e-053.23563606478976e-050.999983821819676
241.88342885362498e-053.76685770724996e-050.999981165711464
257.03128401072435e-061.40625680214487e-050.99999296871599
263.45055823378163e-066.90111646756326e-060.999996549441766
272.82393443080600e-065.64786886161200e-060.99999717606557
281.20425709091510e-062.40851418183021e-060.99999879574291
295.96895638894492e-071.19379127778898e-060.99999940310436
303.91125133886769e-077.82250267773539e-070.999999608874866
312.17072092921056e-074.34144185842111e-070.999999782927907
321.26816881117096e-072.53633762234192e-070.99999987318312
333.08561776688866e-076.17123553377732e-070.999999691438223
342.11861642261216e-054.23723284522431e-050.999978813835774
350.0003584876669407730.0007169753338815470.99964151233306
360.00356908135870.00713816271740.9964309186413
370.009762727376306280.01952545475261260.990237272623694
380.03683390220969820.07366780441939640.963166097790302
390.1158732596435850.2317465192871710.884126740356415
400.2189340048188340.4378680096376680.781065995181166
410.4344384894959910.8688769789919810.565561510504009
420.604349319254930.791301361490140.39565068074507
430.6938890564198620.6122218871602750.306110943580138
440.784203405443650.4315931891126980.215796594556349
450.8919267359249970.2161465281500060.108073264075003
460.9654618572970170.06907628540596660.0345381427029833
470.9914148076321880.0171703847356230.0085851923678115
480.998151737510650.003696524978700320.00184826248935016
490.9999499163977460.0001001672045089315.00836022544653e-05
500.9999996745829586.50834084964026e-073.25417042482013e-07
510.999999942491321.15017359525667e-075.75086797628333e-08
520.9999999934709881.30580241381422e-086.52901206907111e-09
530.9999999675706536.48586940590337e-083.24293470295168e-08
540.9999994977070421.00458591651325e-065.02292958256626e-07
550.9999924650226081.50699547848338e-057.5349773924169e-06
560.9999412295585630.0001175408828741455.87704414370725e-05
570.9995532959005130.0008934081989737310.000446704099486866


Meta Analysis of Goldfeld-Quandt test for Heteroskedasticity
Description# significant tests% significant testsOK/NOK
1% type I error level310.738095238095238NOK
5% type I error level330.785714285714286NOK
10% type I error level350.833333333333333NOK

\begin{tabular}{lllllllll}
\hline
Meta Analysis of Goldfeld-Quandt test for Heteroskedasticity \tabularnewline
Description & # significant tests & % significant tests & OK/NOK \tabularnewline
1% type I error level & 31 & 0.738095238095238 & NOK \tabularnewline
5% type I error level & 33 & 0.785714285714286 & NOK \tabularnewline
10% type I error level & 35 & 0.833333333333333 & NOK \tabularnewline
\hline
\end{tabular}
%Source: https://freestatistics.org/blog/index.php?pk=102725&T=6

[TABLE]
[ROW][C]Meta Analysis of Goldfeld-Quandt test for Heteroskedasticity[/C][/ROW]
[ROW][C]Description[/C][C]# significant tests[/C][C]% significant tests[/C][C]OK/NOK[/C][/ROW]
[ROW][C]1% type I error level[/C][C]31[/C][C]0.738095238095238[/C][C]NOK[/C][/ROW]
[ROW][C]5% type I error level[/C][C]33[/C][C]0.785714285714286[/C][C]NOK[/C][/ROW]
[ROW][C]10% type I error level[/C][C]35[/C][C]0.833333333333333[/C][C]NOK[/C][/ROW]
[/TABLE]
Source: https://freestatistics.org/blog/index.php?pk=102725&T=6

Globally Unique Identifier (entire table): ba.freestatistics.org/blog/index.php?pk=102725&T=6

As an alternative you can also use a QR Code:  

The GUIDs for individual cells are displayed in the table below:

Meta Analysis of Goldfeld-Quandt test for Heteroskedasticity
Description# significant tests% significant testsOK/NOK
1% type I error level310.738095238095238NOK
5% type I error level330.785714285714286NOK
10% type I error level350.833333333333333NOK


Parameters (Session):
par1 = 1 ; par2 = Include Monthly Dummies ; par3 = Linear Trend ;
Parameters (R input):
par1 = 1 ; par2 = Include Monthly Dummies ; par3 = Linear Trend ;
R code (references can be found in the software module):
library(lattice)
library(lmtest)
n25 <- 25 #minimum number of obs. for Goldfeld-Quandt test
par1 <- as.numeric(par1)
x <- t(y)
k <- length(x[1,])
n <- length(x[,1])
x1 <- cbind(x[,par1], x[,1:k!=par1])
mycolnames <- c(colnames(x)[par1], colnames(x)[1:k!=par1])
colnames(x1) <- mycolnames #colnames(x)[par1]
x <- x1
if (par3 == 'First Differences'){
x2 <- array(0, dim=c(n-1,k), dimnames=list(1:(n-1), paste('(1-B)',colnames(x),sep='')))
for (i in 1:n-1) {
for (j in 1:k) {
x2[i,j] <- x[i+1,j] - x[i,j]
}
}
x <- x2
}
if (par2 == 'Include Monthly Dummies'){
x2 <- array(0, dim=c(n,11), dimnames=list(1:n, paste('M', seq(1:11), sep ='')))
for (i in 1:11){
x2[seq(i,n,12),i] <- 1
}
x <- cbind(x, x2)
}
if (par2 == 'Include Quarterly Dummies'){
x2 <- array(0, dim=c(n,3), dimnames=list(1:n, paste('Q', seq(1:3), sep ='')))
for (i in 1:3){
x2[seq(i,n,4),i] <- 1
}
x <- cbind(x, x2)
}
k <- length(x[1,])
if (par3 == 'Linear Trend'){
x <- cbind(x, c(1:n))
colnames(x)[k+1] <- 't'
}
x
k <- length(x[1,])
df <- as.data.frame(x)
(mylm <- lm(df))
(mysum <- summary(mylm))
if (n > n25) {
kp3 <- k + 3
nmkm3 <- n - k - 3
gqarr <- array(NA, dim=c(nmkm3-kp3+1,3))
numgqtests <- 0
numsignificant1 <- 0
numsignificant5 <- 0
numsignificant10 <- 0
for (mypoint in kp3:nmkm3) {
j <- 0
numgqtests <- numgqtests + 1
for (myalt in c('greater', 'two.sided', 'less')) {
j <- j + 1
gqarr[mypoint-kp3+1,j] <- gqtest(mylm, point=mypoint, alternative=myalt)$p.value
}
if (gqarr[mypoint-kp3+1,2] < 0.01) numsignificant1 <- numsignificant1 + 1
if (gqarr[mypoint-kp3+1,2] < 0.05) numsignificant5 <- numsignificant5 + 1
if (gqarr[mypoint-kp3+1,2] < 0.10) numsignificant10 <- numsignificant10 + 1
}
gqarr
}
bitmap(file='test0.png')
plot(x[,1], type='l', main='Actuals and Interpolation', ylab='value of Actuals and Interpolation (dots)', xlab='time or index')
points(x[,1]-mysum$resid)
grid()
dev.off()
bitmap(file='test1.png')
plot(mysum$resid, type='b', pch=19, main='Residuals', ylab='value of Residuals', xlab='time or index')
grid()
dev.off()
bitmap(file='test2.png')
hist(mysum$resid, main='Residual Histogram', xlab='values of Residuals')
grid()
dev.off()
bitmap(file='test3.png')
densityplot(~mysum$resid,col='black',main='Residual Density Plot', xlab='values of Residuals')
dev.off()
bitmap(file='test4.png')
qqnorm(mysum$resid, main='Residual Normal Q-Q Plot')
qqline(mysum$resid)
grid()
dev.off()
(myerror <- as.ts(mysum$resid))
bitmap(file='test5.png')
dum <- cbind(lag(myerror,k=1),myerror)
dum
dum1 <- dum[2:length(myerror),]
dum1
z <- as.data.frame(dum1)
z
plot(z,main=paste('Residual Lag plot, lowess, and regression line'), ylab='values of Residuals', xlab='lagged values of Residuals')
lines(lowess(z))
abline(lm(z))
grid()
dev.off()
bitmap(file='test6.png')
acf(mysum$resid, lag.max=length(mysum$resid)/2, main='Residual Autocorrelation Function')
grid()
dev.off()
bitmap(file='test7.png')
pacf(mysum$resid, lag.max=length(mysum$resid)/2, main='Residual Partial Autocorrelation Function')
grid()
dev.off()
bitmap(file='test8.png')
opar <- par(mfrow = c(2,2), oma = c(0, 0, 1.1, 0))
plot(mylm, las = 1, sub='Residual Diagnostics')
par(opar)
dev.off()
if (n > n25) {
bitmap(file='test9.png')
plot(kp3:nmkm3,gqarr[,2], main='Goldfeld-Quandt test',ylab='2-sided p-value',xlab='breakpoint')
grid()
dev.off()
}
load(file='createtable')
a<-table.start()
a<-table.row.start(a)
a<-table.element(a, 'Multiple Linear Regression - Estimated Regression Equation', 1, TRUE)
a<-table.row.end(a)
myeq <- colnames(x)[1]
myeq <- paste(myeq, '[t] = ', sep='')
for (i in 1:k){
if (mysum$coefficients[i,1] > 0) myeq <- paste(myeq, '+', '')
myeq <- paste(myeq, mysum$coefficients[i,1], sep=' ')
if (rownames(mysum$coefficients)[i] != '(Intercept)') {
myeq <- paste(myeq, rownames(mysum$coefficients)[i], sep='')
if (rownames(mysum$coefficients)[i] != 't') myeq <- paste(myeq, '[t]', sep='')
}
}
myeq <- paste(myeq, ' + e[t]')
a<-table.row.start(a)
a<-table.element(a, myeq)
a<-table.row.end(a)
a<-table.end(a)
table.save(a,file='mytable1.tab')
a<-table.start()
a<-table.row.start(a)
a<-table.element(a,hyperlink('ols1.htm','Multiple Linear Regression - Ordinary Least Squares',''), 6, TRUE)
a<-table.row.end(a)
a<-table.row.start(a)
a<-table.element(a,'Variable',header=TRUE)
a<-table.element(a,'Parameter',header=TRUE)
a<-table.element(a,'S.D.',header=TRUE)
a<-table.element(a,'T-STAT
H0: parameter = 0',header=TRUE)
a<-table.element(a,'2-tail p-value',header=TRUE)
a<-table.element(a,'1-tail p-value',header=TRUE)
a<-table.row.end(a)
for (i in 1:k){
a<-table.row.start(a)
a<-table.element(a,rownames(mysum$coefficients)[i],header=TRUE)
a<-table.element(a,mysum$coefficients[i,1])
a<-table.element(a, round(mysum$coefficients[i,2],6))
a<-table.element(a, round(mysum$coefficients[i,3],4))
a<-table.element(a, round(mysum$coefficients[i,4],6))
a<-table.element(a, round(mysum$coefficients[i,4]/2,6))
a<-table.row.end(a)
}
a<-table.end(a)
table.save(a,file='mytable2.tab')
a<-table.start()
a<-table.row.start(a)
a<-table.element(a, 'Multiple Linear Regression - Regression Statistics', 2, TRUE)
a<-table.row.end(a)
a<-table.row.start(a)
a<-table.element(a, 'Multiple R',1,TRUE)
a<-table.element(a, sqrt(mysum$r.squared))
a<-table.row.end(a)
a<-table.row.start(a)
a<-table.element(a, 'R-squared',1,TRUE)
a<-table.element(a, mysum$r.squared)
a<-table.row.end(a)
a<-table.row.start(a)
a<-table.element(a, 'Adjusted R-squared',1,TRUE)
a<-table.element(a, mysum$adj.r.squared)
a<-table.row.end(a)
a<-table.row.start(a)
a<-table.element(a, 'F-TEST (value)',1,TRUE)
a<-table.element(a, mysum$fstatistic[1])
a<-table.row.end(a)
a<-table.row.start(a)
a<-table.element(a, 'F-TEST (DF numerator)',1,TRUE)
a<-table.element(a, mysum$fstatistic[2])
a<-table.row.end(a)
a<-table.row.start(a)
a<-table.element(a, 'F-TEST (DF denominator)',1,TRUE)
a<-table.element(a, mysum$fstatistic[3])
a<-table.row.end(a)
a<-table.row.start(a)
a<-table.element(a, 'p-value',1,TRUE)
a<-table.element(a, 1-pf(mysum$fstatistic[1],mysum$fstatistic[2],mysum$fstatistic[3]))
a<-table.row.end(a)
a<-table.row.start(a)
a<-table.element(a, 'Multiple Linear Regression - Residual Statistics', 2, TRUE)
a<-table.row.end(a)
a<-table.row.start(a)
a<-table.element(a, 'Residual Standard Deviation',1,TRUE)
a<-table.element(a, mysum$sigma)
a<-table.row.end(a)
a<-table.row.start(a)
a<-table.element(a, 'Sum Squared Residuals',1,TRUE)
a<-table.element(a, sum(myerror*myerror))
a<-table.row.end(a)
a<-table.end(a)
table.save(a,file='mytable3.tab')
a<-table.start()
a<-table.row.start(a)
a<-table.element(a, 'Multiple Linear Regression - Actuals, Interpolation, and Residuals', 4, TRUE)
a<-table.row.end(a)
a<-table.row.start(a)
a<-table.element(a, 'Time or Index', 1, TRUE)
a<-table.element(a, 'Actuals', 1, TRUE)
a<-table.element(a, 'Interpolation
Forecast', 1, TRUE)
a<-table.element(a, 'Residuals
Prediction Error', 1, TRUE)
a<-table.row.end(a)
for (i in 1:n) {
a<-table.row.start(a)
a<-table.element(a,i, 1, TRUE)
a<-table.element(a,x[i])
a<-table.element(a,x[i]-mysum$resid[i])
a<-table.element(a,mysum$resid[i])
a<-table.row.end(a)
}
a<-table.end(a)
table.save(a,file='mytable4.tab')
if (n > n25) {
a<-table.start()
a<-table.row.start(a)
a<-table.element(a,'Goldfeld-Quandt test for Heteroskedasticity',4,TRUE)
a<-table.row.end(a)
a<-table.row.start(a)
a<-table.element(a,'p-values',header=TRUE)
a<-table.element(a,'Alternative Hypothesis',3,header=TRUE)
a<-table.row.end(a)
a<-table.row.start(a)
a<-table.element(a,'breakpoint index',header=TRUE)
a<-table.element(a,'greater',header=TRUE)
a<-table.element(a,'2-sided',header=TRUE)
a<-table.element(a,'less',header=TRUE)
a<-table.row.end(a)
for (mypoint in kp3:nmkm3) {
a<-table.row.start(a)
a<-table.element(a,mypoint,header=TRUE)
a<-table.element(a,gqarr[mypoint-kp3+1,1])
a<-table.element(a,gqarr[mypoint-kp3+1,2])
a<-table.element(a,gqarr[mypoint-kp3+1,3])
a<-table.row.end(a)
}
a<-table.end(a)
table.save(a,file='mytable5.tab')
a<-table.start()
a<-table.row.start(a)
a<-table.element(a,'Meta Analysis of Goldfeld-Quandt test for Heteroskedasticity',4,TRUE)
a<-table.row.end(a)
a<-table.row.start(a)
a<-table.element(a,'Description',header=TRUE)
a<-table.element(a,'# significant tests',header=TRUE)
a<-table.element(a,'% significant tests',header=TRUE)
a<-table.element(a,'OK/NOK',header=TRUE)
a<-table.row.end(a)
a<-table.row.start(a)
a<-table.element(a,'1% type I error level',header=TRUE)
a<-table.element(a,numsignificant1)
a<-table.element(a,numsignificant1/numgqtests)
if (numsignificant1/numgqtests < 0.01) dum <- 'OK' else dum <- 'NOK'
a<-table.element(a,dum)
a<-table.row.end(a)
a<-table.row.start(a)
a<-table.element(a,'5% type I error level',header=TRUE)
a<-table.element(a,numsignificant5)
a<-table.element(a,numsignificant5/numgqtests)
if (numsignificant5/numgqtests < 0.05) dum <- 'OK' else dum <- 'NOK'
a<-table.element(a,dum)
a<-table.row.end(a)
a<-table.row.start(a)
a<-table.element(a,'10% type I error level',header=TRUE)
a<-table.element(a,numsignificant10)
a<-table.element(a,numsignificant10/numgqtests)
if (numsignificant10/numgqtests < 0.1) dum <- 'OK' else dum <- 'NOK'
a<-table.element(a,dum)
a<-table.row.end(a)
a<-table.end(a)
table.save(a,file='mytable6.tab')
}