Free Statistics

of Irreproducible Research!

Author's title

Author*The author of this computation has been verified*
R Software Modulerwasp_multipleregression.wasp
Title produced by softwareMultiple Regression
Date of computationMon, 29 Nov 2010 11:05:57 +0000
Cite this page as followsStatistical Computations at FreeStatistics.org, Office for Research Development and Education, URL https://freestatistics.org/blog/index.php?v=date/2010/Nov/29/t12910286904wz68w8r2odzi8j.htm/, Retrieved Mon, 29 Apr 2024 10:12:32 +0000
Statistical Computations at FreeStatistics.org, Office for Research Development and Education, URL https://freestatistics.org/blog/index.php?pk=102831, Retrieved Mon, 29 Apr 2024 10:12:32 +0000
QR Codes:

Original text written by user:
IsPrivate?No (this computation is public)
User-defined keywords
Estimated Impact122
Family? (F = Feedback message, R = changed R code, M = changed R Module, P = changed Parameters, D = changed Data)
-     [Multiple Regression] [HPC Retail Sales] [2008-03-08 13:40:54] [1c0f2c85e8a48e42648374b3bcceca26]
F  MPD    [Multiple Regression] [Ws 8 - Regression...] [2010-11-29 11:05:57] [0829c729852d8a4b1b0c41cf0848af95] [Current]
Feedback Forum
2010-12-07 07:00:01 [411b43619fc9db329bbcdbf7261c55fb] [reply
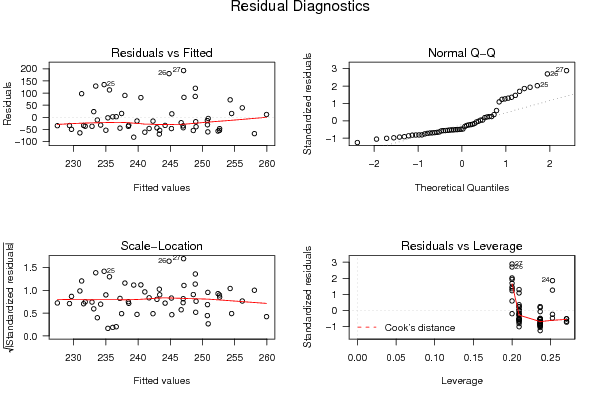
Bij de tweede techniek (Multiple Regression) die de student gebruikt. Merkt hij terecht op dat geen enkele variabele iets verklaart (hun p-waarden zijn allemaal boven de gestelde type 1-fout van 0,05). De student merkt het niet direct op in zijn mini-tutorial, maar dit had je ook al kunnen merken aan de Adjusted R-squared die negatief is (kan je eigenlijk beschouwen als nul) en de p-waarde van 99,99%. Dit geeft duidelijk aan dat we het model niet kunnen gebruiken om betrouwbare voorspellingen te maken. Voor de rest slaagt de student er wel zeer goed in om de assumpties van het model te bespreken. Je merkt hierbij zeer goed, dat hij begrijpt over wat hij spreekt (hij interpreteert echt zijn resultaat).

Post a new message
Dataseries X:
167.16
179.84
174.44
180.35
193.17
195.16
202.43
189.91
195.98
212.09
205.81
204.31
196.07
199.98
199.10
198.31
195.72
223.04
238.41
259.73
326.54
335.15
321.81
368.62
369.59
425.00
439.72
362.23
328.76
348.55
328.18
329.34
295.55
237.38
226.85
220.14
239.36
224.69
230.98
233.47
256.70
253.41
224.95
210.37
191.09
198.85
211.04
206.25
201.51
194.54
191.07
192.82
181.88
157.67
195.82
246.25
271.69
270.29


Summary of computational transaction
Raw Inputview raw input (R code)
Raw Outputview raw output of R engine
Computing time5 seconds
R Server'Sir Ronald Aylmer Fisher' @ 193.190.124.24

\begin{tabular}{lllllllll}
\hline
Summary of computational transaction \tabularnewline
Raw Input & view raw input (R code)  \tabularnewline
Raw Output & view raw output of R engine  \tabularnewline
Computing time & 5 seconds \tabularnewline
R Server & 'Sir Ronald Aylmer Fisher' @ 193.190.124.24 \tabularnewline
\hline
\end{tabular}
%Source: https://freestatistics.org/blog/index.php?pk=102831&T=0

[TABLE]
[ROW][C]Summary of computational transaction[/C][/ROW]
[ROW][C]Raw Input[/C][C]view raw input (R code) [/C][/ROW]
[ROW][C]Raw Output[/C][C]view raw output of R engine [/C][/ROW]
[ROW][C]Computing time[/C][C]5 seconds[/C][/ROW]
[ROW][C]R Server[/C][C]'Sir Ronald Aylmer Fisher' @ 193.190.124.24[/C][/ROW]
[/TABLE]
Source: https://freestatistics.org/blog/index.php?pk=102831&T=0

Globally Unique Identifier (entire table): ba.freestatistics.org/blog/index.php?pk=102831&T=0

As an alternative you can also use a QR Code:  

The GUIDs for individual cells are displayed in the table below:

Summary of computational transaction
Raw Inputview raw input (R code)
Raw Outputview raw output of R engine
Computing time5 seconds
R Server'Sir Ronald Aylmer Fisher' @ 193.190.124.24


Multiple Linear Regression - Estimated Regression Equation
Tarwe[t] = + 245.128295454545 -14.3083825757576M1[t] -4.39310606060605M2[t] -2.29782954545454M3[t] -16.0805530303030M4[t] -18.4272765151515M5[t] -14.264M6[t] -12.0287234848485M7[t] -3.02344696969697M8[t] + 5.86982954545454M9[t] + 0.295106060606054M10[t] -8.29577651515151M11[t] + 0.156723484848486t + e[t]

\begin{tabular}{lllllllll}
\hline
Multiple Linear Regression - Estimated Regression Equation \tabularnewline
Tarwe[t] =  +  245.128295454545 -14.3083825757576M1[t] -4.39310606060605M2[t] -2.29782954545454M3[t] -16.0805530303030M4[t] -18.4272765151515M5[t] -14.264M6[t] -12.0287234848485M7[t] -3.02344696969697M8[t] +  5.86982954545454M9[t] +  0.295106060606054M10[t] -8.29577651515151M11[t] +  0.156723484848486t  + e[t] \tabularnewline
\hline
\end{tabular}
%Source: https://freestatistics.org/blog/index.php?pk=102831&T=1

[TABLE]
[ROW][C]Multiple Linear Regression - Estimated Regression Equation[/C][/ROW]
[ROW][C]Tarwe[t] =  +  245.128295454545 -14.3083825757576M1[t] -4.39310606060605M2[t] -2.29782954545454M3[t] -16.0805530303030M4[t] -18.4272765151515M5[t] -14.264M6[t] -12.0287234848485M7[t] -3.02344696969697M8[t] +  5.86982954545454M9[t] +  0.295106060606054M10[t] -8.29577651515151M11[t] +  0.156723484848486t  + e[t][/C][/ROW]
[/TABLE]
Source: https://freestatistics.org/blog/index.php?pk=102831&T=1

Globally Unique Identifier (entire table): ba.freestatistics.org/blog/index.php?pk=102831&T=1

As an alternative you can also use a QR Code:  

The GUIDs for individual cells are displayed in the table below:

Multiple Linear Regression - Estimated Regression Equation
Tarwe[t] = + 245.128295454545 -14.3083825757576M1[t] -4.39310606060605M2[t] -2.29782954545454M3[t] -16.0805530303030M4[t] -18.4272765151515M5[t] -14.264M6[t] -12.0287234848485M7[t] -3.02344696969697M8[t] + 5.86982954545454M9[t] + 0.295106060606054M10[t] -8.29577651515151M11[t] + 0.156723484848486t + e[t]


Multiple Linear Regression - Ordinary Least Squares
VariableParameterS.D.T-STATH0: parameter = 02-tail p-value1-tail p-value
(Intercept)245.12829545454541.3216775.932200
M1-14.308382575757650.130717-0.28540.7766310.388315
M2-4.3931060606060550.099169-0.08770.9305140.465257
M3-2.2978295454545450.074619-0.04590.9636020.481801
M4-16.080553030303050.057075-0.32120.7495130.374756
M5-18.427276515151550.046546-0.36820.7144480.357224
M6-14.26450.043036-0.2850.7769250.388463
M7-12.028723484848550.046546-0.24040.811150.405575
M8-3.0234469696969750.057075-0.06040.9521050.476052
M95.8698295454545450.0746190.11720.9072060.453603
M100.29510606060605450.0991690.00590.9953260.497663
M11-8.2957765151515152.753321-0.15730.8757470.437873
t0.1567234848484860.5927340.26440.7926730.396336

\begin{tabular}{lllllllll}
\hline
Multiple Linear Regression - Ordinary Least Squares \tabularnewline
Variable & Parameter & S.D. & T-STATH0: parameter = 0 & 2-tail p-value & 1-tail p-value \tabularnewline
(Intercept) & 245.128295454545 & 41.321677 & 5.9322 & 0 & 0 \tabularnewline
M1 & -14.3083825757576 & 50.130717 & -0.2854 & 0.776631 & 0.388315 \tabularnewline
M2 & -4.39310606060605 & 50.099169 & -0.0877 & 0.930514 & 0.465257 \tabularnewline
M3 & -2.29782954545454 & 50.074619 & -0.0459 & 0.963602 & 0.481801 \tabularnewline
M4 & -16.0805530303030 & 50.057075 & -0.3212 & 0.749513 & 0.374756 \tabularnewline
M5 & -18.4272765151515 & 50.046546 & -0.3682 & 0.714448 & 0.357224 \tabularnewline
M6 & -14.264 & 50.043036 & -0.285 & 0.776925 & 0.388463 \tabularnewline
M7 & -12.0287234848485 & 50.046546 & -0.2404 & 0.81115 & 0.405575 \tabularnewline
M8 & -3.02344696969697 & 50.057075 & -0.0604 & 0.952105 & 0.476052 \tabularnewline
M9 & 5.86982954545454 & 50.074619 & 0.1172 & 0.907206 & 0.453603 \tabularnewline
M10 & 0.295106060606054 & 50.099169 & 0.0059 & 0.995326 & 0.497663 \tabularnewline
M11 & -8.29577651515151 & 52.753321 & -0.1573 & 0.875747 & 0.437873 \tabularnewline
t & 0.156723484848486 & 0.592734 & 0.2644 & 0.792673 & 0.396336 \tabularnewline
\hline
\end{tabular}
%Source: https://freestatistics.org/blog/index.php?pk=102831&T=2

[TABLE]
[ROW][C]Multiple Linear Regression - Ordinary Least Squares[/C][/ROW]
[ROW][C]Variable[/C][C]Parameter[/C][C]S.D.[/C][C]T-STATH0: parameter = 0[/C][C]2-tail p-value[/C][C]1-tail p-value[/C][/ROW]
[ROW][C](Intercept)[/C][C]245.128295454545[/C][C]41.321677[/C][C]5.9322[/C][C]0[/C][C]0[/C][/ROW]
[ROW][C]M1[/C][C]-14.3083825757576[/C][C]50.130717[/C][C]-0.2854[/C][C]0.776631[/C][C]0.388315[/C][/ROW]
[ROW][C]M2[/C][C]-4.39310606060605[/C][C]50.099169[/C][C]-0.0877[/C][C]0.930514[/C][C]0.465257[/C][/ROW]
[ROW][C]M3[/C][C]-2.29782954545454[/C][C]50.074619[/C][C]-0.0459[/C][C]0.963602[/C][C]0.481801[/C][/ROW]
[ROW][C]M4[/C][C]-16.0805530303030[/C][C]50.057075[/C][C]-0.3212[/C][C]0.749513[/C][C]0.374756[/C][/ROW]
[ROW][C]M5[/C][C]-18.4272765151515[/C][C]50.046546[/C][C]-0.3682[/C][C]0.714448[/C][C]0.357224[/C][/ROW]
[ROW][C]M6[/C][C]-14.264[/C][C]50.043036[/C][C]-0.285[/C][C]0.776925[/C][C]0.388463[/C][/ROW]
[ROW][C]M7[/C][C]-12.0287234848485[/C][C]50.046546[/C][C]-0.2404[/C][C]0.81115[/C][C]0.405575[/C][/ROW]
[ROW][C]M8[/C][C]-3.02344696969697[/C][C]50.057075[/C][C]-0.0604[/C][C]0.952105[/C][C]0.476052[/C][/ROW]
[ROW][C]M9[/C][C]5.86982954545454[/C][C]50.074619[/C][C]0.1172[/C][C]0.907206[/C][C]0.453603[/C][/ROW]
[ROW][C]M10[/C][C]0.295106060606054[/C][C]50.099169[/C][C]0.0059[/C][C]0.995326[/C][C]0.497663[/C][/ROW]
[ROW][C]M11[/C][C]-8.29577651515151[/C][C]52.753321[/C][C]-0.1573[/C][C]0.875747[/C][C]0.437873[/C][/ROW]
[ROW][C]t[/C][C]0.156723484848486[/C][C]0.592734[/C][C]0.2644[/C][C]0.792673[/C][C]0.396336[/C][/ROW]
[/TABLE]
Source: https://freestatistics.org/blog/index.php?pk=102831&T=2

Globally Unique Identifier (entire table): ba.freestatistics.org/blog/index.php?pk=102831&T=2

As an alternative you can also use a QR Code:  

The GUIDs for individual cells are displayed in the table below:

Multiple Linear Regression - Ordinary Least Squares
VariableParameterS.D.T-STATH0: parameter = 02-tail p-value1-tail p-value
(Intercept)245.12829545454541.3216775.932200
M1-14.308382575757650.130717-0.28540.7766310.388315
M2-4.3931060606060550.099169-0.08770.9305140.465257
M3-2.2978295454545450.074619-0.04590.9636020.481801
M4-16.080553030303050.057075-0.32120.7495130.374756
M5-18.427276515151550.046546-0.36820.7144480.357224
M6-14.26450.043036-0.2850.7769250.388463
M7-12.028723484848550.046546-0.24040.811150.405575
M8-3.0234469696969750.057075-0.06040.9521050.476052
M95.8698295454545450.0746190.11720.9072060.453603
M100.29510606060605450.0991690.00590.9953260.497663
M11-8.2957765151515152.753321-0.15730.8757470.437873
t0.1567234848484860.5927340.26440.7926730.396336


Multiple Linear Regression - Regression Statistics
Multiple R0.122409353781914
R-squared0.0149840498933058
Adjusted R-squared-0.247686870135146
F-TEST (value)0.057044951499324
F-TEST (DF numerator)12
F-TEST (DF denominator)45
p-value0.999997131728267
Multiple Linear Regression - Residual Statistics
Residual Standard Deviation74.599753247114
Sum Squared Residuals250430.543303864

\begin{tabular}{lllllllll}
\hline
Multiple Linear Regression - Regression Statistics \tabularnewline
Multiple R & 0.122409353781914 \tabularnewline
R-squared & 0.0149840498933058 \tabularnewline
Adjusted R-squared & -0.247686870135146 \tabularnewline
F-TEST (value) & 0.057044951499324 \tabularnewline
F-TEST (DF numerator) & 12 \tabularnewline
F-TEST (DF denominator) & 45 \tabularnewline
p-value & 0.999997131728267 \tabularnewline
Multiple Linear Regression - Residual Statistics \tabularnewline
Residual Standard Deviation & 74.599753247114 \tabularnewline
Sum Squared Residuals & 250430.543303864 \tabularnewline
\hline
\end{tabular}
%Source: https://freestatistics.org/blog/index.php?pk=102831&T=3

[TABLE]
[ROW][C]Multiple Linear Regression - Regression Statistics[/C][/ROW]
[ROW][C]Multiple R[/C][C]0.122409353781914[/C][/ROW]
[ROW][C]R-squared[/C][C]0.0149840498933058[/C][/ROW]
[ROW][C]Adjusted R-squared[/C][C]-0.247686870135146[/C][/ROW]
[ROW][C]F-TEST (value)[/C][C]0.057044951499324[/C][/ROW]
[ROW][C]F-TEST (DF numerator)[/C][C]12[/C][/ROW]
[ROW][C]F-TEST (DF denominator)[/C][C]45[/C][/ROW]
[ROW][C]p-value[/C][C]0.999997131728267[/C][/ROW]
[ROW][C]Multiple Linear Regression - Residual Statistics[/C][/ROW]
[ROW][C]Residual Standard Deviation[/C][C]74.599753247114[/C][/ROW]
[ROW][C]Sum Squared Residuals[/C][C]250430.543303864[/C][/ROW]
[/TABLE]
Source: https://freestatistics.org/blog/index.php?pk=102831&T=3

Globally Unique Identifier (entire table): ba.freestatistics.org/blog/index.php?pk=102831&T=3

As an alternative you can also use a QR Code:  

The GUIDs for individual cells are displayed in the table below:

Multiple Linear Regression - Regression Statistics
Multiple R0.122409353781914
R-squared0.0149840498933058
Adjusted R-squared-0.247686870135146
F-TEST (value)0.057044951499324
F-TEST (DF numerator)12
F-TEST (DF denominator)45
p-value0.999997131728267
Multiple Linear Regression - Residual Statistics
Residual Standard Deviation74.599753247114
Sum Squared Residuals250430.543303864


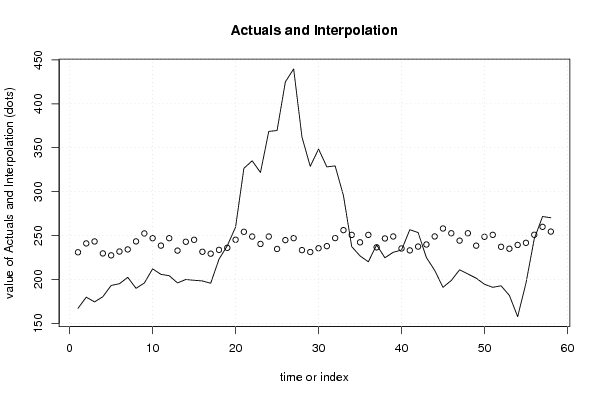
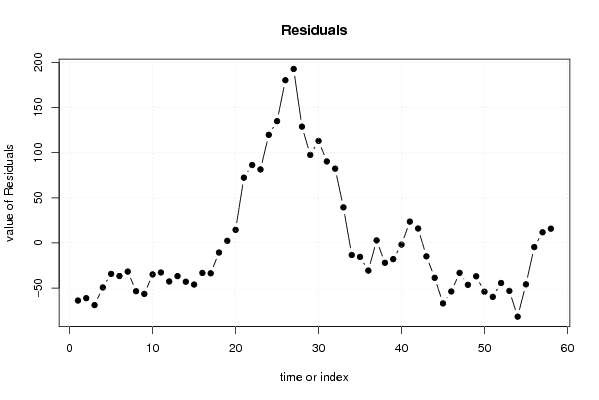
Multiple Linear Regression - Actuals, Interpolation, and Residuals
Time or IndexActualsInterpolationForecastResidualsPrediction Error
1167.16230.976636363637-63.8166363636367
2179.84241.048636363636-61.2086363636364
3174.44243.300636363636-68.8606363636364
4180.35229.674636363636-49.3246363636364
5193.17227.484636363636-34.3146363636363
6195.16231.804636363636-36.6446363636363
7202.43234.196636363636-31.7666363636364
8189.91243.358636363636-53.4486363636364
9195.98252.408636363636-56.4286363636363
10212.09246.990636363636-34.9006363636363
11205.81238.556477272727-32.7464772727273
12204.31247.008977272727-42.6989772727272
13196.07232.857318181818-36.7873181818181
14199.98242.929318181818-42.9493181818182
15199.1245.181318181818-46.0813181818182
16198.31231.555318181818-33.2453181818182
17195.72229.365318181818-33.6453181818182
18223.04233.685318181818-10.6453181818182
19238.41236.0773181818182.33268181818182
20259.73245.23931818181814.4906818181818
21326.54254.28931818181872.2506818181818
22335.15248.87131818181886.2786818181818
23321.81240.43715909090981.3728409090909
24368.62248.889659090909119.730340909091
25369.59234.738134.852
26425244.81180.19
27439.72247.062192.658
28362.23233.436128.794
29328.76231.24697.514
30348.55235.566112.984
31328.18237.95890.222
32329.34247.1282.22
33295.55256.1739.38
34237.38250.752-13.372
35226.85242.317840909091-15.4678409090909
36220.14250.770340909091-30.6303409090909
37239.36236.6186818181822.74131818181828
38224.69246.690681818182-22.0006818181818
39230.98248.942681818182-17.9626818181818
40233.47235.316681818182-1.84668181818184
41256.7233.12668181818223.5733181818182
42253.41237.44668181818215.9633181818182
43224.95239.838681818182-14.8886818181818
44210.37249.000681818182-38.6306818181818
45191.09258.050681818182-66.9606818181818
46198.85252.632681818182-53.7826818181818
47211.04244.198522727273-33.1585227272727
48206.25252.651022727273-46.4010227272727
49201.51238.499363636364-36.9893636363636
50194.54248.571363636364-54.0313636363637
51191.07250.823363636364-59.7533636363637
52192.82237.197363636364-44.3773636363637
53181.88235.007363636364-53.1273636363636
54157.67239.327363636364-81.6573636363637
55195.82241.719363636364-45.8993636363637
56246.25250.881363636364-4.63136363636365
57271.69259.93136363636411.7586363636363
58270.29254.51336363636415.7766363636364

\begin{tabular}{lllllllll}
\hline
Multiple Linear Regression - Actuals, Interpolation, and Residuals \tabularnewline
Time or Index & Actuals & InterpolationForecast & ResidualsPrediction Error \tabularnewline
1 & 167.16 & 230.976636363637 & -63.8166363636367 \tabularnewline
2 & 179.84 & 241.048636363636 & -61.2086363636364 \tabularnewline
3 & 174.44 & 243.300636363636 & -68.8606363636364 \tabularnewline
4 & 180.35 & 229.674636363636 & -49.3246363636364 \tabularnewline
5 & 193.17 & 227.484636363636 & -34.3146363636363 \tabularnewline
6 & 195.16 & 231.804636363636 & -36.6446363636363 \tabularnewline
7 & 202.43 & 234.196636363636 & -31.7666363636364 \tabularnewline
8 & 189.91 & 243.358636363636 & -53.4486363636364 \tabularnewline
9 & 195.98 & 252.408636363636 & -56.4286363636363 \tabularnewline
10 & 212.09 & 246.990636363636 & -34.9006363636363 \tabularnewline
11 & 205.81 & 238.556477272727 & -32.7464772727273 \tabularnewline
12 & 204.31 & 247.008977272727 & -42.6989772727272 \tabularnewline
13 & 196.07 & 232.857318181818 & -36.7873181818181 \tabularnewline
14 & 199.98 & 242.929318181818 & -42.9493181818182 \tabularnewline
15 & 199.1 & 245.181318181818 & -46.0813181818182 \tabularnewline
16 & 198.31 & 231.555318181818 & -33.2453181818182 \tabularnewline
17 & 195.72 & 229.365318181818 & -33.6453181818182 \tabularnewline
18 & 223.04 & 233.685318181818 & -10.6453181818182 \tabularnewline
19 & 238.41 & 236.077318181818 & 2.33268181818182 \tabularnewline
20 & 259.73 & 245.239318181818 & 14.4906818181818 \tabularnewline
21 & 326.54 & 254.289318181818 & 72.2506818181818 \tabularnewline
22 & 335.15 & 248.871318181818 & 86.2786818181818 \tabularnewline
23 & 321.81 & 240.437159090909 & 81.3728409090909 \tabularnewline
24 & 368.62 & 248.889659090909 & 119.730340909091 \tabularnewline
25 & 369.59 & 234.738 & 134.852 \tabularnewline
26 & 425 & 244.81 & 180.19 \tabularnewline
27 & 439.72 & 247.062 & 192.658 \tabularnewline
28 & 362.23 & 233.436 & 128.794 \tabularnewline
29 & 328.76 & 231.246 & 97.514 \tabularnewline
30 & 348.55 & 235.566 & 112.984 \tabularnewline
31 & 328.18 & 237.958 & 90.222 \tabularnewline
32 & 329.34 & 247.12 & 82.22 \tabularnewline
33 & 295.55 & 256.17 & 39.38 \tabularnewline
34 & 237.38 & 250.752 & -13.372 \tabularnewline
35 & 226.85 & 242.317840909091 & -15.4678409090909 \tabularnewline
36 & 220.14 & 250.770340909091 & -30.6303409090909 \tabularnewline
37 & 239.36 & 236.618681818182 & 2.74131818181828 \tabularnewline
38 & 224.69 & 246.690681818182 & -22.0006818181818 \tabularnewline
39 & 230.98 & 248.942681818182 & -17.9626818181818 \tabularnewline
40 & 233.47 & 235.316681818182 & -1.84668181818184 \tabularnewline
41 & 256.7 & 233.126681818182 & 23.5733181818182 \tabularnewline
42 & 253.41 & 237.446681818182 & 15.9633181818182 \tabularnewline
43 & 224.95 & 239.838681818182 & -14.8886818181818 \tabularnewline
44 & 210.37 & 249.000681818182 & -38.6306818181818 \tabularnewline
45 & 191.09 & 258.050681818182 & -66.9606818181818 \tabularnewline
46 & 198.85 & 252.632681818182 & -53.7826818181818 \tabularnewline
47 & 211.04 & 244.198522727273 & -33.1585227272727 \tabularnewline
48 & 206.25 & 252.651022727273 & -46.4010227272727 \tabularnewline
49 & 201.51 & 238.499363636364 & -36.9893636363636 \tabularnewline
50 & 194.54 & 248.571363636364 & -54.0313636363637 \tabularnewline
51 & 191.07 & 250.823363636364 & -59.7533636363637 \tabularnewline
52 & 192.82 & 237.197363636364 & -44.3773636363637 \tabularnewline
53 & 181.88 & 235.007363636364 & -53.1273636363636 \tabularnewline
54 & 157.67 & 239.327363636364 & -81.6573636363637 \tabularnewline
55 & 195.82 & 241.719363636364 & -45.8993636363637 \tabularnewline
56 & 246.25 & 250.881363636364 & -4.63136363636365 \tabularnewline
57 & 271.69 & 259.931363636364 & 11.7586363636363 \tabularnewline
58 & 270.29 & 254.513363636364 & 15.7766363636364 \tabularnewline
\hline
\end{tabular}
%Source: https://freestatistics.org/blog/index.php?pk=102831&T=4

[TABLE]
[ROW][C]Multiple Linear Regression - Actuals, Interpolation, and Residuals[/C][/ROW]
[ROW][C]Time or Index[/C][C]Actuals[/C][C]InterpolationForecast[/C][C]ResidualsPrediction Error[/C][/ROW]
[ROW][C]1[/C][C]167.16[/C][C]230.976636363637[/C][C]-63.8166363636367[/C][/ROW]
[ROW][C]2[/C][C]179.84[/C][C]241.048636363636[/C][C]-61.2086363636364[/C][/ROW]
[ROW][C]3[/C][C]174.44[/C][C]243.300636363636[/C][C]-68.8606363636364[/C][/ROW]
[ROW][C]4[/C][C]180.35[/C][C]229.674636363636[/C][C]-49.3246363636364[/C][/ROW]
[ROW][C]5[/C][C]193.17[/C][C]227.484636363636[/C][C]-34.3146363636363[/C][/ROW]
[ROW][C]6[/C][C]195.16[/C][C]231.804636363636[/C][C]-36.6446363636363[/C][/ROW]
[ROW][C]7[/C][C]202.43[/C][C]234.196636363636[/C][C]-31.7666363636364[/C][/ROW]
[ROW][C]8[/C][C]189.91[/C][C]243.358636363636[/C][C]-53.4486363636364[/C][/ROW]
[ROW][C]9[/C][C]195.98[/C][C]252.408636363636[/C][C]-56.4286363636363[/C][/ROW]
[ROW][C]10[/C][C]212.09[/C][C]246.990636363636[/C][C]-34.9006363636363[/C][/ROW]
[ROW][C]11[/C][C]205.81[/C][C]238.556477272727[/C][C]-32.7464772727273[/C][/ROW]
[ROW][C]12[/C][C]204.31[/C][C]247.008977272727[/C][C]-42.6989772727272[/C][/ROW]
[ROW][C]13[/C][C]196.07[/C][C]232.857318181818[/C][C]-36.7873181818181[/C][/ROW]
[ROW][C]14[/C][C]199.98[/C][C]242.929318181818[/C][C]-42.9493181818182[/C][/ROW]
[ROW][C]15[/C][C]199.1[/C][C]245.181318181818[/C][C]-46.0813181818182[/C][/ROW]
[ROW][C]16[/C][C]198.31[/C][C]231.555318181818[/C][C]-33.2453181818182[/C][/ROW]
[ROW][C]17[/C][C]195.72[/C][C]229.365318181818[/C][C]-33.6453181818182[/C][/ROW]
[ROW][C]18[/C][C]223.04[/C][C]233.685318181818[/C][C]-10.6453181818182[/C][/ROW]
[ROW][C]19[/C][C]238.41[/C][C]236.077318181818[/C][C]2.33268181818182[/C][/ROW]
[ROW][C]20[/C][C]259.73[/C][C]245.239318181818[/C][C]14.4906818181818[/C][/ROW]
[ROW][C]21[/C][C]326.54[/C][C]254.289318181818[/C][C]72.2506818181818[/C][/ROW]
[ROW][C]22[/C][C]335.15[/C][C]248.871318181818[/C][C]86.2786818181818[/C][/ROW]
[ROW][C]23[/C][C]321.81[/C][C]240.437159090909[/C][C]81.3728409090909[/C][/ROW]
[ROW][C]24[/C][C]368.62[/C][C]248.889659090909[/C][C]119.730340909091[/C][/ROW]
[ROW][C]25[/C][C]369.59[/C][C]234.738[/C][C]134.852[/C][/ROW]
[ROW][C]26[/C][C]425[/C][C]244.81[/C][C]180.19[/C][/ROW]
[ROW][C]27[/C][C]439.72[/C][C]247.062[/C][C]192.658[/C][/ROW]
[ROW][C]28[/C][C]362.23[/C][C]233.436[/C][C]128.794[/C][/ROW]
[ROW][C]29[/C][C]328.76[/C][C]231.246[/C][C]97.514[/C][/ROW]
[ROW][C]30[/C][C]348.55[/C][C]235.566[/C][C]112.984[/C][/ROW]
[ROW][C]31[/C][C]328.18[/C][C]237.958[/C][C]90.222[/C][/ROW]
[ROW][C]32[/C][C]329.34[/C][C]247.12[/C][C]82.22[/C][/ROW]
[ROW][C]33[/C][C]295.55[/C][C]256.17[/C][C]39.38[/C][/ROW]
[ROW][C]34[/C][C]237.38[/C][C]250.752[/C][C]-13.372[/C][/ROW]
[ROW][C]35[/C][C]226.85[/C][C]242.317840909091[/C][C]-15.4678409090909[/C][/ROW]
[ROW][C]36[/C][C]220.14[/C][C]250.770340909091[/C][C]-30.6303409090909[/C][/ROW]
[ROW][C]37[/C][C]239.36[/C][C]236.618681818182[/C][C]2.74131818181828[/C][/ROW]
[ROW][C]38[/C][C]224.69[/C][C]246.690681818182[/C][C]-22.0006818181818[/C][/ROW]
[ROW][C]39[/C][C]230.98[/C][C]248.942681818182[/C][C]-17.9626818181818[/C][/ROW]
[ROW][C]40[/C][C]233.47[/C][C]235.316681818182[/C][C]-1.84668181818184[/C][/ROW]
[ROW][C]41[/C][C]256.7[/C][C]233.126681818182[/C][C]23.5733181818182[/C][/ROW]
[ROW][C]42[/C][C]253.41[/C][C]237.446681818182[/C][C]15.9633181818182[/C][/ROW]
[ROW][C]43[/C][C]224.95[/C][C]239.838681818182[/C][C]-14.8886818181818[/C][/ROW]
[ROW][C]44[/C][C]210.37[/C][C]249.000681818182[/C][C]-38.6306818181818[/C][/ROW]
[ROW][C]45[/C][C]191.09[/C][C]258.050681818182[/C][C]-66.9606818181818[/C][/ROW]
[ROW][C]46[/C][C]198.85[/C][C]252.632681818182[/C][C]-53.7826818181818[/C][/ROW]
[ROW][C]47[/C][C]211.04[/C][C]244.198522727273[/C][C]-33.1585227272727[/C][/ROW]
[ROW][C]48[/C][C]206.25[/C][C]252.651022727273[/C][C]-46.4010227272727[/C][/ROW]
[ROW][C]49[/C][C]201.51[/C][C]238.499363636364[/C][C]-36.9893636363636[/C][/ROW]
[ROW][C]50[/C][C]194.54[/C][C]248.571363636364[/C][C]-54.0313636363637[/C][/ROW]
[ROW][C]51[/C][C]191.07[/C][C]250.823363636364[/C][C]-59.7533636363637[/C][/ROW]
[ROW][C]52[/C][C]192.82[/C][C]237.197363636364[/C][C]-44.3773636363637[/C][/ROW]
[ROW][C]53[/C][C]181.88[/C][C]235.007363636364[/C][C]-53.1273636363636[/C][/ROW]
[ROW][C]54[/C][C]157.67[/C][C]239.327363636364[/C][C]-81.6573636363637[/C][/ROW]
[ROW][C]55[/C][C]195.82[/C][C]241.719363636364[/C][C]-45.8993636363637[/C][/ROW]
[ROW][C]56[/C][C]246.25[/C][C]250.881363636364[/C][C]-4.63136363636365[/C][/ROW]
[ROW][C]57[/C][C]271.69[/C][C]259.931363636364[/C][C]11.7586363636363[/C][/ROW]
[ROW][C]58[/C][C]270.29[/C][C]254.513363636364[/C][C]15.7766363636364[/C][/ROW]
[/TABLE]
Source: https://freestatistics.org/blog/index.php?pk=102831&T=4

Globally Unique Identifier (entire table): ba.freestatistics.org/blog/index.php?pk=102831&T=4

As an alternative you can also use a QR Code:  

The GUIDs for individual cells are displayed in the table below:

Multiple Linear Regression - Actuals, Interpolation, and Residuals
Time or IndexActualsInterpolationForecastResidualsPrediction Error
1167.16230.976636363637-63.8166363636367
2179.84241.048636363636-61.2086363636364
3174.44243.300636363636-68.8606363636364
4180.35229.674636363636-49.3246363636364
5193.17227.484636363636-34.3146363636363
6195.16231.804636363636-36.6446363636363
7202.43234.196636363636-31.7666363636364
8189.91243.358636363636-53.4486363636364
9195.98252.408636363636-56.4286363636363
10212.09246.990636363636-34.9006363636363
11205.81238.556477272727-32.7464772727273
12204.31247.008977272727-42.6989772727272
13196.07232.857318181818-36.7873181818181
14199.98242.929318181818-42.9493181818182
15199.1245.181318181818-46.0813181818182
16198.31231.555318181818-33.2453181818182
17195.72229.365318181818-33.6453181818182
18223.04233.685318181818-10.6453181818182
19238.41236.0773181818182.33268181818182
20259.73245.23931818181814.4906818181818
21326.54254.28931818181872.2506818181818
22335.15248.87131818181886.2786818181818
23321.81240.43715909090981.3728409090909
24368.62248.889659090909119.730340909091
25369.59234.738134.852
26425244.81180.19
27439.72247.062192.658
28362.23233.436128.794
29328.76231.24697.514
30348.55235.566112.984
31328.18237.95890.222
32329.34247.1282.22
33295.55256.1739.38
34237.38250.752-13.372
35226.85242.317840909091-15.4678409090909
36220.14250.770340909091-30.6303409090909
37239.36236.6186818181822.74131818181828
38224.69246.690681818182-22.0006818181818
39230.98248.942681818182-17.9626818181818
40233.47235.316681818182-1.84668181818184
41256.7233.12668181818223.5733181818182
42253.41237.44668181818215.9633181818182
43224.95239.838681818182-14.8886818181818
44210.37249.000681818182-38.6306818181818
45191.09258.050681818182-66.9606818181818
46198.85252.632681818182-53.7826818181818
47211.04244.198522727273-33.1585227272727
48206.25252.651022727273-46.4010227272727
49201.51238.499363636364-36.9893636363636
50194.54248.571363636364-54.0313636363637
51191.07250.823363636364-59.7533636363637
52192.82237.197363636364-44.3773636363637
53181.88235.007363636364-53.1273636363636
54157.67239.327363636364-81.6573636363637
55195.82241.719363636364-45.8993636363637
56246.25250.881363636364-4.63136363636365
57271.69259.93136363636411.7586363636363
58270.29254.51336363636415.7766363636364


Goldfeld-Quandt test for Heteroskedasticity
p-valuesAlternative Hypothesis
breakpoint indexgreater2-sidedless
160.0002189829940963290.0004379659881926570.999781017005904
170.0003947202559068790.0007894405118137590.999605279744093
187.74192489404122e-050.0001548384978808240.99992258075106
193.38841821778283e-056.77683643556565e-050.999966115817822
200.0006463838143504740.001292767628700950.99935361618565
210.03045377934939470.06090755869878940.969546220650605
220.05550079530607350.1110015906121470.944499204693927
230.05643503835813130.1128700767162630.943564961641869
240.1218792719590930.2437585439181850.878120728040907
250.1669789359355510.3339578718711020.833021064064449
260.3907075202673520.7814150405347040.609292479732648
270.7354177988680020.5291644022639960.264582201131998
280.7425915705574750.5148168588850510.257408429442525
290.6945298499635830.6109403000728330.305470150036417
300.7425639385169590.5148721229660820.257436061483041
310.7801455548372730.4397088903254540.219854445162727
320.8093010214373050.3813979571253900.190698978562695
330.8482075977016780.3035848045966450.151792402298322
340.9087490371114170.1825019257771670.0912509628885834
350.9185567864495260.1628864271009480.0814432135504739
360.9235993813721740.1528012372556510.0764006186278257
370.9053794243459120.1892411513081750.0946205756540876
380.8837569156598810.2324861686802370.116243084340118
390.8438339579690480.3123320840619050.156166042030952
400.772022493860860.4559550122782790.227977506139140
410.73865783081010.5226843383798010.261342169189900
420.8787820401258960.2424359197482070.121217959874104

\begin{tabular}{lllllllll}
\hline
Goldfeld-Quandt test for Heteroskedasticity \tabularnewline
p-values & Alternative Hypothesis \tabularnewline
breakpoint index & greater & 2-sided & less \tabularnewline
16 & 0.000218982994096329 & 0.000437965988192657 & 0.999781017005904 \tabularnewline
17 & 0.000394720255906879 & 0.000789440511813759 & 0.999605279744093 \tabularnewline
18 & 7.74192489404122e-05 & 0.000154838497880824 & 0.99992258075106 \tabularnewline
19 & 3.38841821778283e-05 & 6.77683643556565e-05 & 0.999966115817822 \tabularnewline
20 & 0.000646383814350474 & 0.00129276762870095 & 0.99935361618565 \tabularnewline
21 & 0.0304537793493947 & 0.0609075586987894 & 0.969546220650605 \tabularnewline
22 & 0.0555007953060735 & 0.111001590612147 & 0.944499204693927 \tabularnewline
23 & 0.0564350383581313 & 0.112870076716263 & 0.943564961641869 \tabularnewline
24 & 0.121879271959093 & 0.243758543918185 & 0.878120728040907 \tabularnewline
25 & 0.166978935935551 & 0.333957871871102 & 0.833021064064449 \tabularnewline
26 & 0.390707520267352 & 0.781415040534704 & 0.609292479732648 \tabularnewline
27 & 0.735417798868002 & 0.529164402263996 & 0.264582201131998 \tabularnewline
28 & 0.742591570557475 & 0.514816858885051 & 0.257408429442525 \tabularnewline
29 & 0.694529849963583 & 0.610940300072833 & 0.305470150036417 \tabularnewline
30 & 0.742563938516959 & 0.514872122966082 & 0.257436061483041 \tabularnewline
31 & 0.780145554837273 & 0.439708890325454 & 0.219854445162727 \tabularnewline
32 & 0.809301021437305 & 0.381397957125390 & 0.190698978562695 \tabularnewline
33 & 0.848207597701678 & 0.303584804596645 & 0.151792402298322 \tabularnewline
34 & 0.908749037111417 & 0.182501925777167 & 0.0912509628885834 \tabularnewline
35 & 0.918556786449526 & 0.162886427100948 & 0.0814432135504739 \tabularnewline
36 & 0.923599381372174 & 0.152801237255651 & 0.0764006186278257 \tabularnewline
37 & 0.905379424345912 & 0.189241151308175 & 0.0946205756540876 \tabularnewline
38 & 0.883756915659881 & 0.232486168680237 & 0.116243084340118 \tabularnewline
39 & 0.843833957969048 & 0.312332084061905 & 0.156166042030952 \tabularnewline
40 & 0.77202249386086 & 0.455955012278279 & 0.227977506139140 \tabularnewline
41 & 0.7386578308101 & 0.522684338379801 & 0.261342169189900 \tabularnewline
42 & 0.878782040125896 & 0.242435919748207 & 0.121217959874104 \tabularnewline
\hline
\end{tabular}
%Source: https://freestatistics.org/blog/index.php?pk=102831&T=5

[TABLE]
[ROW][C]Goldfeld-Quandt test for Heteroskedasticity[/C][/ROW]
[ROW][C]p-values[/C][C]Alternative Hypothesis[/C][/ROW]
[ROW][C]breakpoint index[/C][C]greater[/C][C]2-sided[/C][C]less[/C][/ROW]
[ROW][C]16[/C][C]0.000218982994096329[/C][C]0.000437965988192657[/C][C]0.999781017005904[/C][/ROW]
[ROW][C]17[/C][C]0.000394720255906879[/C][C]0.000789440511813759[/C][C]0.999605279744093[/C][/ROW]
[ROW][C]18[/C][C]7.74192489404122e-05[/C][C]0.000154838497880824[/C][C]0.99992258075106[/C][/ROW]
[ROW][C]19[/C][C]3.38841821778283e-05[/C][C]6.77683643556565e-05[/C][C]0.999966115817822[/C][/ROW]
[ROW][C]20[/C][C]0.000646383814350474[/C][C]0.00129276762870095[/C][C]0.99935361618565[/C][/ROW]
[ROW][C]21[/C][C]0.0304537793493947[/C][C]0.0609075586987894[/C][C]0.969546220650605[/C][/ROW]
[ROW][C]22[/C][C]0.0555007953060735[/C][C]0.111001590612147[/C][C]0.944499204693927[/C][/ROW]
[ROW][C]23[/C][C]0.0564350383581313[/C][C]0.112870076716263[/C][C]0.943564961641869[/C][/ROW]
[ROW][C]24[/C][C]0.121879271959093[/C][C]0.243758543918185[/C][C]0.878120728040907[/C][/ROW]
[ROW][C]25[/C][C]0.166978935935551[/C][C]0.333957871871102[/C][C]0.833021064064449[/C][/ROW]
[ROW][C]26[/C][C]0.390707520267352[/C][C]0.781415040534704[/C][C]0.609292479732648[/C][/ROW]
[ROW][C]27[/C][C]0.735417798868002[/C][C]0.529164402263996[/C][C]0.264582201131998[/C][/ROW]
[ROW][C]28[/C][C]0.742591570557475[/C][C]0.514816858885051[/C][C]0.257408429442525[/C][/ROW]
[ROW][C]29[/C][C]0.694529849963583[/C][C]0.610940300072833[/C][C]0.305470150036417[/C][/ROW]
[ROW][C]30[/C][C]0.742563938516959[/C][C]0.514872122966082[/C][C]0.257436061483041[/C][/ROW]
[ROW][C]31[/C][C]0.780145554837273[/C][C]0.439708890325454[/C][C]0.219854445162727[/C][/ROW]
[ROW][C]32[/C][C]0.809301021437305[/C][C]0.381397957125390[/C][C]0.190698978562695[/C][/ROW]
[ROW][C]33[/C][C]0.848207597701678[/C][C]0.303584804596645[/C][C]0.151792402298322[/C][/ROW]
[ROW][C]34[/C][C]0.908749037111417[/C][C]0.182501925777167[/C][C]0.0912509628885834[/C][/ROW]
[ROW][C]35[/C][C]0.918556786449526[/C][C]0.162886427100948[/C][C]0.0814432135504739[/C][/ROW]
[ROW][C]36[/C][C]0.923599381372174[/C][C]0.152801237255651[/C][C]0.0764006186278257[/C][/ROW]
[ROW][C]37[/C][C]0.905379424345912[/C][C]0.189241151308175[/C][C]0.0946205756540876[/C][/ROW]
[ROW][C]38[/C][C]0.883756915659881[/C][C]0.232486168680237[/C][C]0.116243084340118[/C][/ROW]
[ROW][C]39[/C][C]0.843833957969048[/C][C]0.312332084061905[/C][C]0.156166042030952[/C][/ROW]
[ROW][C]40[/C][C]0.77202249386086[/C][C]0.455955012278279[/C][C]0.227977506139140[/C][/ROW]
[ROW][C]41[/C][C]0.7386578308101[/C][C]0.522684338379801[/C][C]0.261342169189900[/C][/ROW]
[ROW][C]42[/C][C]0.878782040125896[/C][C]0.242435919748207[/C][C]0.121217959874104[/C][/ROW]
[/TABLE]
Source: https://freestatistics.org/blog/index.php?pk=102831&T=5

Globally Unique Identifier (entire table): ba.freestatistics.org/blog/index.php?pk=102831&T=5

As an alternative you can also use a QR Code:  

The GUIDs for individual cells are displayed in the table below:

Goldfeld-Quandt test for Heteroskedasticity
p-valuesAlternative Hypothesis
breakpoint indexgreater2-sidedless
160.0002189829940963290.0004379659881926570.999781017005904
170.0003947202559068790.0007894405118137590.999605279744093
187.74192489404122e-050.0001548384978808240.99992258075106
193.38841821778283e-056.77683643556565e-050.999966115817822
200.0006463838143504740.001292767628700950.99935361618565
210.03045377934939470.06090755869878940.969546220650605
220.05550079530607350.1110015906121470.944499204693927
230.05643503835813130.1128700767162630.943564961641869
240.1218792719590930.2437585439181850.878120728040907
250.1669789359355510.3339578718711020.833021064064449
260.3907075202673520.7814150405347040.609292479732648
270.7354177988680020.5291644022639960.264582201131998
280.7425915705574750.5148168588850510.257408429442525
290.6945298499635830.6109403000728330.305470150036417
300.7425639385169590.5148721229660820.257436061483041
310.7801455548372730.4397088903254540.219854445162727
320.8093010214373050.3813979571253900.190698978562695
330.8482075977016780.3035848045966450.151792402298322
340.9087490371114170.1825019257771670.0912509628885834
350.9185567864495260.1628864271009480.0814432135504739
360.9235993813721740.1528012372556510.0764006186278257
370.9053794243459120.1892411513081750.0946205756540876
380.8837569156598810.2324861686802370.116243084340118
390.8438339579690480.3123320840619050.156166042030952
400.772022493860860.4559550122782790.227977506139140
410.73865783081010.5226843383798010.261342169189900
420.8787820401258960.2424359197482070.121217959874104


Meta Analysis of Goldfeld-Quandt test for Heteroskedasticity
Description# significant tests% significant testsOK/NOK
1% type I error level50.185185185185185NOK
5% type I error level50.185185185185185NOK
10% type I error level60.222222222222222NOK

\begin{tabular}{lllllllll}
\hline
Meta Analysis of Goldfeld-Quandt test for Heteroskedasticity \tabularnewline
Description & # significant tests & % significant tests & OK/NOK \tabularnewline
1% type I error level & 5 & 0.185185185185185 & NOK \tabularnewline
5% type I error level & 5 & 0.185185185185185 & NOK \tabularnewline
10% type I error level & 6 & 0.222222222222222 & NOK \tabularnewline
\hline
\end{tabular}
%Source: https://freestatistics.org/blog/index.php?pk=102831&T=6

[TABLE]
[ROW][C]Meta Analysis of Goldfeld-Quandt test for Heteroskedasticity[/C][/ROW]
[ROW][C]Description[/C][C]# significant tests[/C][C]% significant tests[/C][C]OK/NOK[/C][/ROW]
[ROW][C]1% type I error level[/C][C]5[/C][C]0.185185185185185[/C][C]NOK[/C][/ROW]
[ROW][C]5% type I error level[/C][C]5[/C][C]0.185185185185185[/C][C]NOK[/C][/ROW]
[ROW][C]10% type I error level[/C][C]6[/C][C]0.222222222222222[/C][C]NOK[/C][/ROW]
[/TABLE]
Source: https://freestatistics.org/blog/index.php?pk=102831&T=6

Globally Unique Identifier (entire table): ba.freestatistics.org/blog/index.php?pk=102831&T=6

As an alternative you can also use a QR Code:  

The GUIDs for individual cells are displayed in the table below:

Meta Analysis of Goldfeld-Quandt test for Heteroskedasticity
Description# significant tests% significant testsOK/NOK
1% type I error level50.185185185185185NOK
5% type I error level50.185185185185185NOK
10% type I error level60.222222222222222NOK


Parameters (Session):
par1 = 1 ; par2 = Include Monthly Dummies ; par3 = Linear Trend ;
Parameters (R input):
par1 = 1 ; par2 = Include Monthly Dummies ; par3 = Linear Trend ;
R code (references can be found in the software module):
library(lattice)
library(lmtest)
n25 <- 25 #minimum number of obs. for Goldfeld-Quandt test
par1 <- as.numeric(par1)
x <- t(y)
k <- length(x[1,])
n <- length(x[,1])
x1 <- cbind(x[,par1], x[,1:k!=par1])
mycolnames <- c(colnames(x)[par1], colnames(x)[1:k!=par1])
colnames(x1) <- mycolnames #colnames(x)[par1]
x <- x1
if (par3 == 'First Differences'){
x2 <- array(0, dim=c(n-1,k), dimnames=list(1:(n-1), paste('(1-B)',colnames(x),sep='')))
for (i in 1:n-1) {
for (j in 1:k) {
x2[i,j] <- x[i+1,j] - x[i,j]
}
}
x <- x2
}
if (par2 == 'Include Monthly Dummies'){
x2 <- array(0, dim=c(n,11), dimnames=list(1:n, paste('M', seq(1:11), sep ='')))
for (i in 1:11){
x2[seq(i,n,12),i] <- 1
}
x <- cbind(x, x2)
}
if (par2 == 'Include Quarterly Dummies'){
x2 <- array(0, dim=c(n,3), dimnames=list(1:n, paste('Q', seq(1:3), sep ='')))
for (i in 1:3){
x2[seq(i,n,4),i] <- 1
}
x <- cbind(x, x2)
}
k <- length(x[1,])
if (par3 == 'Linear Trend'){
x <- cbind(x, c(1:n))
colnames(x)[k+1] <- 't'
}
x
k <- length(x[1,])
df <- as.data.frame(x)
(mylm <- lm(df))
(mysum <- summary(mylm))
if (n > n25) {
kp3 <- k + 3
nmkm3 <- n - k - 3
gqarr <- array(NA, dim=c(nmkm3-kp3+1,3))
numgqtests <- 0
numsignificant1 <- 0
numsignificant5 <- 0
numsignificant10 <- 0
for (mypoint in kp3:nmkm3) {
j <- 0
numgqtests <- numgqtests + 1
for (myalt in c('greater', 'two.sided', 'less')) {
j <- j + 1
gqarr[mypoint-kp3+1,j] <- gqtest(mylm, point=mypoint, alternative=myalt)$p.value
}
if (gqarr[mypoint-kp3+1,2] < 0.01) numsignificant1 <- numsignificant1 + 1
if (gqarr[mypoint-kp3+1,2] < 0.05) numsignificant5 <- numsignificant5 + 1
if (gqarr[mypoint-kp3+1,2] < 0.10) numsignificant10 <- numsignificant10 + 1
}
gqarr
}
bitmap(file='test0.png')
plot(x[,1], type='l', main='Actuals and Interpolation', ylab='value of Actuals and Interpolation (dots)', xlab='time or index')
points(x[,1]-mysum$resid)
grid()
dev.off()
bitmap(file='test1.png')
plot(mysum$resid, type='b', pch=19, main='Residuals', ylab='value of Residuals', xlab='time or index')
grid()
dev.off()
bitmap(file='test2.png')
hist(mysum$resid, main='Residual Histogram', xlab='values of Residuals')
grid()
dev.off()
bitmap(file='test3.png')
densityplot(~mysum$resid,col='black',main='Residual Density Plot', xlab='values of Residuals')
dev.off()
bitmap(file='test4.png')
qqnorm(mysum$resid, main='Residual Normal Q-Q Plot')
qqline(mysum$resid)
grid()
dev.off()
(myerror <- as.ts(mysum$resid))
bitmap(file='test5.png')
dum <- cbind(lag(myerror,k=1),myerror)
dum
dum1 <- dum[2:length(myerror),]
dum1
z <- as.data.frame(dum1)
z
plot(z,main=paste('Residual Lag plot, lowess, and regression line'), ylab='values of Residuals', xlab='lagged values of Residuals')
lines(lowess(z))
abline(lm(z))
grid()
dev.off()
bitmap(file='test6.png')
acf(mysum$resid, lag.max=length(mysum$resid)/2, main='Residual Autocorrelation Function')
grid()
dev.off()
bitmap(file='test7.png')
pacf(mysum$resid, lag.max=length(mysum$resid)/2, main='Residual Partial Autocorrelation Function')
grid()
dev.off()
bitmap(file='test8.png')
opar <- par(mfrow = c(2,2), oma = c(0, 0, 1.1, 0))
plot(mylm, las = 1, sub='Residual Diagnostics')
par(opar)
dev.off()
if (n > n25) {
bitmap(file='test9.png')
plot(kp3:nmkm3,gqarr[,2], main='Goldfeld-Quandt test',ylab='2-sided p-value',xlab='breakpoint')
grid()
dev.off()
}
load(file='createtable')
a<-table.start()
a<-table.row.start(a)
a<-table.element(a, 'Multiple Linear Regression - Estimated Regression Equation', 1, TRUE)
a<-table.row.end(a)
myeq <- colnames(x)[1]
myeq <- paste(myeq, '[t] = ', sep='')
for (i in 1:k){
if (mysum$coefficients[i,1] > 0) myeq <- paste(myeq, '+', '')
myeq <- paste(myeq, mysum$coefficients[i,1], sep=' ')
if (rownames(mysum$coefficients)[i] != '(Intercept)') {
myeq <- paste(myeq, rownames(mysum$coefficients)[i], sep='')
if (rownames(mysum$coefficients)[i] != 't') myeq <- paste(myeq, '[t]', sep='')
}
}
myeq <- paste(myeq, ' + e[t]')
a<-table.row.start(a)
a<-table.element(a, myeq)
a<-table.row.end(a)
a<-table.end(a)
table.save(a,file='mytable1.tab')
a<-table.start()
a<-table.row.start(a)
a<-table.element(a,hyperlink('ols1.htm','Multiple Linear Regression - Ordinary Least Squares',''), 6, TRUE)
a<-table.row.end(a)
a<-table.row.start(a)
a<-table.element(a,'Variable',header=TRUE)
a<-table.element(a,'Parameter',header=TRUE)
a<-table.element(a,'S.D.',header=TRUE)
a<-table.element(a,'T-STAT
H0: parameter = 0',header=TRUE)
a<-table.element(a,'2-tail p-value',header=TRUE)
a<-table.element(a,'1-tail p-value',header=TRUE)
a<-table.row.end(a)
for (i in 1:k){
a<-table.row.start(a)
a<-table.element(a,rownames(mysum$coefficients)[i],header=TRUE)
a<-table.element(a,mysum$coefficients[i,1])
a<-table.element(a, round(mysum$coefficients[i,2],6))
a<-table.element(a, round(mysum$coefficients[i,3],4))
a<-table.element(a, round(mysum$coefficients[i,4],6))
a<-table.element(a, round(mysum$coefficients[i,4]/2,6))
a<-table.row.end(a)
}
a<-table.end(a)
table.save(a,file='mytable2.tab')
a<-table.start()
a<-table.row.start(a)
a<-table.element(a, 'Multiple Linear Regression - Regression Statistics', 2, TRUE)
a<-table.row.end(a)
a<-table.row.start(a)
a<-table.element(a, 'Multiple R',1,TRUE)
a<-table.element(a, sqrt(mysum$r.squared))
a<-table.row.end(a)
a<-table.row.start(a)
a<-table.element(a, 'R-squared',1,TRUE)
a<-table.element(a, mysum$r.squared)
a<-table.row.end(a)
a<-table.row.start(a)
a<-table.element(a, 'Adjusted R-squared',1,TRUE)
a<-table.element(a, mysum$adj.r.squared)
a<-table.row.end(a)
a<-table.row.start(a)
a<-table.element(a, 'F-TEST (value)',1,TRUE)
a<-table.element(a, mysum$fstatistic[1])
a<-table.row.end(a)
a<-table.row.start(a)
a<-table.element(a, 'F-TEST (DF numerator)',1,TRUE)
a<-table.element(a, mysum$fstatistic[2])
a<-table.row.end(a)
a<-table.row.start(a)
a<-table.element(a, 'F-TEST (DF denominator)',1,TRUE)
a<-table.element(a, mysum$fstatistic[3])
a<-table.row.end(a)
a<-table.row.start(a)
a<-table.element(a, 'p-value',1,TRUE)
a<-table.element(a, 1-pf(mysum$fstatistic[1],mysum$fstatistic[2],mysum$fstatistic[3]))
a<-table.row.end(a)
a<-table.row.start(a)
a<-table.element(a, 'Multiple Linear Regression - Residual Statistics', 2, TRUE)
a<-table.row.end(a)
a<-table.row.start(a)
a<-table.element(a, 'Residual Standard Deviation',1,TRUE)
a<-table.element(a, mysum$sigma)
a<-table.row.end(a)
a<-table.row.start(a)
a<-table.element(a, 'Sum Squared Residuals',1,TRUE)
a<-table.element(a, sum(myerror*myerror))
a<-table.row.end(a)
a<-table.end(a)
table.save(a,file='mytable3.tab')
a<-table.start()
a<-table.row.start(a)
a<-table.element(a, 'Multiple Linear Regression - Actuals, Interpolation, and Residuals', 4, TRUE)
a<-table.row.end(a)
a<-table.row.start(a)
a<-table.element(a, 'Time or Index', 1, TRUE)
a<-table.element(a, 'Actuals', 1, TRUE)
a<-table.element(a, 'Interpolation
Forecast', 1, TRUE)
a<-table.element(a, 'Residuals
Prediction Error', 1, TRUE)
a<-table.row.end(a)
for (i in 1:n) {
a<-table.row.start(a)
a<-table.element(a,i, 1, TRUE)
a<-table.element(a,x[i])
a<-table.element(a,x[i]-mysum$resid[i])
a<-table.element(a,mysum$resid[i])
a<-table.row.end(a)
}
a<-table.end(a)
table.save(a,file='mytable4.tab')
if (n > n25) {
a<-table.start()
a<-table.row.start(a)
a<-table.element(a,'Goldfeld-Quandt test for Heteroskedasticity',4,TRUE)
a<-table.row.end(a)
a<-table.row.start(a)
a<-table.element(a,'p-values',header=TRUE)
a<-table.element(a,'Alternative Hypothesis',3,header=TRUE)
a<-table.row.end(a)
a<-table.row.start(a)
a<-table.element(a,'breakpoint index',header=TRUE)
a<-table.element(a,'greater',header=TRUE)
a<-table.element(a,'2-sided',header=TRUE)
a<-table.element(a,'less',header=TRUE)
a<-table.row.end(a)
for (mypoint in kp3:nmkm3) {
a<-table.row.start(a)
a<-table.element(a,mypoint,header=TRUE)
a<-table.element(a,gqarr[mypoint-kp3+1,1])
a<-table.element(a,gqarr[mypoint-kp3+1,2])
a<-table.element(a,gqarr[mypoint-kp3+1,3])
a<-table.row.end(a)
}
a<-table.end(a)
table.save(a,file='mytable5.tab')
a<-table.start()
a<-table.row.start(a)
a<-table.element(a,'Meta Analysis of Goldfeld-Quandt test for Heteroskedasticity',4,TRUE)
a<-table.row.end(a)
a<-table.row.start(a)
a<-table.element(a,'Description',header=TRUE)
a<-table.element(a,'# significant tests',header=TRUE)
a<-table.element(a,'% significant tests',header=TRUE)
a<-table.element(a,'OK/NOK',header=TRUE)
a<-table.row.end(a)
a<-table.row.start(a)
a<-table.element(a,'1% type I error level',header=TRUE)
a<-table.element(a,numsignificant1)
a<-table.element(a,numsignificant1/numgqtests)
if (numsignificant1/numgqtests < 0.01) dum <- 'OK' else dum <- 'NOK'
a<-table.element(a,dum)
a<-table.row.end(a)
a<-table.row.start(a)
a<-table.element(a,'5% type I error level',header=TRUE)
a<-table.element(a,numsignificant5)
a<-table.element(a,numsignificant5/numgqtests)
if (numsignificant5/numgqtests < 0.05) dum <- 'OK' else dum <- 'NOK'
a<-table.element(a,dum)
a<-table.row.end(a)
a<-table.row.start(a)
a<-table.element(a,'10% type I error level',header=TRUE)
a<-table.element(a,numsignificant10)
a<-table.element(a,numsignificant10/numgqtests)
if (numsignificant10/numgqtests < 0.1) dum <- 'OK' else dum <- 'NOK'
a<-table.element(a,dum)
a<-table.row.end(a)
a<-table.end(a)
table.save(a,file='mytable6.tab')
}