Free Statistics

of Irreproducible Research!

Author's title

Author*The author of this computation has been verified*
R Software Modulerwasp_exponentialsmoothing.wasp
Title produced by softwareExponential Smoothing
Date of computationMon, 29 Nov 2010 11:57:52 +0000
Cite this page as followsStatistical Computations at FreeStatistics.org, Office for Research Development and Education, URL https://freestatistics.org/blog/index.php?v=date/2010/Nov/29/t1291031799tbceg7wukliv5bo.htm/, Retrieved Mon, 29 Apr 2024 11:59:38 +0000
Statistical Computations at FreeStatistics.org, Office for Research Development and Education, URL https://freestatistics.org/blog/index.php?pk=102864, Retrieved Mon, 29 Apr 2024 11:59:38 +0000
QR Codes:

Original text written by user:
IsPrivate?No (this computation is public)
User-defined keywords
Estimated Impact169
Family? (F = Feedback message, R = changed R code, M = changed R Module, P = changed Parameters, D = changed Data)
-     [Multiple Regression] [Workshop 8 Regres...] [2010-11-27 09:22:21] [87d60b8864dc39f7ed759c345edfb471]
- RMP   [Spectral Analysis] [Workshop 8 Regres...] [2010-11-27 12:28:23] [87d60b8864dc39f7ed759c345edfb471]
- RMP     [Exponential Smoothing] [Workshop 8 Regres...] [2010-11-27 13:02:33] [87d60b8864dc39f7ed759c345edfb471]
-   P       [Exponential Smoothing] [Workshop 8 Regres...] [2010-11-27 13:15:31] [87d60b8864dc39f7ed759c345edfb471]
- R  D        [Exponential Smoothing] [ws 8 - exponentia...] [2010-11-28 09:11:22] [033eb2749a430605d9b2be7c4aac4a0c]
- R PD            [Exponential Smoothing] [W8-exponentieel s...] [2010-11-29 11:57:52] [6f3869f9d1e39c73f93153f1f7803f84] [Current]
Feedback Forum

Post a new message
Dataseries X:
593
590
580
574
573
573
620
626
620
588
566
557
561
549
532
526
511
499
555
565
542
527
510
514
517
508
493
490
469
478
528
534
518
506
502
516
528
533
536
537
524
536
587
597
581
564
558
575
580
575
563
552
537
545
601


Summary of computational transaction
Raw Inputview raw input (R code)
Raw Outputview raw output of R engine
Computing time2 seconds
R Server'Sir Ronald Aylmer Fisher' @ 193.190.124.24

\begin{tabular}{lllllllll}
\hline
Summary of computational transaction \tabularnewline
Raw Input & view raw input (R code)  \tabularnewline
Raw Output & view raw output of R engine  \tabularnewline
Computing time & 2 seconds \tabularnewline
R Server & 'Sir Ronald Aylmer Fisher' @ 193.190.124.24 \tabularnewline
\hline
\end{tabular}
%Source: https://freestatistics.org/blog/index.php?pk=102864&T=0

[TABLE]
[ROW][C]Summary of computational transaction[/C][/ROW]
[ROW][C]Raw Input[/C][C]view raw input (R code) [/C][/ROW]
[ROW][C]Raw Output[/C][C]view raw output of R engine [/C][/ROW]
[ROW][C]Computing time[/C][C]2 seconds[/C][/ROW]
[ROW][C]R Server[/C][C]'Sir Ronald Aylmer Fisher' @ 193.190.124.24[/C][/ROW]
[/TABLE]
Source: https://freestatistics.org/blog/index.php?pk=102864&T=0

Globally Unique Identifier (entire table): ba.freestatistics.org/blog/index.php?pk=102864&T=0

As an alternative you can also use a QR Code:  

The GUIDs for individual cells are displayed in the table below:

Summary of computational transaction
Raw Inputview raw input (R code)
Raw Outputview raw output of R engine
Computing time2 seconds
R Server'Sir Ronald Aylmer Fisher' @ 193.190.124.24


Estimated Parameters of Exponential Smoothing
ParameterValue
alpha1
beta0
gammaFALSE

\begin{tabular}{lllllllll}
\hline
Estimated Parameters of Exponential Smoothing \tabularnewline
Parameter & Value \tabularnewline
alpha & 1 \tabularnewline
beta & 0 \tabularnewline
gamma & FALSE \tabularnewline
\hline
\end{tabular}
%Source: https://freestatistics.org/blog/index.php?pk=102864&T=1

[TABLE]
[ROW][C]Estimated Parameters of Exponential Smoothing[/C][/ROW]
[ROW][C]Parameter[/C][C]Value[/C][/ROW]
[ROW][C]alpha[/C][C]1[/C][/ROW]
[ROW][C]beta[/C][C]0[/C][/ROW]
[ROW][C]gamma[/C][C]FALSE[/C][/ROW]
[/TABLE]
Source: https://freestatistics.org/blog/index.php?pk=102864&T=1

Globally Unique Identifier (entire table): ba.freestatistics.org/blog/index.php?pk=102864&T=1

As an alternative you can also use a QR Code:  

The GUIDs for individual cells are displayed in the table below:

Estimated Parameters of Exponential Smoothing
ParameterValue
alpha1
beta0
gammaFALSE


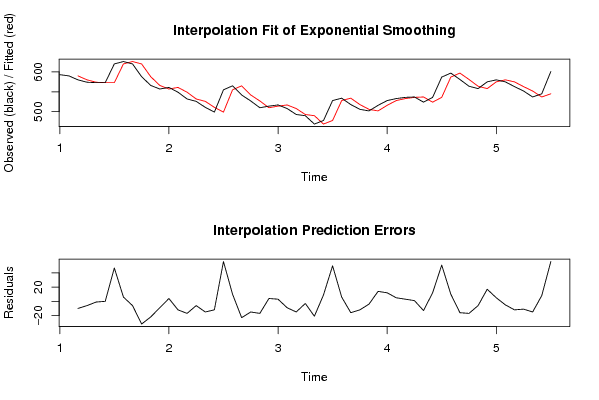
Interpolation Forecasts of Exponential Smoothing
tObservedFittedResiduals
3580590-10
4574580-6
5573574-1
65735730
762057347
86266206
9620626-6
10588620-32
11566588-22
12557566-9
135615574
14549561-12
15532549-17
16526532-6
17511526-15
18499511-12
1955549956
2056555510
21542565-23
22527542-15
23510527-17
245145104
255175143
26508517-9
27493508-15
28490493-3
29469490-21
304784699
3152847850
325345286
33518534-16
34506518-12
35502506-4
3651650214
3752851612
385335285
395365333
405375361
41524537-13
4253652412
4358753651
4459758710
45581597-16
46564581-17
47558564-6
4857555817
495805755
50575580-5
51563575-12
52552563-11
53537552-15
545455378
5560154556

\begin{tabular}{lllllllll}
\hline
Interpolation Forecasts of Exponential Smoothing \tabularnewline
t & Observed & Fitted & Residuals \tabularnewline
3 & 580 & 590 & -10 \tabularnewline
4 & 574 & 580 & -6 \tabularnewline
5 & 573 & 574 & -1 \tabularnewline
6 & 573 & 573 & 0 \tabularnewline
7 & 620 & 573 & 47 \tabularnewline
8 & 626 & 620 & 6 \tabularnewline
9 & 620 & 626 & -6 \tabularnewline
10 & 588 & 620 & -32 \tabularnewline
11 & 566 & 588 & -22 \tabularnewline
12 & 557 & 566 & -9 \tabularnewline
13 & 561 & 557 & 4 \tabularnewline
14 & 549 & 561 & -12 \tabularnewline
15 & 532 & 549 & -17 \tabularnewline
16 & 526 & 532 & -6 \tabularnewline
17 & 511 & 526 & -15 \tabularnewline
18 & 499 & 511 & -12 \tabularnewline
19 & 555 & 499 & 56 \tabularnewline
20 & 565 & 555 & 10 \tabularnewline
21 & 542 & 565 & -23 \tabularnewline
22 & 527 & 542 & -15 \tabularnewline
23 & 510 & 527 & -17 \tabularnewline
24 & 514 & 510 & 4 \tabularnewline
25 & 517 & 514 & 3 \tabularnewline
26 & 508 & 517 & -9 \tabularnewline
27 & 493 & 508 & -15 \tabularnewline
28 & 490 & 493 & -3 \tabularnewline
29 & 469 & 490 & -21 \tabularnewline
30 & 478 & 469 & 9 \tabularnewline
31 & 528 & 478 & 50 \tabularnewline
32 & 534 & 528 & 6 \tabularnewline
33 & 518 & 534 & -16 \tabularnewline
34 & 506 & 518 & -12 \tabularnewline
35 & 502 & 506 & -4 \tabularnewline
36 & 516 & 502 & 14 \tabularnewline
37 & 528 & 516 & 12 \tabularnewline
38 & 533 & 528 & 5 \tabularnewline
39 & 536 & 533 & 3 \tabularnewline
40 & 537 & 536 & 1 \tabularnewline
41 & 524 & 537 & -13 \tabularnewline
42 & 536 & 524 & 12 \tabularnewline
43 & 587 & 536 & 51 \tabularnewline
44 & 597 & 587 & 10 \tabularnewline
45 & 581 & 597 & -16 \tabularnewline
46 & 564 & 581 & -17 \tabularnewline
47 & 558 & 564 & -6 \tabularnewline
48 & 575 & 558 & 17 \tabularnewline
49 & 580 & 575 & 5 \tabularnewline
50 & 575 & 580 & -5 \tabularnewline
51 & 563 & 575 & -12 \tabularnewline
52 & 552 & 563 & -11 \tabularnewline
53 & 537 & 552 & -15 \tabularnewline
54 & 545 & 537 & 8 \tabularnewline
55 & 601 & 545 & 56 \tabularnewline
\hline
\end{tabular}
%Source: https://freestatistics.org/blog/index.php?pk=102864&T=2

[TABLE]
[ROW][C]Interpolation Forecasts of Exponential Smoothing[/C][/ROW]
[ROW][C]t[/C][C]Observed[/C][C]Fitted[/C][C]Residuals[/C][/ROW]
[ROW][C]3[/C][C]580[/C][C]590[/C][C]-10[/C][/ROW]
[ROW][C]4[/C][C]574[/C][C]580[/C][C]-6[/C][/ROW]
[ROW][C]5[/C][C]573[/C][C]574[/C][C]-1[/C][/ROW]
[ROW][C]6[/C][C]573[/C][C]573[/C][C]0[/C][/ROW]
[ROW][C]7[/C][C]620[/C][C]573[/C][C]47[/C][/ROW]
[ROW][C]8[/C][C]626[/C][C]620[/C][C]6[/C][/ROW]
[ROW][C]9[/C][C]620[/C][C]626[/C][C]-6[/C][/ROW]
[ROW][C]10[/C][C]588[/C][C]620[/C][C]-32[/C][/ROW]
[ROW][C]11[/C][C]566[/C][C]588[/C][C]-22[/C][/ROW]
[ROW][C]12[/C][C]557[/C][C]566[/C][C]-9[/C][/ROW]
[ROW][C]13[/C][C]561[/C][C]557[/C][C]4[/C][/ROW]
[ROW][C]14[/C][C]549[/C][C]561[/C][C]-12[/C][/ROW]
[ROW][C]15[/C][C]532[/C][C]549[/C][C]-17[/C][/ROW]
[ROW][C]16[/C][C]526[/C][C]532[/C][C]-6[/C][/ROW]
[ROW][C]17[/C][C]511[/C][C]526[/C][C]-15[/C][/ROW]
[ROW][C]18[/C][C]499[/C][C]511[/C][C]-12[/C][/ROW]
[ROW][C]19[/C][C]555[/C][C]499[/C][C]56[/C][/ROW]
[ROW][C]20[/C][C]565[/C][C]555[/C][C]10[/C][/ROW]
[ROW][C]21[/C][C]542[/C][C]565[/C][C]-23[/C][/ROW]
[ROW][C]22[/C][C]527[/C][C]542[/C][C]-15[/C][/ROW]
[ROW][C]23[/C][C]510[/C][C]527[/C][C]-17[/C][/ROW]
[ROW][C]24[/C][C]514[/C][C]510[/C][C]4[/C][/ROW]
[ROW][C]25[/C][C]517[/C][C]514[/C][C]3[/C][/ROW]
[ROW][C]26[/C][C]508[/C][C]517[/C][C]-9[/C][/ROW]
[ROW][C]27[/C][C]493[/C][C]508[/C][C]-15[/C][/ROW]
[ROW][C]28[/C][C]490[/C][C]493[/C][C]-3[/C][/ROW]
[ROW][C]29[/C][C]469[/C][C]490[/C][C]-21[/C][/ROW]
[ROW][C]30[/C][C]478[/C][C]469[/C][C]9[/C][/ROW]
[ROW][C]31[/C][C]528[/C][C]478[/C][C]50[/C][/ROW]
[ROW][C]32[/C][C]534[/C][C]528[/C][C]6[/C][/ROW]
[ROW][C]33[/C][C]518[/C][C]534[/C][C]-16[/C][/ROW]
[ROW][C]34[/C][C]506[/C][C]518[/C][C]-12[/C][/ROW]
[ROW][C]35[/C][C]502[/C][C]506[/C][C]-4[/C][/ROW]
[ROW][C]36[/C][C]516[/C][C]502[/C][C]14[/C][/ROW]
[ROW][C]37[/C][C]528[/C][C]516[/C][C]12[/C][/ROW]
[ROW][C]38[/C][C]533[/C][C]528[/C][C]5[/C][/ROW]
[ROW][C]39[/C][C]536[/C][C]533[/C][C]3[/C][/ROW]
[ROW][C]40[/C][C]537[/C][C]536[/C][C]1[/C][/ROW]
[ROW][C]41[/C][C]524[/C][C]537[/C][C]-13[/C][/ROW]
[ROW][C]42[/C][C]536[/C][C]524[/C][C]12[/C][/ROW]
[ROW][C]43[/C][C]587[/C][C]536[/C][C]51[/C][/ROW]
[ROW][C]44[/C][C]597[/C][C]587[/C][C]10[/C][/ROW]
[ROW][C]45[/C][C]581[/C][C]597[/C][C]-16[/C][/ROW]
[ROW][C]46[/C][C]564[/C][C]581[/C][C]-17[/C][/ROW]
[ROW][C]47[/C][C]558[/C][C]564[/C][C]-6[/C][/ROW]
[ROW][C]48[/C][C]575[/C][C]558[/C][C]17[/C][/ROW]
[ROW][C]49[/C][C]580[/C][C]575[/C][C]5[/C][/ROW]
[ROW][C]50[/C][C]575[/C][C]580[/C][C]-5[/C][/ROW]
[ROW][C]51[/C][C]563[/C][C]575[/C][C]-12[/C][/ROW]
[ROW][C]52[/C][C]552[/C][C]563[/C][C]-11[/C][/ROW]
[ROW][C]53[/C][C]537[/C][C]552[/C][C]-15[/C][/ROW]
[ROW][C]54[/C][C]545[/C][C]537[/C][C]8[/C][/ROW]
[ROW][C]55[/C][C]601[/C][C]545[/C][C]56[/C][/ROW]
[/TABLE]
Source: https://freestatistics.org/blog/index.php?pk=102864&T=2

Globally Unique Identifier (entire table): ba.freestatistics.org/blog/index.php?pk=102864&T=2

As an alternative you can also use a QR Code:  

The GUIDs for individual cells are displayed in the table below:

Interpolation Forecasts of Exponential Smoothing
tObservedFittedResiduals
3580590-10
4574580-6
5573574-1
65735730
762057347
86266206
9620626-6
10588620-32
11566588-22
12557566-9
135615574
14549561-12
15532549-17
16526532-6
17511526-15
18499511-12
1955549956
2056555510
21542565-23
22527542-15
23510527-17
245145104
255175143
26508517-9
27493508-15
28490493-3
29469490-21
304784699
3152847850
325345286
33518534-16
34506518-12
35502506-4
3651650214
3752851612
385335285
395365333
405375361
41524537-13
4253652412
4358753651
4459758710
45581597-16
46564581-17
47558564-6
4857555817
495805755
50575580-5
51563575-12
52552563-11
53537552-15
545455378
5560154556


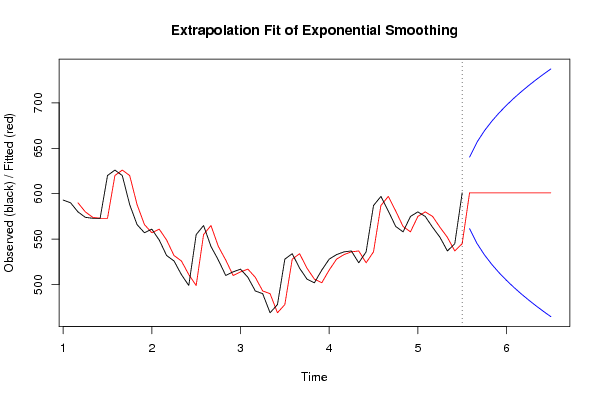
Extrapolation Forecasts of Exponential Smoothing
tForecast95% Lower Bound95% Upper Bound
56601561.658957488336640.341042511664
57601545.363364122109656.636635877891
58601532.859315547071669.140684452929
59601522.317914976672679.682085023328
60601513.030754638211688.969245361789
61601504.634519897283697.365480102717
62601496.913385196118705.086614803882
63601489.726728244217712.273271755783
64601482.976872465009719.023127534991
65601476.592700137631725.407299862369
66601470.52052312739731.47947687261
67601464.718631094142737.281368905858

\begin{tabular}{lllllllll}
\hline
Extrapolation Forecasts of Exponential Smoothing \tabularnewline
t & Forecast & 95% Lower Bound & 95% Upper Bound \tabularnewline
56 & 601 & 561.658957488336 & 640.341042511664 \tabularnewline
57 & 601 & 545.363364122109 & 656.636635877891 \tabularnewline
58 & 601 & 532.859315547071 & 669.140684452929 \tabularnewline
59 & 601 & 522.317914976672 & 679.682085023328 \tabularnewline
60 & 601 & 513.030754638211 & 688.969245361789 \tabularnewline
61 & 601 & 504.634519897283 & 697.365480102717 \tabularnewline
62 & 601 & 496.913385196118 & 705.086614803882 \tabularnewline
63 & 601 & 489.726728244217 & 712.273271755783 \tabularnewline
64 & 601 & 482.976872465009 & 719.023127534991 \tabularnewline
65 & 601 & 476.592700137631 & 725.407299862369 \tabularnewline
66 & 601 & 470.52052312739 & 731.47947687261 \tabularnewline
67 & 601 & 464.718631094142 & 737.281368905858 \tabularnewline
\hline
\end{tabular}
%Source: https://freestatistics.org/blog/index.php?pk=102864&T=3

[TABLE]
[ROW][C]Extrapolation Forecasts of Exponential Smoothing[/C][/ROW]
[ROW][C]t[/C][C]Forecast[/C][C]95% Lower Bound[/C][C]95% Upper Bound[/C][/ROW]
[ROW][C]56[/C][C]601[/C][C]561.658957488336[/C][C]640.341042511664[/C][/ROW]
[ROW][C]57[/C][C]601[/C][C]545.363364122109[/C][C]656.636635877891[/C][/ROW]
[ROW][C]58[/C][C]601[/C][C]532.859315547071[/C][C]669.140684452929[/C][/ROW]
[ROW][C]59[/C][C]601[/C][C]522.317914976672[/C][C]679.682085023328[/C][/ROW]
[ROW][C]60[/C][C]601[/C][C]513.030754638211[/C][C]688.969245361789[/C][/ROW]
[ROW][C]61[/C][C]601[/C][C]504.634519897283[/C][C]697.365480102717[/C][/ROW]
[ROW][C]62[/C][C]601[/C][C]496.913385196118[/C][C]705.086614803882[/C][/ROW]
[ROW][C]63[/C][C]601[/C][C]489.726728244217[/C][C]712.273271755783[/C][/ROW]
[ROW][C]64[/C][C]601[/C][C]482.976872465009[/C][C]719.023127534991[/C][/ROW]
[ROW][C]65[/C][C]601[/C][C]476.592700137631[/C][C]725.407299862369[/C][/ROW]
[ROW][C]66[/C][C]601[/C][C]470.52052312739[/C][C]731.47947687261[/C][/ROW]
[ROW][C]67[/C][C]601[/C][C]464.718631094142[/C][C]737.281368905858[/C][/ROW]
[/TABLE]
Source: https://freestatistics.org/blog/index.php?pk=102864&T=3

Globally Unique Identifier (entire table): ba.freestatistics.org/blog/index.php?pk=102864&T=3

As an alternative you can also use a QR Code:  

The GUIDs for individual cells are displayed in the table below:

Extrapolation Forecasts of Exponential Smoothing
tForecast95% Lower Bound95% Upper Bound
56601561.658957488336640.341042511664
57601545.363364122109656.636635877891
58601532.859315547071669.140684452929
59601522.317914976672679.682085023328
60601513.030754638211688.969245361789
61601504.634519897283697.365480102717
62601496.913385196118705.086614803882
63601489.726728244217712.273271755783
64601482.976872465009719.023127534991
65601476.592700137631725.407299862369
66601470.52052312739731.47947687261
67601464.718631094142737.281368905858


Parameters (Session):
par1 = 12 ; par2 = Double ; par3 = additive ;
Parameters (R input):
par1 = 12 ; par2 = Double ; par3 = additive ;
R code (references can be found in the software module):
par1 <- as.numeric(par1)
if (par2 == 'Single') K <- 1
if (par2 == 'Double') K <- 2
if (par2 == 'Triple') K <- par1
nx <- length(x)
nxmK <- nx - K
x <- ts(x, frequency = par1)
if (par2 == 'Single') fit <- HoltWinters(x, gamma=F, beta=F)
if (par2 == 'Double') fit <- HoltWinters(x, gamma=F)
if (par2 == 'Triple') fit <- HoltWinters(x, seasonal=par3)
fit
myresid <- x - fit$fitted[,'xhat']
bitmap(file='test1.png')
op <- par(mfrow=c(2,1))
plot(fit,ylab='Observed (black) / Fitted (red)',main='Interpolation Fit of Exponential Smoothing')
plot(myresid,ylab='Residuals',main='Interpolation Prediction Errors')
par(op)
dev.off()
bitmap(file='test2.png')
p <- predict(fit, par1, prediction.interval=TRUE)
np <- length(p[,1])
plot(fit,p,ylab='Observed (black) / Fitted (red)',main='Extrapolation Fit of Exponential Smoothing')
dev.off()
bitmap(file='test3.png')
op <- par(mfrow = c(2,2))
acf(as.numeric(myresid),lag.max = nx/2,main='Residual ACF')
spectrum(myresid,main='Residals Periodogram')
cpgram(myresid,main='Residal Cumulative Periodogram')
qqnorm(myresid,main='Residual Normal QQ Plot')
qqline(myresid)
par(op)
dev.off()
load(file='createtable')
a<-table.start()
a<-table.row.start(a)
a<-table.element(a,'Estimated Parameters of Exponential Smoothing',2,TRUE)
a<-table.row.end(a)
a<-table.row.start(a)
a<-table.element(a,'Parameter',header=TRUE)
a<-table.element(a,'Value',header=TRUE)
a<-table.row.end(a)
a<-table.row.start(a)
a<-table.element(a,'alpha',header=TRUE)
a<-table.element(a,fit$alpha)
a<-table.row.end(a)
a<-table.row.start(a)
a<-table.element(a,'beta',header=TRUE)
a<-table.element(a,fit$beta)
a<-table.row.end(a)
a<-table.row.start(a)
a<-table.element(a,'gamma',header=TRUE)
a<-table.element(a,fit$gamma)
a<-table.row.end(a)
a<-table.end(a)
table.save(a,file='mytable.tab')
a<-table.start()
a<-table.row.start(a)
a<-table.element(a,'Interpolation Forecasts of Exponential Smoothing',4,TRUE)
a<-table.row.end(a)
a<-table.row.start(a)
a<-table.element(a,'t',header=TRUE)
a<-table.element(a,'Observed',header=TRUE)
a<-table.element(a,'Fitted',header=TRUE)
a<-table.element(a,'Residuals',header=TRUE)
a<-table.row.end(a)
for (i in 1:nxmK) {
a<-table.row.start(a)
a<-table.element(a,i+K,header=TRUE)
a<-table.element(a,x[i+K])
a<-table.element(a,fit$fitted[i,'xhat'])
a<-table.element(a,myresid[i])
a<-table.row.end(a)
}
a<-table.end(a)
table.save(a,file='mytable1.tab')
a<-table.start()
a<-table.row.start(a)
a<-table.element(a,'Extrapolation Forecasts of Exponential Smoothing',4,TRUE)
a<-table.row.end(a)
a<-table.row.start(a)
a<-table.element(a,'t',header=TRUE)
a<-table.element(a,'Forecast',header=TRUE)
a<-table.element(a,'95% Lower Bound',header=TRUE)
a<-table.element(a,'95% Upper Bound',header=TRUE)
a<-table.row.end(a)
for (i in 1:np) {
a<-table.row.start(a)
a<-table.element(a,nx+i,header=TRUE)
a<-table.element(a,p[i,'fit'])
a<-table.element(a,p[i,'lwr'])
a<-table.element(a,p[i,'upr'])
a<-table.row.end(a)
}
a<-table.end(a)
table.save(a,file='mytable2.tab')