Free Statistics

of Irreproducible Research!

Author's title

Author*The author of this computation has been verified*
R Software Modulerwasp_multipleregression.wasp
Title produced by softwareMultiple Regression
Date of computationMon, 29 Nov 2010 17:19:35 +0000
Cite this page as followsStatistical Computations at FreeStatistics.org, Office for Research Development and Education, URL https://freestatistics.org/blog/index.php?v=date/2010/Nov/29/t1291051198tph0joxcjt9jmbo.htm/, Retrieved Mon, 29 Apr 2024 13:55:17 +0000
Statistical Computations at FreeStatistics.org, Office for Research Development and Education, URL https://freestatistics.org/blog/index.php?pk=102962, Retrieved Mon, 29 Apr 2024 13:55:17 +0000
QR Codes:

Original text written by user:
IsPrivate?No (this computation is public)
User-defined keywords
Estimated Impact179
Family? (F = Feedback message, R = changed R code, M = changed R Module, P = changed Parameters, D = changed Data)
-     [Multiple Regression] [HPC Retail Sales] [2008-03-08 13:40:54] [1c0f2c85e8a48e42648374b3bcceca26]
-  MPD  [Multiple Regression] [ws8 - Regressie a...] [2010-11-27 11:23:58] [4a7069087cf9e0eda253aeed7d8c30d6]
-   PD    [Multiple Regression] [Paper - Regressie...] [2010-11-28 20:06:50] [4a7069087cf9e0eda253aeed7d8c30d6]
-   PD        [Multiple Regression] [Paper - Regressie...] [2010-11-29 17:19:35] [cfd788255f1b1b5389e58d7f218c70bf] [Current]
-    D          [Multiple Regression] [Multiple regressi...] [2010-12-21 16:31:40] [d6a5e6c1b0014d57cedb2bdfb4a7099f]
-   PD          [Multiple Regression] [Multiple regressi...] [2010-12-21 16:57:19] [d6a5e6c1b0014d57cedb2bdfb4a7099f]
-   PD          [Multiple Regression] [Multiple regressi...] [2010-12-21 17:06:28] [d6a5e6c1b0014d57cedb2bdfb4a7099f]
Feedback Forum

Post a new message
Dataseries X:
376.974	0
377.632	0
378.205	0
370.861	0
369.167	0
371.551	0
382.842	0
381.903	0
384.502	0
392.058	0
384.359	0
388.884	0
386.586	0
387.495	0
385.705	0
378.67	0
377.367	0
376.911	0
389.827	0
387.82	0
387.267	0
380.575	0
372.402	0
376.74	0
377.795	0
376.126	0
370.804	0
367.98	0
367.866	0
366.121	0
379.421	0
378.519	0
372.423	0
355.072	0
344.693	0
342.892	0
344.178	0
337.606	0
327.103	0
323.953	0
316.532	0
306.307	0
327.225	0
329.573	0
313.761	0
307.836	0
300.074	0
304.198	0
306.122	0
300.414	0
292.133	0
290.616	0
280.244	1
285.179	1
305.486	1
305.957	1
293.886	1
289.441	1
288.776	1
299.149	1
306.532	1
309.914	1
313.468	1
314.901	1
309.16	1
316.15	1
336.544	1
339.196	1
326.738	1
320.838	1
318.62	1
331.533	1
335.378	1


Summary of computational transaction
Raw Inputview raw input (R code)
Raw Outputview raw output of R engine
Computing time6 seconds
R Server'Sir Ronald Aylmer Fisher' @ 193.190.124.24

\begin{tabular}{lllllllll}
\hline
Summary of computational transaction \tabularnewline
Raw Input & view raw input (R code)  \tabularnewline
Raw Output & view raw output of R engine  \tabularnewline
Computing time & 6 seconds \tabularnewline
R Server & 'Sir Ronald Aylmer Fisher' @ 193.190.124.24 \tabularnewline
\hline
\end{tabular}
%Source: https://freestatistics.org/blog/index.php?pk=102962&T=0

[TABLE]
[ROW][C]Summary of computational transaction[/C][/ROW]
[ROW][C]Raw Input[/C][C]view raw input (R code) [/C][/ROW]
[ROW][C]Raw Output[/C][C]view raw output of R engine [/C][/ROW]
[ROW][C]Computing time[/C][C]6 seconds[/C][/ROW]
[ROW][C]R Server[/C][C]'Sir Ronald Aylmer Fisher' @ 193.190.124.24[/C][/ROW]
[/TABLE]
Source: https://freestatistics.org/blog/index.php?pk=102962&T=0

Globally Unique Identifier (entire table): ba.freestatistics.org/blog/index.php?pk=102962&T=0

As an alternative you can also use a QR Code:  

The GUIDs for individual cells are displayed in the table below:

Summary of computational transaction
Raw Inputview raw input (R code)
Raw Outputview raw output of R engine
Computing time6 seconds
R Server'Sir Ronald Aylmer Fisher' @ 193.190.124.24


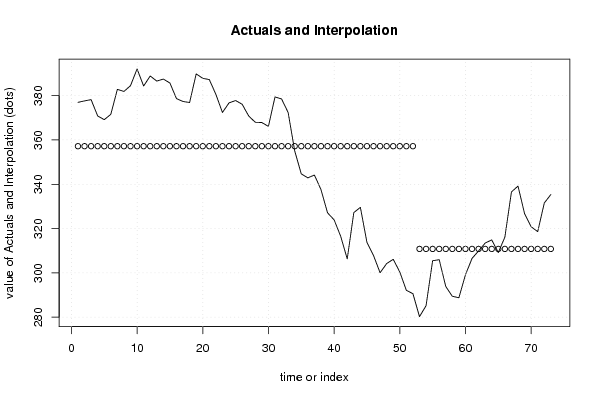
Multiple Linear Regression - Estimated Regression Equation
Maandelijksewerkloosheid[t] = + 357.1855 -46.3716904761905x[t] + e[t]

\begin{tabular}{lllllllll}
\hline
Multiple Linear Regression - Estimated Regression Equation \tabularnewline
Maandelijksewerkloosheid[t] =  +  357.1855 -46.3716904761905x[t]  + e[t] \tabularnewline
\hline
\end{tabular}
%Source: https://freestatistics.org/blog/index.php?pk=102962&T=1

[TABLE]
[ROW][C]Multiple Linear Regression - Estimated Regression Equation[/C][/ROW]
[ROW][C]Maandelijksewerkloosheid[t] =  +  357.1855 -46.3716904761905x[t]  + e[t][/C][/ROW]
[/TABLE]
Source: https://freestatistics.org/blog/index.php?pk=102962&T=1

Globally Unique Identifier (entire table): ba.freestatistics.org/blog/index.php?pk=102962&T=1

As an alternative you can also use a QR Code:  

The GUIDs for individual cells are displayed in the table below:

Multiple Linear Regression - Estimated Regression Equation
Maandelijksewerkloosheid[t] = + 357.1855 -46.3716904761905x[t] + e[t]


Multiple Linear Regression - Ordinary Least Squares
VariableParameterS.D.T-STATH0: parameter = 02-tail p-value1-tail p-value
(Intercept)357.18553.92435791.017600
x-46.37169047619057.316785-6.337700

\begin{tabular}{lllllllll}
\hline
Multiple Linear Regression - Ordinary Least Squares \tabularnewline
Variable & Parameter & S.D. & T-STATH0: parameter = 0 & 2-tail p-value & 1-tail p-value \tabularnewline
(Intercept) & 357.1855 & 3.924357 & 91.0176 & 0 & 0 \tabularnewline
x & -46.3716904761905 & 7.316785 & -6.3377 & 0 & 0 \tabularnewline
\hline
\end{tabular}
%Source: https://freestatistics.org/blog/index.php?pk=102962&T=2

[TABLE]
[ROW][C]Multiple Linear Regression - Ordinary Least Squares[/C][/ROW]
[ROW][C]Variable[/C][C]Parameter[/C][C]S.D.[/C][C]T-STATH0: parameter = 0[/C][C]2-tail p-value[/C][C]1-tail p-value[/C][/ROW]
[ROW][C](Intercept)[/C][C]357.1855[/C][C]3.924357[/C][C]91.0176[/C][C]0[/C][C]0[/C][/ROW]
[ROW][C]x[/C][C]-46.3716904761905[/C][C]7.316785[/C][C]-6.3377[/C][C]0[/C][C]0[/C][/ROW]
[/TABLE]
Source: https://freestatistics.org/blog/index.php?pk=102962&T=2

Globally Unique Identifier (entire table): ba.freestatistics.org/blog/index.php?pk=102962&T=2

As an alternative you can also use a QR Code:  

The GUIDs for individual cells are displayed in the table below:

Multiple Linear Regression - Ordinary Least Squares
VariableParameterS.D.T-STATH0: parameter = 02-tail p-value1-tail p-value
(Intercept)357.18553.92435791.017600
x-46.37169047619057.316785-6.337700


Multiple Linear Regression - Regression Statistics
Multiple R0.60109821573677
R-squared0.361319064961929
Adjusted R-squared0.352323558834632
F-TEST (value)40.1666187370502
F-TEST (DF numerator)1
F-TEST (DF denominator)71
p-value1.87696681530625e-08
Multiple Linear Regression - Residual Statistics
Residual Standard Deviation28.2989407909674
Sum Squared Residuals56858.9335422381

\begin{tabular}{lllllllll}
\hline
Multiple Linear Regression - Regression Statistics \tabularnewline
Multiple R & 0.60109821573677 \tabularnewline
R-squared & 0.361319064961929 \tabularnewline
Adjusted R-squared & 0.352323558834632 \tabularnewline
F-TEST (value) & 40.1666187370502 \tabularnewline
F-TEST (DF numerator) & 1 \tabularnewline
F-TEST (DF denominator) & 71 \tabularnewline
p-value & 1.87696681530625e-08 \tabularnewline
Multiple Linear Regression - Residual Statistics \tabularnewline
Residual Standard Deviation & 28.2989407909674 \tabularnewline
Sum Squared Residuals & 56858.9335422381 \tabularnewline
\hline
\end{tabular}
%Source: https://freestatistics.org/blog/index.php?pk=102962&T=3

[TABLE]
[ROW][C]Multiple Linear Regression - Regression Statistics[/C][/ROW]
[ROW][C]Multiple R[/C][C]0.60109821573677[/C][/ROW]
[ROW][C]R-squared[/C][C]0.361319064961929[/C][/ROW]
[ROW][C]Adjusted R-squared[/C][C]0.352323558834632[/C][/ROW]
[ROW][C]F-TEST (value)[/C][C]40.1666187370502[/C][/ROW]
[ROW][C]F-TEST (DF numerator)[/C][C]1[/C][/ROW]
[ROW][C]F-TEST (DF denominator)[/C][C]71[/C][/ROW]
[ROW][C]p-value[/C][C]1.87696681530625e-08[/C][/ROW]
[ROW][C]Multiple Linear Regression - Residual Statistics[/C][/ROW]
[ROW][C]Residual Standard Deviation[/C][C]28.2989407909674[/C][/ROW]
[ROW][C]Sum Squared Residuals[/C][C]56858.9335422381[/C][/ROW]
[/TABLE]
Source: https://freestatistics.org/blog/index.php?pk=102962&T=3

Globally Unique Identifier (entire table): ba.freestatistics.org/blog/index.php?pk=102962&T=3

As an alternative you can also use a QR Code:  

The GUIDs for individual cells are displayed in the table below:

Multiple Linear Regression - Regression Statistics
Multiple R0.60109821573677
R-squared0.361319064961929
Adjusted R-squared0.352323558834632
F-TEST (value)40.1666187370502
F-TEST (DF numerator)1
F-TEST (DF denominator)71
p-value1.87696681530625e-08
Multiple Linear Regression - Residual Statistics
Residual Standard Deviation28.2989407909674
Sum Squared Residuals56858.9335422381


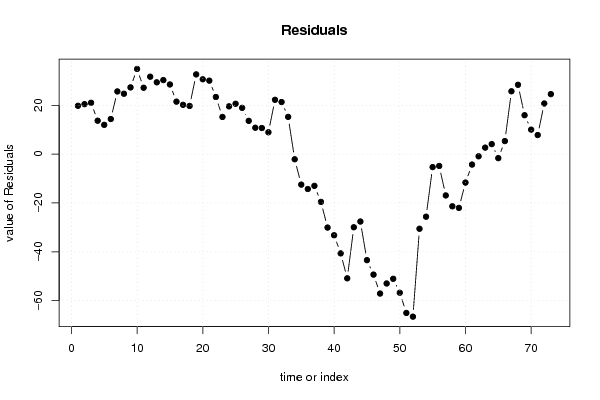
Multiple Linear Regression - Actuals, Interpolation, and Residuals
Time or IndexActualsInterpolationForecastResidualsPrediction Error
1376.974357.185519.7885000000002
2377.632357.185520.4465000000001
3378.205357.185521.0195
4370.861357.185513.6755
5369.167357.185511.9815000000000
6371.551357.185514.3655
7382.842357.185525.6565
8381.903357.185524.7175
9384.502357.185527.3165
10392.058357.185534.8725
11384.359357.185527.1735
12388.884357.185531.6985
13386.586357.185529.4005
14387.495357.185530.3095
15385.705357.185528.5195
16378.67357.185521.4845
17377.367357.185520.1815
18376.911357.185519.7255
19389.827357.185532.6415
20387.82357.185530.6345
21387.267357.185530.0815
22380.575357.185523.3895
23372.402357.185515.2165
24376.74357.185519.5545
25377.795357.185520.6095
26376.126357.185518.9405000000000
27370.804357.185513.6185000000000
28367.98357.185510.7945000000000
29367.866357.185510.6805000000000
30366.121357.18558.93549999999998
31379.421357.185522.2355
32378.519357.185521.3335
33372.423357.185515.2375
34355.072357.1855-2.11350000000000
35344.693357.1855-12.4925000000000
36342.892357.1855-14.2935
37344.178357.1855-13.0075
38337.606357.1855-19.5795
39327.103357.1855-30.0825
40323.953357.1855-33.2325
41316.532357.1855-40.6535
42306.307357.1855-50.8785
43327.225357.1855-29.9605
44329.573357.1855-27.6125
45313.761357.1855-43.4245
46307.836357.1855-49.3495
47300.074357.1855-57.1115
48304.198357.1855-52.9875
49306.122357.1855-51.0635
50300.414357.1855-56.7715
51292.133357.1855-65.0525
52290.616357.1855-66.5695
53280.244310.813809523810-30.5698095238095
54285.179310.813809523810-25.6348095238096
55305.486310.813809523810-5.32780952380954
56305.957310.813809523810-4.85680952380953
57293.886310.813809523810-16.9278095238095
58289.441310.813809523810-21.3728095238096
59288.776310.813809523810-22.0378095238095
60299.149310.813809523810-11.6648095238095
61306.532310.813809523810-4.28180952380954
62309.914310.813809523810-0.89980952380954
63313.468310.8138095238102.65419047619049
64314.901310.8138095238104.08719047619048
65309.16310.813809523810-1.6538095238095
66316.15310.8138095238105.33619047619045
67336.544310.81380952381025.7301904761905
68339.196310.81380952381028.3821904761905
69326.738310.81380952381015.9241904761905
70320.838310.81380952381010.0241904761905
71318.62310.8138095238107.80619047619048
72331.533310.81380952381020.7191904761905
73335.378310.81380952381024.5641904761905

\begin{tabular}{lllllllll}
\hline
Multiple Linear Regression - Actuals, Interpolation, and Residuals \tabularnewline
Time or Index & Actuals & InterpolationForecast & ResidualsPrediction Error \tabularnewline
1 & 376.974 & 357.1855 & 19.7885000000002 \tabularnewline
2 & 377.632 & 357.1855 & 20.4465000000001 \tabularnewline
3 & 378.205 & 357.1855 & 21.0195 \tabularnewline
4 & 370.861 & 357.1855 & 13.6755 \tabularnewline
5 & 369.167 & 357.1855 & 11.9815000000000 \tabularnewline
6 & 371.551 & 357.1855 & 14.3655 \tabularnewline
7 & 382.842 & 357.1855 & 25.6565 \tabularnewline
8 & 381.903 & 357.1855 & 24.7175 \tabularnewline
9 & 384.502 & 357.1855 & 27.3165 \tabularnewline
10 & 392.058 & 357.1855 & 34.8725 \tabularnewline
11 & 384.359 & 357.1855 & 27.1735 \tabularnewline
12 & 388.884 & 357.1855 & 31.6985 \tabularnewline
13 & 386.586 & 357.1855 & 29.4005 \tabularnewline
14 & 387.495 & 357.1855 & 30.3095 \tabularnewline
15 & 385.705 & 357.1855 & 28.5195 \tabularnewline
16 & 378.67 & 357.1855 & 21.4845 \tabularnewline
17 & 377.367 & 357.1855 & 20.1815 \tabularnewline
18 & 376.911 & 357.1855 & 19.7255 \tabularnewline
19 & 389.827 & 357.1855 & 32.6415 \tabularnewline
20 & 387.82 & 357.1855 & 30.6345 \tabularnewline
21 & 387.267 & 357.1855 & 30.0815 \tabularnewline
22 & 380.575 & 357.1855 & 23.3895 \tabularnewline
23 & 372.402 & 357.1855 & 15.2165 \tabularnewline
24 & 376.74 & 357.1855 & 19.5545 \tabularnewline
25 & 377.795 & 357.1855 & 20.6095 \tabularnewline
26 & 376.126 & 357.1855 & 18.9405000000000 \tabularnewline
27 & 370.804 & 357.1855 & 13.6185000000000 \tabularnewline
28 & 367.98 & 357.1855 & 10.7945000000000 \tabularnewline
29 & 367.866 & 357.1855 & 10.6805000000000 \tabularnewline
30 & 366.121 & 357.1855 & 8.93549999999998 \tabularnewline
31 & 379.421 & 357.1855 & 22.2355 \tabularnewline
32 & 378.519 & 357.1855 & 21.3335 \tabularnewline
33 & 372.423 & 357.1855 & 15.2375 \tabularnewline
34 & 355.072 & 357.1855 & -2.11350000000000 \tabularnewline
35 & 344.693 & 357.1855 & -12.4925000000000 \tabularnewline
36 & 342.892 & 357.1855 & -14.2935 \tabularnewline
37 & 344.178 & 357.1855 & -13.0075 \tabularnewline
38 & 337.606 & 357.1855 & -19.5795 \tabularnewline
39 & 327.103 & 357.1855 & -30.0825 \tabularnewline
40 & 323.953 & 357.1855 & -33.2325 \tabularnewline
41 & 316.532 & 357.1855 & -40.6535 \tabularnewline
42 & 306.307 & 357.1855 & -50.8785 \tabularnewline
43 & 327.225 & 357.1855 & -29.9605 \tabularnewline
44 & 329.573 & 357.1855 & -27.6125 \tabularnewline
45 & 313.761 & 357.1855 & -43.4245 \tabularnewline
46 & 307.836 & 357.1855 & -49.3495 \tabularnewline
47 & 300.074 & 357.1855 & -57.1115 \tabularnewline
48 & 304.198 & 357.1855 & -52.9875 \tabularnewline
49 & 306.122 & 357.1855 & -51.0635 \tabularnewline
50 & 300.414 & 357.1855 & -56.7715 \tabularnewline
51 & 292.133 & 357.1855 & -65.0525 \tabularnewline
52 & 290.616 & 357.1855 & -66.5695 \tabularnewline
53 & 280.244 & 310.813809523810 & -30.5698095238095 \tabularnewline
54 & 285.179 & 310.813809523810 & -25.6348095238096 \tabularnewline
55 & 305.486 & 310.813809523810 & -5.32780952380954 \tabularnewline
56 & 305.957 & 310.813809523810 & -4.85680952380953 \tabularnewline
57 & 293.886 & 310.813809523810 & -16.9278095238095 \tabularnewline
58 & 289.441 & 310.813809523810 & -21.3728095238096 \tabularnewline
59 & 288.776 & 310.813809523810 & -22.0378095238095 \tabularnewline
60 & 299.149 & 310.813809523810 & -11.6648095238095 \tabularnewline
61 & 306.532 & 310.813809523810 & -4.28180952380954 \tabularnewline
62 & 309.914 & 310.813809523810 & -0.89980952380954 \tabularnewline
63 & 313.468 & 310.813809523810 & 2.65419047619049 \tabularnewline
64 & 314.901 & 310.813809523810 & 4.08719047619048 \tabularnewline
65 & 309.16 & 310.813809523810 & -1.6538095238095 \tabularnewline
66 & 316.15 & 310.813809523810 & 5.33619047619045 \tabularnewline
67 & 336.544 & 310.813809523810 & 25.7301904761905 \tabularnewline
68 & 339.196 & 310.813809523810 & 28.3821904761905 \tabularnewline
69 & 326.738 & 310.813809523810 & 15.9241904761905 \tabularnewline
70 & 320.838 & 310.813809523810 & 10.0241904761905 \tabularnewline
71 & 318.62 & 310.813809523810 & 7.80619047619048 \tabularnewline
72 & 331.533 & 310.813809523810 & 20.7191904761905 \tabularnewline
73 & 335.378 & 310.813809523810 & 24.5641904761905 \tabularnewline
\hline
\end{tabular}
%Source: https://freestatistics.org/blog/index.php?pk=102962&T=4

[TABLE]
[ROW][C]Multiple Linear Regression - Actuals, Interpolation, and Residuals[/C][/ROW]
[ROW][C]Time or Index[/C][C]Actuals[/C][C]InterpolationForecast[/C][C]ResidualsPrediction Error[/C][/ROW]
[ROW][C]1[/C][C]376.974[/C][C]357.1855[/C][C]19.7885000000002[/C][/ROW]
[ROW][C]2[/C][C]377.632[/C][C]357.1855[/C][C]20.4465000000001[/C][/ROW]
[ROW][C]3[/C][C]378.205[/C][C]357.1855[/C][C]21.0195[/C][/ROW]
[ROW][C]4[/C][C]370.861[/C][C]357.1855[/C][C]13.6755[/C][/ROW]
[ROW][C]5[/C][C]369.167[/C][C]357.1855[/C][C]11.9815000000000[/C][/ROW]
[ROW][C]6[/C][C]371.551[/C][C]357.1855[/C][C]14.3655[/C][/ROW]
[ROW][C]7[/C][C]382.842[/C][C]357.1855[/C][C]25.6565[/C][/ROW]
[ROW][C]8[/C][C]381.903[/C][C]357.1855[/C][C]24.7175[/C][/ROW]
[ROW][C]9[/C][C]384.502[/C][C]357.1855[/C][C]27.3165[/C][/ROW]
[ROW][C]10[/C][C]392.058[/C][C]357.1855[/C][C]34.8725[/C][/ROW]
[ROW][C]11[/C][C]384.359[/C][C]357.1855[/C][C]27.1735[/C][/ROW]
[ROW][C]12[/C][C]388.884[/C][C]357.1855[/C][C]31.6985[/C][/ROW]
[ROW][C]13[/C][C]386.586[/C][C]357.1855[/C][C]29.4005[/C][/ROW]
[ROW][C]14[/C][C]387.495[/C][C]357.1855[/C][C]30.3095[/C][/ROW]
[ROW][C]15[/C][C]385.705[/C][C]357.1855[/C][C]28.5195[/C][/ROW]
[ROW][C]16[/C][C]378.67[/C][C]357.1855[/C][C]21.4845[/C][/ROW]
[ROW][C]17[/C][C]377.367[/C][C]357.1855[/C][C]20.1815[/C][/ROW]
[ROW][C]18[/C][C]376.911[/C][C]357.1855[/C][C]19.7255[/C][/ROW]
[ROW][C]19[/C][C]389.827[/C][C]357.1855[/C][C]32.6415[/C][/ROW]
[ROW][C]20[/C][C]387.82[/C][C]357.1855[/C][C]30.6345[/C][/ROW]
[ROW][C]21[/C][C]387.267[/C][C]357.1855[/C][C]30.0815[/C][/ROW]
[ROW][C]22[/C][C]380.575[/C][C]357.1855[/C][C]23.3895[/C][/ROW]
[ROW][C]23[/C][C]372.402[/C][C]357.1855[/C][C]15.2165[/C][/ROW]
[ROW][C]24[/C][C]376.74[/C][C]357.1855[/C][C]19.5545[/C][/ROW]
[ROW][C]25[/C][C]377.795[/C][C]357.1855[/C][C]20.6095[/C][/ROW]
[ROW][C]26[/C][C]376.126[/C][C]357.1855[/C][C]18.9405000000000[/C][/ROW]
[ROW][C]27[/C][C]370.804[/C][C]357.1855[/C][C]13.6185000000000[/C][/ROW]
[ROW][C]28[/C][C]367.98[/C][C]357.1855[/C][C]10.7945000000000[/C][/ROW]
[ROW][C]29[/C][C]367.866[/C][C]357.1855[/C][C]10.6805000000000[/C][/ROW]
[ROW][C]30[/C][C]366.121[/C][C]357.1855[/C][C]8.93549999999998[/C][/ROW]
[ROW][C]31[/C][C]379.421[/C][C]357.1855[/C][C]22.2355[/C][/ROW]
[ROW][C]32[/C][C]378.519[/C][C]357.1855[/C][C]21.3335[/C][/ROW]
[ROW][C]33[/C][C]372.423[/C][C]357.1855[/C][C]15.2375[/C][/ROW]
[ROW][C]34[/C][C]355.072[/C][C]357.1855[/C][C]-2.11350000000000[/C][/ROW]
[ROW][C]35[/C][C]344.693[/C][C]357.1855[/C][C]-12.4925000000000[/C][/ROW]
[ROW][C]36[/C][C]342.892[/C][C]357.1855[/C][C]-14.2935[/C][/ROW]
[ROW][C]37[/C][C]344.178[/C][C]357.1855[/C][C]-13.0075[/C][/ROW]
[ROW][C]38[/C][C]337.606[/C][C]357.1855[/C][C]-19.5795[/C][/ROW]
[ROW][C]39[/C][C]327.103[/C][C]357.1855[/C][C]-30.0825[/C][/ROW]
[ROW][C]40[/C][C]323.953[/C][C]357.1855[/C][C]-33.2325[/C][/ROW]
[ROW][C]41[/C][C]316.532[/C][C]357.1855[/C][C]-40.6535[/C][/ROW]
[ROW][C]42[/C][C]306.307[/C][C]357.1855[/C][C]-50.8785[/C][/ROW]
[ROW][C]43[/C][C]327.225[/C][C]357.1855[/C][C]-29.9605[/C][/ROW]
[ROW][C]44[/C][C]329.573[/C][C]357.1855[/C][C]-27.6125[/C][/ROW]
[ROW][C]45[/C][C]313.761[/C][C]357.1855[/C][C]-43.4245[/C][/ROW]
[ROW][C]46[/C][C]307.836[/C][C]357.1855[/C][C]-49.3495[/C][/ROW]
[ROW][C]47[/C][C]300.074[/C][C]357.1855[/C][C]-57.1115[/C][/ROW]
[ROW][C]48[/C][C]304.198[/C][C]357.1855[/C][C]-52.9875[/C][/ROW]
[ROW][C]49[/C][C]306.122[/C][C]357.1855[/C][C]-51.0635[/C][/ROW]
[ROW][C]50[/C][C]300.414[/C][C]357.1855[/C][C]-56.7715[/C][/ROW]
[ROW][C]51[/C][C]292.133[/C][C]357.1855[/C][C]-65.0525[/C][/ROW]
[ROW][C]52[/C][C]290.616[/C][C]357.1855[/C][C]-66.5695[/C][/ROW]
[ROW][C]53[/C][C]280.244[/C][C]310.813809523810[/C][C]-30.5698095238095[/C][/ROW]
[ROW][C]54[/C][C]285.179[/C][C]310.813809523810[/C][C]-25.6348095238096[/C][/ROW]
[ROW][C]55[/C][C]305.486[/C][C]310.813809523810[/C][C]-5.32780952380954[/C][/ROW]
[ROW][C]56[/C][C]305.957[/C][C]310.813809523810[/C][C]-4.85680952380953[/C][/ROW]
[ROW][C]57[/C][C]293.886[/C][C]310.813809523810[/C][C]-16.9278095238095[/C][/ROW]
[ROW][C]58[/C][C]289.441[/C][C]310.813809523810[/C][C]-21.3728095238096[/C][/ROW]
[ROW][C]59[/C][C]288.776[/C][C]310.813809523810[/C][C]-22.0378095238095[/C][/ROW]
[ROW][C]60[/C][C]299.149[/C][C]310.813809523810[/C][C]-11.6648095238095[/C][/ROW]
[ROW][C]61[/C][C]306.532[/C][C]310.813809523810[/C][C]-4.28180952380954[/C][/ROW]
[ROW][C]62[/C][C]309.914[/C][C]310.813809523810[/C][C]-0.89980952380954[/C][/ROW]
[ROW][C]63[/C][C]313.468[/C][C]310.813809523810[/C][C]2.65419047619049[/C][/ROW]
[ROW][C]64[/C][C]314.901[/C][C]310.813809523810[/C][C]4.08719047619048[/C][/ROW]
[ROW][C]65[/C][C]309.16[/C][C]310.813809523810[/C][C]-1.6538095238095[/C][/ROW]
[ROW][C]66[/C][C]316.15[/C][C]310.813809523810[/C][C]5.33619047619045[/C][/ROW]
[ROW][C]67[/C][C]336.544[/C][C]310.813809523810[/C][C]25.7301904761905[/C][/ROW]
[ROW][C]68[/C][C]339.196[/C][C]310.813809523810[/C][C]28.3821904761905[/C][/ROW]
[ROW][C]69[/C][C]326.738[/C][C]310.813809523810[/C][C]15.9241904761905[/C][/ROW]
[ROW][C]70[/C][C]320.838[/C][C]310.813809523810[/C][C]10.0241904761905[/C][/ROW]
[ROW][C]71[/C][C]318.62[/C][C]310.813809523810[/C][C]7.80619047619048[/C][/ROW]
[ROW][C]72[/C][C]331.533[/C][C]310.813809523810[/C][C]20.7191904761905[/C][/ROW]
[ROW][C]73[/C][C]335.378[/C][C]310.813809523810[/C][C]24.5641904761905[/C][/ROW]
[/TABLE]
Source: https://freestatistics.org/blog/index.php?pk=102962&T=4

Globally Unique Identifier (entire table): ba.freestatistics.org/blog/index.php?pk=102962&T=4

As an alternative you can also use a QR Code:  

The GUIDs for individual cells are displayed in the table below:

Multiple Linear Regression - Actuals, Interpolation, and Residuals
Time or IndexActualsInterpolationForecastResidualsPrediction Error
1376.974357.185519.7885000000002
2377.632357.185520.4465000000001
3378.205357.185521.0195
4370.861357.185513.6755
5369.167357.185511.9815000000000
6371.551357.185514.3655
7382.842357.185525.6565
8381.903357.185524.7175
9384.502357.185527.3165
10392.058357.185534.8725
11384.359357.185527.1735
12388.884357.185531.6985
13386.586357.185529.4005
14387.495357.185530.3095
15385.705357.185528.5195
16378.67357.185521.4845
17377.367357.185520.1815
18376.911357.185519.7255
19389.827357.185532.6415
20387.82357.185530.6345
21387.267357.185530.0815
22380.575357.185523.3895
23372.402357.185515.2165
24376.74357.185519.5545
25377.795357.185520.6095
26376.126357.185518.9405000000000
27370.804357.185513.6185000000000
28367.98357.185510.7945000000000
29367.866357.185510.6805000000000
30366.121357.18558.93549999999998
31379.421357.185522.2355
32378.519357.185521.3335
33372.423357.185515.2375
34355.072357.1855-2.11350000000000
35344.693357.1855-12.4925000000000
36342.892357.1855-14.2935
37344.178357.1855-13.0075
38337.606357.1855-19.5795
39327.103357.1855-30.0825
40323.953357.1855-33.2325
41316.532357.1855-40.6535
42306.307357.1855-50.8785
43327.225357.1855-29.9605
44329.573357.1855-27.6125
45313.761357.1855-43.4245
46307.836357.1855-49.3495
47300.074357.1855-57.1115
48304.198357.1855-52.9875
49306.122357.1855-51.0635
50300.414357.1855-56.7715
51292.133357.1855-65.0525
52290.616357.1855-66.5695
53280.244310.813809523810-30.5698095238095
54285.179310.813809523810-25.6348095238096
55305.486310.813809523810-5.32780952380954
56305.957310.813809523810-4.85680952380953
57293.886310.813809523810-16.9278095238095
58289.441310.813809523810-21.3728095238096
59288.776310.813809523810-22.0378095238095
60299.149310.813809523810-11.6648095238095
61306.532310.813809523810-4.28180952380954
62309.914310.813809523810-0.89980952380954
63313.468310.8138095238102.65419047619049
64314.901310.8138095238104.08719047619048
65309.16310.813809523810-1.6538095238095
66316.15310.8138095238105.33619047619045
67336.544310.81380952381025.7301904761905
68339.196310.81380952381028.3821904761905
69326.738310.81380952381015.9241904761905
70320.838310.81380952381010.0241904761905
71318.62310.8138095238107.80619047619048
72331.533310.81380952381020.7191904761905
73335.378310.81380952381024.5641904761905


Goldfeld-Quandt test for Heteroskedasticity
p-valuesAlternative Hypothesis
breakpoint indexgreater2-sidedless
50.006535778648470540.01307155729694110.99346422135153
60.001089991757722220.002179983515444450.998910008242278
70.0006434098791835670.001286819758367130.999356590120816
80.0002115499615628070.0004230999231256130.999788450038437
90.0001014367758204330.0002028735516408670.99989856322418
100.0002063868967367770.0004127737934735550.999793613103263
116.9742920760663e-050.0001394858415213260.99993025707924
124.07670977658965e-058.1534195531793e-050.999959232902234
131.62912877976045e-053.2582575595209e-050.999983708712202
147.09474901150016e-061.41894980230003e-050.999992905250988
152.52994810942893e-065.05989621885785e-060.99999747005189
167.46405505106118e-071.49281101021224e-060.999999253594495
172.33180123892811e-074.66360247785622e-070.999999766819876
187.47440480540123e-081.49488096108025e-070.999999925255952
195.9367672857512e-081.18735345715024e-070.999999940632327
203.37780710352867e-086.75561420705733e-080.999999966221929
211.88453556547906e-083.76907113095812e-080.999999981154644
227.23515672911224e-091.44703134582245e-080.999999992764843
235.85269344644566e-091.17053868928913e-080.999999994147307
242.92802957022606e-095.85605914045213e-090.99999999707197
251.50968231256424e-093.01936462512848e-090.999999998490318
269.50968541700463e-101.90193708340093e-090.999999999049031
271.24436126166341e-092.48872252332682e-090.999999998755639
282.65725071715126e-095.31450143430253e-090.99999999734275
295.45130405323965e-091.09026081064793e-080.999999994548696
301.45249758896983e-082.90499517793966e-080.999999985475024
312.6011234374531e-085.2022468749062e-080.999999973988766
327.69640208907057e-081.53928041781411e-070.99999992303598
333.79014060125336e-077.58028120250673e-070.99999962098594
341.62736494071929e-053.25472988143858e-050.999983726350593
350.0009961001708259970.001992200341651990.999003899829174
360.01290086713897970.02580173427795930.98709913286102
370.06332036705868740.1266407341173750.936679632941313
380.2116223872411650.423244774482330.788377612758835
390.4791511394714090.9583022789428180.520848860528591
400.705710468998810.5885790620023810.294289531001190
410.8567120597137930.2865758805724130.143287940286207
420.9429256021635470.1141487956729050.0570743978364526
430.9646471374944030.07070572501119340.0353528625055967
440.9811019003760250.03779619924795080.0188980996239754
450.988463183576330.02307363284733820.0115368164236691
460.9924901071990870.01501978560182600.00750989280091298
470.995029243323540.009941513352921960.00497075667646098
480.995861088641260.008277822717481430.00413891135874071
490.996256567531340.007486864937318830.00374343246865942
500.9964722323468970.007055535306206250.00352776765310313
510.9966409424219890.006718115156022460.00335905757801123
520.9964970078702840.007005984259431360.00350299212971568
530.9977789318578440.004442136284311110.00222106814215555
540.998407763237780.00318447352444160.0015922367622208
550.9971419881062250.005716023787549570.00285801189377478
560.9948674941802170.01026501163956550.00513250581978274
570.9944549261227270.01109014775454670.00554507387727333
580.9963780309968660.007243938006268690.00362196900313434
590.998690824532460.002618350935081080.00130917546754054
600.9990561615821520.001887676835695520.000943838417847759
610.9988224452533520.002355109493296950.00117755474664848
620.9982330550466980.003533889906604560.00176694495330228
630.9967507125683380.0064985748633240.003249287431662
640.993840673529050.01231865294189910.00615932647094957
650.9950435660419980.009912867916003840.00495643395800192
660.993049143534970.01390171293005800.00695085646502898
670.9822026396925010.03559472061499720.0177973603074986
680.9710238662931740.05795226741365140.0289761337068257

\begin{tabular}{lllllllll}
\hline
Goldfeld-Quandt test for Heteroskedasticity \tabularnewline
p-values & Alternative Hypothesis \tabularnewline
breakpoint index & greater & 2-sided & less \tabularnewline
5 & 0.00653577864847054 & 0.0130715572969411 & 0.99346422135153 \tabularnewline
6 & 0.00108999175772222 & 0.00217998351544445 & 0.998910008242278 \tabularnewline
7 & 0.000643409879183567 & 0.00128681975836713 & 0.999356590120816 \tabularnewline
8 & 0.000211549961562807 & 0.000423099923125613 & 0.999788450038437 \tabularnewline
9 & 0.000101436775820433 & 0.000202873551640867 & 0.99989856322418 \tabularnewline
10 & 0.000206386896736777 & 0.000412773793473555 & 0.999793613103263 \tabularnewline
11 & 6.9742920760663e-05 & 0.000139485841521326 & 0.99993025707924 \tabularnewline
12 & 4.07670977658965e-05 & 8.1534195531793e-05 & 0.999959232902234 \tabularnewline
13 & 1.62912877976045e-05 & 3.2582575595209e-05 & 0.999983708712202 \tabularnewline
14 & 7.09474901150016e-06 & 1.41894980230003e-05 & 0.999992905250988 \tabularnewline
15 & 2.52994810942893e-06 & 5.05989621885785e-06 & 0.99999747005189 \tabularnewline
16 & 7.46405505106118e-07 & 1.49281101021224e-06 & 0.999999253594495 \tabularnewline
17 & 2.33180123892811e-07 & 4.66360247785622e-07 & 0.999999766819876 \tabularnewline
18 & 7.47440480540123e-08 & 1.49488096108025e-07 & 0.999999925255952 \tabularnewline
19 & 5.9367672857512e-08 & 1.18735345715024e-07 & 0.999999940632327 \tabularnewline
20 & 3.37780710352867e-08 & 6.75561420705733e-08 & 0.999999966221929 \tabularnewline
21 & 1.88453556547906e-08 & 3.76907113095812e-08 & 0.999999981154644 \tabularnewline
22 & 7.23515672911224e-09 & 1.44703134582245e-08 & 0.999999992764843 \tabularnewline
23 & 5.85269344644566e-09 & 1.17053868928913e-08 & 0.999999994147307 \tabularnewline
24 & 2.92802957022606e-09 & 5.85605914045213e-09 & 0.99999999707197 \tabularnewline
25 & 1.50968231256424e-09 & 3.01936462512848e-09 & 0.999999998490318 \tabularnewline
26 & 9.50968541700463e-10 & 1.90193708340093e-09 & 0.999999999049031 \tabularnewline
27 & 1.24436126166341e-09 & 2.48872252332682e-09 & 0.999999998755639 \tabularnewline
28 & 2.65725071715126e-09 & 5.31450143430253e-09 & 0.99999999734275 \tabularnewline
29 & 5.45130405323965e-09 & 1.09026081064793e-08 & 0.999999994548696 \tabularnewline
30 & 1.45249758896983e-08 & 2.90499517793966e-08 & 0.999999985475024 \tabularnewline
31 & 2.6011234374531e-08 & 5.2022468749062e-08 & 0.999999973988766 \tabularnewline
32 & 7.69640208907057e-08 & 1.53928041781411e-07 & 0.99999992303598 \tabularnewline
33 & 3.79014060125336e-07 & 7.58028120250673e-07 & 0.99999962098594 \tabularnewline
34 & 1.62736494071929e-05 & 3.25472988143858e-05 & 0.999983726350593 \tabularnewline
35 & 0.000996100170825997 & 0.00199220034165199 & 0.999003899829174 \tabularnewline
36 & 0.0129008671389797 & 0.0258017342779593 & 0.98709913286102 \tabularnewline
37 & 0.0633203670586874 & 0.126640734117375 & 0.936679632941313 \tabularnewline
38 & 0.211622387241165 & 0.42324477448233 & 0.788377612758835 \tabularnewline
39 & 0.479151139471409 & 0.958302278942818 & 0.520848860528591 \tabularnewline
40 & 0.70571046899881 & 0.588579062002381 & 0.294289531001190 \tabularnewline
41 & 0.856712059713793 & 0.286575880572413 & 0.143287940286207 \tabularnewline
42 & 0.942925602163547 & 0.114148795672905 & 0.0570743978364526 \tabularnewline
43 & 0.964647137494403 & 0.0707057250111934 & 0.0353528625055967 \tabularnewline
44 & 0.981101900376025 & 0.0377961992479508 & 0.0188980996239754 \tabularnewline
45 & 0.98846318357633 & 0.0230736328473382 & 0.0115368164236691 \tabularnewline
46 & 0.992490107199087 & 0.0150197856018260 & 0.00750989280091298 \tabularnewline
47 & 0.99502924332354 & 0.00994151335292196 & 0.00497075667646098 \tabularnewline
48 & 0.99586108864126 & 0.00827782271748143 & 0.00413891135874071 \tabularnewline
49 & 0.99625656753134 & 0.00748686493731883 & 0.00374343246865942 \tabularnewline
50 & 0.996472232346897 & 0.00705553530620625 & 0.00352776765310313 \tabularnewline
51 & 0.996640942421989 & 0.00671811515602246 & 0.00335905757801123 \tabularnewline
52 & 0.996497007870284 & 0.00700598425943136 & 0.00350299212971568 \tabularnewline
53 & 0.997778931857844 & 0.00444213628431111 & 0.00222106814215555 \tabularnewline
54 & 0.99840776323778 & 0.0031844735244416 & 0.0015922367622208 \tabularnewline
55 & 0.997141988106225 & 0.00571602378754957 & 0.00285801189377478 \tabularnewline
56 & 0.994867494180217 & 0.0102650116395655 & 0.00513250581978274 \tabularnewline
57 & 0.994454926122727 & 0.0110901477545467 & 0.00554507387727333 \tabularnewline
58 & 0.996378030996866 & 0.00724393800626869 & 0.00362196900313434 \tabularnewline
59 & 0.99869082453246 & 0.00261835093508108 & 0.00130917546754054 \tabularnewline
60 & 0.999056161582152 & 0.00188767683569552 & 0.000943838417847759 \tabularnewline
61 & 0.998822445253352 & 0.00235510949329695 & 0.00117755474664848 \tabularnewline
62 & 0.998233055046698 & 0.00353388990660456 & 0.00176694495330228 \tabularnewline
63 & 0.996750712568338 & 0.006498574863324 & 0.003249287431662 \tabularnewline
64 & 0.99384067352905 & 0.0123186529418991 & 0.00615932647094957 \tabularnewline
65 & 0.995043566041998 & 0.00991286791600384 & 0.00495643395800192 \tabularnewline
66 & 0.99304914353497 & 0.0139017129300580 & 0.00695085646502898 \tabularnewline
67 & 0.982202639692501 & 0.0355947206149972 & 0.0177973603074986 \tabularnewline
68 & 0.971023866293174 & 0.0579522674136514 & 0.0289761337068257 \tabularnewline
\hline
\end{tabular}
%Source: https://freestatistics.org/blog/index.php?pk=102962&T=5

[TABLE]
[ROW][C]Goldfeld-Quandt test for Heteroskedasticity[/C][/ROW]
[ROW][C]p-values[/C][C]Alternative Hypothesis[/C][/ROW]
[ROW][C]breakpoint index[/C][C]greater[/C][C]2-sided[/C][C]less[/C][/ROW]
[ROW][C]5[/C][C]0.00653577864847054[/C][C]0.0130715572969411[/C][C]0.99346422135153[/C][/ROW]
[ROW][C]6[/C][C]0.00108999175772222[/C][C]0.00217998351544445[/C][C]0.998910008242278[/C][/ROW]
[ROW][C]7[/C][C]0.000643409879183567[/C][C]0.00128681975836713[/C][C]0.999356590120816[/C][/ROW]
[ROW][C]8[/C][C]0.000211549961562807[/C][C]0.000423099923125613[/C][C]0.999788450038437[/C][/ROW]
[ROW][C]9[/C][C]0.000101436775820433[/C][C]0.000202873551640867[/C][C]0.99989856322418[/C][/ROW]
[ROW][C]10[/C][C]0.000206386896736777[/C][C]0.000412773793473555[/C][C]0.999793613103263[/C][/ROW]
[ROW][C]11[/C][C]6.9742920760663e-05[/C][C]0.000139485841521326[/C][C]0.99993025707924[/C][/ROW]
[ROW][C]12[/C][C]4.07670977658965e-05[/C][C]8.1534195531793e-05[/C][C]0.999959232902234[/C][/ROW]
[ROW][C]13[/C][C]1.62912877976045e-05[/C][C]3.2582575595209e-05[/C][C]0.999983708712202[/C][/ROW]
[ROW][C]14[/C][C]7.09474901150016e-06[/C][C]1.41894980230003e-05[/C][C]0.999992905250988[/C][/ROW]
[ROW][C]15[/C][C]2.52994810942893e-06[/C][C]5.05989621885785e-06[/C][C]0.99999747005189[/C][/ROW]
[ROW][C]16[/C][C]7.46405505106118e-07[/C][C]1.49281101021224e-06[/C][C]0.999999253594495[/C][/ROW]
[ROW][C]17[/C][C]2.33180123892811e-07[/C][C]4.66360247785622e-07[/C][C]0.999999766819876[/C][/ROW]
[ROW][C]18[/C][C]7.47440480540123e-08[/C][C]1.49488096108025e-07[/C][C]0.999999925255952[/C][/ROW]
[ROW][C]19[/C][C]5.9367672857512e-08[/C][C]1.18735345715024e-07[/C][C]0.999999940632327[/C][/ROW]
[ROW][C]20[/C][C]3.37780710352867e-08[/C][C]6.75561420705733e-08[/C][C]0.999999966221929[/C][/ROW]
[ROW][C]21[/C][C]1.88453556547906e-08[/C][C]3.76907113095812e-08[/C][C]0.999999981154644[/C][/ROW]
[ROW][C]22[/C][C]7.23515672911224e-09[/C][C]1.44703134582245e-08[/C][C]0.999999992764843[/C][/ROW]
[ROW][C]23[/C][C]5.85269344644566e-09[/C][C]1.17053868928913e-08[/C][C]0.999999994147307[/C][/ROW]
[ROW][C]24[/C][C]2.92802957022606e-09[/C][C]5.85605914045213e-09[/C][C]0.99999999707197[/C][/ROW]
[ROW][C]25[/C][C]1.50968231256424e-09[/C][C]3.01936462512848e-09[/C][C]0.999999998490318[/C][/ROW]
[ROW][C]26[/C][C]9.50968541700463e-10[/C][C]1.90193708340093e-09[/C][C]0.999999999049031[/C][/ROW]
[ROW][C]27[/C][C]1.24436126166341e-09[/C][C]2.48872252332682e-09[/C][C]0.999999998755639[/C][/ROW]
[ROW][C]28[/C][C]2.65725071715126e-09[/C][C]5.31450143430253e-09[/C][C]0.99999999734275[/C][/ROW]
[ROW][C]29[/C][C]5.45130405323965e-09[/C][C]1.09026081064793e-08[/C][C]0.999999994548696[/C][/ROW]
[ROW][C]30[/C][C]1.45249758896983e-08[/C][C]2.90499517793966e-08[/C][C]0.999999985475024[/C][/ROW]
[ROW][C]31[/C][C]2.6011234374531e-08[/C][C]5.2022468749062e-08[/C][C]0.999999973988766[/C][/ROW]
[ROW][C]32[/C][C]7.69640208907057e-08[/C][C]1.53928041781411e-07[/C][C]0.99999992303598[/C][/ROW]
[ROW][C]33[/C][C]3.79014060125336e-07[/C][C]7.58028120250673e-07[/C][C]0.99999962098594[/C][/ROW]
[ROW][C]34[/C][C]1.62736494071929e-05[/C][C]3.25472988143858e-05[/C][C]0.999983726350593[/C][/ROW]
[ROW][C]35[/C][C]0.000996100170825997[/C][C]0.00199220034165199[/C][C]0.999003899829174[/C][/ROW]
[ROW][C]36[/C][C]0.0129008671389797[/C][C]0.0258017342779593[/C][C]0.98709913286102[/C][/ROW]
[ROW][C]37[/C][C]0.0633203670586874[/C][C]0.126640734117375[/C][C]0.936679632941313[/C][/ROW]
[ROW][C]38[/C][C]0.211622387241165[/C][C]0.42324477448233[/C][C]0.788377612758835[/C][/ROW]
[ROW][C]39[/C][C]0.479151139471409[/C][C]0.958302278942818[/C][C]0.520848860528591[/C][/ROW]
[ROW][C]40[/C][C]0.70571046899881[/C][C]0.588579062002381[/C][C]0.294289531001190[/C][/ROW]
[ROW][C]41[/C][C]0.856712059713793[/C][C]0.286575880572413[/C][C]0.143287940286207[/C][/ROW]
[ROW][C]42[/C][C]0.942925602163547[/C][C]0.114148795672905[/C][C]0.0570743978364526[/C][/ROW]
[ROW][C]43[/C][C]0.964647137494403[/C][C]0.0707057250111934[/C][C]0.0353528625055967[/C][/ROW]
[ROW][C]44[/C][C]0.981101900376025[/C][C]0.0377961992479508[/C][C]0.0188980996239754[/C][/ROW]
[ROW][C]45[/C][C]0.98846318357633[/C][C]0.0230736328473382[/C][C]0.0115368164236691[/C][/ROW]
[ROW][C]46[/C][C]0.992490107199087[/C][C]0.0150197856018260[/C][C]0.00750989280091298[/C][/ROW]
[ROW][C]47[/C][C]0.99502924332354[/C][C]0.00994151335292196[/C][C]0.00497075667646098[/C][/ROW]
[ROW][C]48[/C][C]0.99586108864126[/C][C]0.00827782271748143[/C][C]0.00413891135874071[/C][/ROW]
[ROW][C]49[/C][C]0.99625656753134[/C][C]0.00748686493731883[/C][C]0.00374343246865942[/C][/ROW]
[ROW][C]50[/C][C]0.996472232346897[/C][C]0.00705553530620625[/C][C]0.00352776765310313[/C][/ROW]
[ROW][C]51[/C][C]0.996640942421989[/C][C]0.00671811515602246[/C][C]0.00335905757801123[/C][/ROW]
[ROW][C]52[/C][C]0.996497007870284[/C][C]0.00700598425943136[/C][C]0.00350299212971568[/C][/ROW]
[ROW][C]53[/C][C]0.997778931857844[/C][C]0.00444213628431111[/C][C]0.00222106814215555[/C][/ROW]
[ROW][C]54[/C][C]0.99840776323778[/C][C]0.0031844735244416[/C][C]0.0015922367622208[/C][/ROW]
[ROW][C]55[/C][C]0.997141988106225[/C][C]0.00571602378754957[/C][C]0.00285801189377478[/C][/ROW]
[ROW][C]56[/C][C]0.994867494180217[/C][C]0.0102650116395655[/C][C]0.00513250581978274[/C][/ROW]
[ROW][C]57[/C][C]0.994454926122727[/C][C]0.0110901477545467[/C][C]0.00554507387727333[/C][/ROW]
[ROW][C]58[/C][C]0.996378030996866[/C][C]0.00724393800626869[/C][C]0.00362196900313434[/C][/ROW]
[ROW][C]59[/C][C]0.99869082453246[/C][C]0.00261835093508108[/C][C]0.00130917546754054[/C][/ROW]
[ROW][C]60[/C][C]0.999056161582152[/C][C]0.00188767683569552[/C][C]0.000943838417847759[/C][/ROW]
[ROW][C]61[/C][C]0.998822445253352[/C][C]0.00235510949329695[/C][C]0.00117755474664848[/C][/ROW]
[ROW][C]62[/C][C]0.998233055046698[/C][C]0.00353388990660456[/C][C]0.00176694495330228[/C][/ROW]
[ROW][C]63[/C][C]0.996750712568338[/C][C]0.006498574863324[/C][C]0.003249287431662[/C][/ROW]
[ROW][C]64[/C][C]0.99384067352905[/C][C]0.0123186529418991[/C][C]0.00615932647094957[/C][/ROW]
[ROW][C]65[/C][C]0.995043566041998[/C][C]0.00991286791600384[/C][C]0.00495643395800192[/C][/ROW]
[ROW][C]66[/C][C]0.99304914353497[/C][C]0.0139017129300580[/C][C]0.00695085646502898[/C][/ROW]
[ROW][C]67[/C][C]0.982202639692501[/C][C]0.0355947206149972[/C][C]0.0177973603074986[/C][/ROW]
[ROW][C]68[/C][C]0.971023866293174[/C][C]0.0579522674136514[/C][C]0.0289761337068257[/C][/ROW]
[/TABLE]
Source: https://freestatistics.org/blog/index.php?pk=102962&T=5

Globally Unique Identifier (entire table): ba.freestatistics.org/blog/index.php?pk=102962&T=5

As an alternative you can also use a QR Code:  

The GUIDs for individual cells are displayed in the table below:

Goldfeld-Quandt test for Heteroskedasticity
p-valuesAlternative Hypothesis
breakpoint indexgreater2-sidedless
50.006535778648470540.01307155729694110.99346422135153
60.001089991757722220.002179983515444450.998910008242278
70.0006434098791835670.001286819758367130.999356590120816
80.0002115499615628070.0004230999231256130.999788450038437
90.0001014367758204330.0002028735516408670.99989856322418
100.0002063868967367770.0004127737934735550.999793613103263
116.9742920760663e-050.0001394858415213260.99993025707924
124.07670977658965e-058.1534195531793e-050.999959232902234
131.62912877976045e-053.2582575595209e-050.999983708712202
147.09474901150016e-061.41894980230003e-050.999992905250988
152.52994810942893e-065.05989621885785e-060.99999747005189
167.46405505106118e-071.49281101021224e-060.999999253594495
172.33180123892811e-074.66360247785622e-070.999999766819876
187.47440480540123e-081.49488096108025e-070.999999925255952
195.9367672857512e-081.18735345715024e-070.999999940632327
203.37780710352867e-086.75561420705733e-080.999999966221929
211.88453556547906e-083.76907113095812e-080.999999981154644
227.23515672911224e-091.44703134582245e-080.999999992764843
235.85269344644566e-091.17053868928913e-080.999999994147307
242.92802957022606e-095.85605914045213e-090.99999999707197
251.50968231256424e-093.01936462512848e-090.999999998490318
269.50968541700463e-101.90193708340093e-090.999999999049031
271.24436126166341e-092.48872252332682e-090.999999998755639
282.65725071715126e-095.31450143430253e-090.99999999734275
295.45130405323965e-091.09026081064793e-080.999999994548696
301.45249758896983e-082.90499517793966e-080.999999985475024
312.6011234374531e-085.2022468749062e-080.999999973988766
327.69640208907057e-081.53928041781411e-070.99999992303598
333.79014060125336e-077.58028120250673e-070.99999962098594
341.62736494071929e-053.25472988143858e-050.999983726350593
350.0009961001708259970.001992200341651990.999003899829174
360.01290086713897970.02580173427795930.98709913286102
370.06332036705868740.1266407341173750.936679632941313
380.2116223872411650.423244774482330.788377612758835
390.4791511394714090.9583022789428180.520848860528591
400.705710468998810.5885790620023810.294289531001190
410.8567120597137930.2865758805724130.143287940286207
420.9429256021635470.1141487956729050.0570743978364526
430.9646471374944030.07070572501119340.0353528625055967
440.9811019003760250.03779619924795080.0188980996239754
450.988463183576330.02307363284733820.0115368164236691
460.9924901071990870.01501978560182600.00750989280091298
470.995029243323540.009941513352921960.00497075667646098
480.995861088641260.008277822717481430.00413891135874071
490.996256567531340.007486864937318830.00374343246865942
500.9964722323468970.007055535306206250.00352776765310313
510.9966409424219890.006718115156022460.00335905757801123
520.9964970078702840.007005984259431360.00350299212971568
530.9977789318578440.004442136284311110.00222106814215555
540.998407763237780.00318447352444160.0015922367622208
550.9971419881062250.005716023787549570.00285801189377478
560.9948674941802170.01026501163956550.00513250581978274
570.9944549261227270.01109014775454670.00554507387727333
580.9963780309968660.007243938006268690.00362196900313434
590.998690824532460.002618350935081080.00130917546754054
600.9990561615821520.001887676835695520.000943838417847759
610.9988224452533520.002355109493296950.00117755474664848
620.9982330550466980.003533889906604560.00176694495330228
630.9967507125683380.0064985748633240.003249287431662
640.993840673529050.01231865294189910.00615932647094957
650.9950435660419980.009912867916003840.00495643395800192
660.993049143534970.01390171293005800.00695085646502898
670.9822026396925010.03559472061499720.0177973603074986
680.9710238662931740.05795226741365140.0289761337068257


Meta Analysis of Goldfeld-Quandt test for Heteroskedasticity
Description# significant tests% significant testsOK/NOK
1% type I error level460.71875NOK
5% type I error level560.875NOK
10% type I error level580.90625NOK

\begin{tabular}{lllllllll}
\hline
Meta Analysis of Goldfeld-Quandt test for Heteroskedasticity \tabularnewline
Description & # significant tests & % significant tests & OK/NOK \tabularnewline
1% type I error level & 46 & 0.71875 & NOK \tabularnewline
5% type I error level & 56 & 0.875 & NOK \tabularnewline
10% type I error level & 58 & 0.90625 & NOK \tabularnewline
\hline
\end{tabular}
%Source: https://freestatistics.org/blog/index.php?pk=102962&T=6

[TABLE]
[ROW][C]Meta Analysis of Goldfeld-Quandt test for Heteroskedasticity[/C][/ROW]
[ROW][C]Description[/C][C]# significant tests[/C][C]% significant tests[/C][C]OK/NOK[/C][/ROW]
[ROW][C]1% type I error level[/C][C]46[/C][C]0.71875[/C][C]NOK[/C][/ROW]
[ROW][C]5% type I error level[/C][C]56[/C][C]0.875[/C][C]NOK[/C][/ROW]
[ROW][C]10% type I error level[/C][C]58[/C][C]0.90625[/C][C]NOK[/C][/ROW]
[/TABLE]
Source: https://freestatistics.org/blog/index.php?pk=102962&T=6

Globally Unique Identifier (entire table): ba.freestatistics.org/blog/index.php?pk=102962&T=6

As an alternative you can also use a QR Code:  

The GUIDs for individual cells are displayed in the table below:

Meta Analysis of Goldfeld-Quandt test for Heteroskedasticity
Description# significant tests% significant testsOK/NOK
1% type I error level460.71875NOK
5% type I error level560.875NOK
10% type I error level580.90625NOK


Parameters (Session):
par1 = 1 ; par2 = Do not include Seasonal Dummies ; par3 = No Linear Trend ;
Parameters (R input):
par1 = 1 ; par2 = Do not include Seasonal Dummies ; par3 = No Linear Trend ;
R code (references can be found in the software module):
library(lattice)
library(lmtest)
n25 <- 25 #minimum number of obs. for Goldfeld-Quandt test
par1 <- as.numeric(par1)
x <- t(y)
k <- length(x[1,])
n <- length(x[,1])
x1 <- cbind(x[,par1], x[,1:k!=par1])
mycolnames <- c(colnames(x)[par1], colnames(x)[1:k!=par1])
colnames(x1) <- mycolnames #colnames(x)[par1]
x <- x1
if (par3 == 'First Differences'){
x2 <- array(0, dim=c(n-1,k), dimnames=list(1:(n-1), paste('(1-B)',colnames(x),sep='')))
for (i in 1:n-1) {
for (j in 1:k) {
x2[i,j] <- x[i+1,j] - x[i,j]
}
}
x <- x2
}
if (par2 == 'Include Monthly Dummies'){
x2 <- array(0, dim=c(n,11), dimnames=list(1:n, paste('M', seq(1:11), sep ='')))
for (i in 1:11){
x2[seq(i,n,12),i] <- 1
}
x <- cbind(x, x2)
}
if (par2 == 'Include Quarterly Dummies'){
x2 <- array(0, dim=c(n,3), dimnames=list(1:n, paste('Q', seq(1:3), sep ='')))
for (i in 1:3){
x2[seq(i,n,4),i] <- 1
}
x <- cbind(x, x2)
}
k <- length(x[1,])
if (par3 == 'Linear Trend'){
x <- cbind(x, c(1:n))
colnames(x)[k+1] <- 't'
}
x
k <- length(x[1,])
df <- as.data.frame(x)
(mylm <- lm(df))
(mysum <- summary(mylm))
if (n > n25) {
kp3 <- k + 3
nmkm3 <- n - k - 3
gqarr <- array(NA, dim=c(nmkm3-kp3+1,3))
numgqtests <- 0
numsignificant1 <- 0
numsignificant5 <- 0
numsignificant10 <- 0
for (mypoint in kp3:nmkm3) {
j <- 0
numgqtests <- numgqtests + 1
for (myalt in c('greater', 'two.sided', 'less')) {
j <- j + 1
gqarr[mypoint-kp3+1,j] <- gqtest(mylm, point=mypoint, alternative=myalt)$p.value
}
if (gqarr[mypoint-kp3+1,2] < 0.01) numsignificant1 <- numsignificant1 + 1
if (gqarr[mypoint-kp3+1,2] < 0.05) numsignificant5 <- numsignificant5 + 1
if (gqarr[mypoint-kp3+1,2] < 0.10) numsignificant10 <- numsignificant10 + 1
}
gqarr
}
bitmap(file='test0.png')
plot(x[,1], type='l', main='Actuals and Interpolation', ylab='value of Actuals and Interpolation (dots)', xlab='time or index')
points(x[,1]-mysum$resid)
grid()
dev.off()
bitmap(file='test1.png')
plot(mysum$resid, type='b', pch=19, main='Residuals', ylab='value of Residuals', xlab='time or index')
grid()
dev.off()
bitmap(file='test2.png')
hist(mysum$resid, main='Residual Histogram', xlab='values of Residuals')
grid()
dev.off()
bitmap(file='test3.png')
densityplot(~mysum$resid,col='black',main='Residual Density Plot', xlab='values of Residuals')
dev.off()
bitmap(file='test4.png')
qqnorm(mysum$resid, main='Residual Normal Q-Q Plot')
qqline(mysum$resid)
grid()
dev.off()
(myerror <- as.ts(mysum$resid))
bitmap(file='test5.png')
dum <- cbind(lag(myerror,k=1),myerror)
dum
dum1 <- dum[2:length(myerror),]
dum1
z <- as.data.frame(dum1)
z
plot(z,main=paste('Residual Lag plot, lowess, and regression line'), ylab='values of Residuals', xlab='lagged values of Residuals')
lines(lowess(z))
abline(lm(z))
grid()
dev.off()
bitmap(file='test6.png')
acf(mysum$resid, lag.max=length(mysum$resid)/2, main='Residual Autocorrelation Function')
grid()
dev.off()
bitmap(file='test7.png')
pacf(mysum$resid, lag.max=length(mysum$resid)/2, main='Residual Partial Autocorrelation Function')
grid()
dev.off()
bitmap(file='test8.png')
opar <- par(mfrow = c(2,2), oma = c(0, 0, 1.1, 0))
plot(mylm, las = 1, sub='Residual Diagnostics')
par(opar)
dev.off()
if (n > n25) {
bitmap(file='test9.png')
plot(kp3:nmkm3,gqarr[,2], main='Goldfeld-Quandt test',ylab='2-sided p-value',xlab='breakpoint')
grid()
dev.off()
}
load(file='createtable')
a<-table.start()
a<-table.row.start(a)
a<-table.element(a, 'Multiple Linear Regression - Estimated Regression Equation', 1, TRUE)
a<-table.row.end(a)
myeq <- colnames(x)[1]
myeq <- paste(myeq, '[t] = ', sep='')
for (i in 1:k){
if (mysum$coefficients[i,1] > 0) myeq <- paste(myeq, '+', '')
myeq <- paste(myeq, mysum$coefficients[i,1], sep=' ')
if (rownames(mysum$coefficients)[i] != '(Intercept)') {
myeq <- paste(myeq, rownames(mysum$coefficients)[i], sep='')
if (rownames(mysum$coefficients)[i] != 't') myeq <- paste(myeq, '[t]', sep='')
}
}
myeq <- paste(myeq, ' + e[t]')
a<-table.row.start(a)
a<-table.element(a, myeq)
a<-table.row.end(a)
a<-table.end(a)
table.save(a,file='mytable1.tab')
a<-table.start()
a<-table.row.start(a)
a<-table.element(a,hyperlink('ols1.htm','Multiple Linear Regression - Ordinary Least Squares',''), 6, TRUE)
a<-table.row.end(a)
a<-table.row.start(a)
a<-table.element(a,'Variable',header=TRUE)
a<-table.element(a,'Parameter',header=TRUE)
a<-table.element(a,'S.D.',header=TRUE)
a<-table.element(a,'T-STAT
H0: parameter = 0',header=TRUE)
a<-table.element(a,'2-tail p-value',header=TRUE)
a<-table.element(a,'1-tail p-value',header=TRUE)
a<-table.row.end(a)
for (i in 1:k){
a<-table.row.start(a)
a<-table.element(a,rownames(mysum$coefficients)[i],header=TRUE)
a<-table.element(a,mysum$coefficients[i,1])
a<-table.element(a, round(mysum$coefficients[i,2],6))
a<-table.element(a, round(mysum$coefficients[i,3],4))
a<-table.element(a, round(mysum$coefficients[i,4],6))
a<-table.element(a, round(mysum$coefficients[i,4]/2,6))
a<-table.row.end(a)
}
a<-table.end(a)
table.save(a,file='mytable2.tab')
a<-table.start()
a<-table.row.start(a)
a<-table.element(a, 'Multiple Linear Regression - Regression Statistics', 2, TRUE)
a<-table.row.end(a)
a<-table.row.start(a)
a<-table.element(a, 'Multiple R',1,TRUE)
a<-table.element(a, sqrt(mysum$r.squared))
a<-table.row.end(a)
a<-table.row.start(a)
a<-table.element(a, 'R-squared',1,TRUE)
a<-table.element(a, mysum$r.squared)
a<-table.row.end(a)
a<-table.row.start(a)
a<-table.element(a, 'Adjusted R-squared',1,TRUE)
a<-table.element(a, mysum$adj.r.squared)
a<-table.row.end(a)
a<-table.row.start(a)
a<-table.element(a, 'F-TEST (value)',1,TRUE)
a<-table.element(a, mysum$fstatistic[1])
a<-table.row.end(a)
a<-table.row.start(a)
a<-table.element(a, 'F-TEST (DF numerator)',1,TRUE)
a<-table.element(a, mysum$fstatistic[2])
a<-table.row.end(a)
a<-table.row.start(a)
a<-table.element(a, 'F-TEST (DF denominator)',1,TRUE)
a<-table.element(a, mysum$fstatistic[3])
a<-table.row.end(a)
a<-table.row.start(a)
a<-table.element(a, 'p-value',1,TRUE)
a<-table.element(a, 1-pf(mysum$fstatistic[1],mysum$fstatistic[2],mysum$fstatistic[3]))
a<-table.row.end(a)
a<-table.row.start(a)
a<-table.element(a, 'Multiple Linear Regression - Residual Statistics', 2, TRUE)
a<-table.row.end(a)
a<-table.row.start(a)
a<-table.element(a, 'Residual Standard Deviation',1,TRUE)
a<-table.element(a, mysum$sigma)
a<-table.row.end(a)
a<-table.row.start(a)
a<-table.element(a, 'Sum Squared Residuals',1,TRUE)
a<-table.element(a, sum(myerror*myerror))
a<-table.row.end(a)
a<-table.end(a)
table.save(a,file='mytable3.tab')
a<-table.start()
a<-table.row.start(a)
a<-table.element(a, 'Multiple Linear Regression - Actuals, Interpolation, and Residuals', 4, TRUE)
a<-table.row.end(a)
a<-table.row.start(a)
a<-table.element(a, 'Time or Index', 1, TRUE)
a<-table.element(a, 'Actuals', 1, TRUE)
a<-table.element(a, 'Interpolation
Forecast', 1, TRUE)
a<-table.element(a, 'Residuals
Prediction Error', 1, TRUE)
a<-table.row.end(a)
for (i in 1:n) {
a<-table.row.start(a)
a<-table.element(a,i, 1, TRUE)
a<-table.element(a,x[i])
a<-table.element(a,x[i]-mysum$resid[i])
a<-table.element(a,mysum$resid[i])
a<-table.row.end(a)
}
a<-table.end(a)
table.save(a,file='mytable4.tab')
if (n > n25) {
a<-table.start()
a<-table.row.start(a)
a<-table.element(a,'Goldfeld-Quandt test for Heteroskedasticity',4,TRUE)
a<-table.row.end(a)
a<-table.row.start(a)
a<-table.element(a,'p-values',header=TRUE)
a<-table.element(a,'Alternative Hypothesis',3,header=TRUE)
a<-table.row.end(a)
a<-table.row.start(a)
a<-table.element(a,'breakpoint index',header=TRUE)
a<-table.element(a,'greater',header=TRUE)
a<-table.element(a,'2-sided',header=TRUE)
a<-table.element(a,'less',header=TRUE)
a<-table.row.end(a)
for (mypoint in kp3:nmkm3) {
a<-table.row.start(a)
a<-table.element(a,mypoint,header=TRUE)
a<-table.element(a,gqarr[mypoint-kp3+1,1])
a<-table.element(a,gqarr[mypoint-kp3+1,2])
a<-table.element(a,gqarr[mypoint-kp3+1,3])
a<-table.row.end(a)
}
a<-table.end(a)
table.save(a,file='mytable5.tab')
a<-table.start()
a<-table.row.start(a)
a<-table.element(a,'Meta Analysis of Goldfeld-Quandt test for Heteroskedasticity',4,TRUE)
a<-table.row.end(a)
a<-table.row.start(a)
a<-table.element(a,'Description',header=TRUE)
a<-table.element(a,'# significant tests',header=TRUE)
a<-table.element(a,'% significant tests',header=TRUE)
a<-table.element(a,'OK/NOK',header=TRUE)
a<-table.row.end(a)
a<-table.row.start(a)
a<-table.element(a,'1% type I error level',header=TRUE)
a<-table.element(a,numsignificant1)
a<-table.element(a,numsignificant1/numgqtests)
if (numsignificant1/numgqtests < 0.01) dum <- 'OK' else dum <- 'NOK'
a<-table.element(a,dum)
a<-table.row.end(a)
a<-table.row.start(a)
a<-table.element(a,'5% type I error level',header=TRUE)
a<-table.element(a,numsignificant5)
a<-table.element(a,numsignificant5/numgqtests)
if (numsignificant5/numgqtests < 0.05) dum <- 'OK' else dum <- 'NOK'
a<-table.element(a,dum)
a<-table.row.end(a)
a<-table.row.start(a)
a<-table.element(a,'10% type I error level',header=TRUE)
a<-table.element(a,numsignificant10)
a<-table.element(a,numsignificant10/numgqtests)
if (numsignificant10/numgqtests < 0.1) dum <- 'OK' else dum <- 'NOK'
a<-table.element(a,dum)
a<-table.row.end(a)
a<-table.end(a)
table.save(a,file='mytable6.tab')
}