Free Statistics
of Irreproducible Research!
Description of Statistical Computation | |||||||||||||||||||||||||||||||||||||||||
|---|---|---|---|---|---|---|---|---|---|---|---|---|---|---|---|---|---|---|---|---|---|---|---|---|---|---|---|---|---|---|---|---|---|---|---|---|---|---|---|---|---|
| Author's title | |||||||||||||||||||||||||||||||||||||||||
| Author | *Unverified author* | ||||||||||||||||||||||||||||||||||||||||
| R Software Module | rwasp_univariatedataseries.wasp | ||||||||||||||||||||||||||||||||||||||||
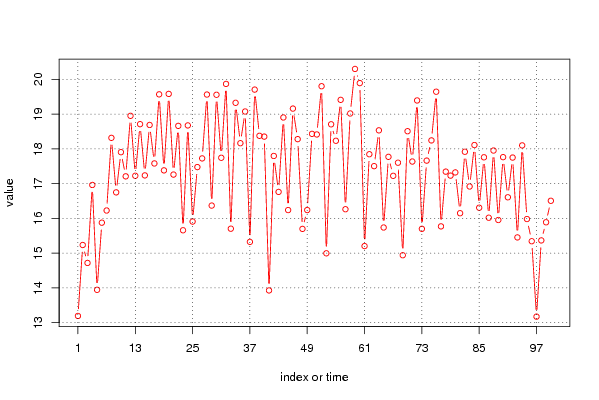
| Title produced by software | Univariate Data Series | ||||||||||||||||||||||||||||||||||||||||
| Date of computation | Sat, 25 Sep 2010 11:54:31 +0000 | ||||||||||||||||||||||||||||||||||||||||
| Cite this page as follows | Statistical Computations at FreeStatistics.org, Office for Research Development and Education, URL https://freestatistics.org/blog/index.php?v=date/2010/Sep/25/t1285415675kgfj3q17a408cwb.htm/, Retrieved Sat, 04 May 2024 12:07:54 +0000 | ||||||||||||||||||||||||||||||||||||||||
| Statistical Computations at FreeStatistics.org, Office for Research Development and Education, URL https://freestatistics.org/blog/index.php?pk=79541, Retrieved Sat, 04 May 2024 12:07:54 +0000 | |||||||||||||||||||||||||||||||||||||||||
| QR Codes: | |||||||||||||||||||||||||||||||||||||||||
|
| |||||||||||||||||||||||||||||||||||||||||
| Original text written by user: | |||||||||||||||||||||||||||||||||||||||||
| IsPrivate? | No (this computation is public) | ||||||||||||||||||||||||||||||||||||||||
| User-defined keywords | KDGP1W1 - Evi Van Dingenen | ||||||||||||||||||||||||||||||||||||||||
| Estimated Impact | 224 | ||||||||||||||||||||||||||||||||||||||||
Tree of Dependent Computations | |||||||||||||||||||||||||||||||||||||||||
| Family? (F = Feedback message, R = changed R code, M = changed R Module, P = changed Parameters, D = changed Data) | |||||||||||||||||||||||||||||||||||||||||
| - [Univariate Data Series] [opdracht 1] [2010-09-25 11:54:31] [89ec97ab3733ab465a33f3d446b0a375] [Current] | |||||||||||||||||||||||||||||||||||||||||
| Feedback Forum | |||||||||||||||||||||||||||||||||||||||||
Post a new message | |||||||||||||||||||||||||||||||||||||||||
Dataset | |||||||||||||||||||||||||||||||||||||||||
| Dataseries X: | |||||||||||||||||||||||||||||||||||||||||
13.193 15.234 14.718 16.961 13.945 15.876 16.226 18.316 16.748 17.904 17.209 18.950 17.225 18.710 17.236 18.687 17.580 19.568 17.381 19.580 17.260 18.661 15.658 18.674 15.908 17.475 17.725 19.562 16.368 19.555 17.743 19.867 15.703 19.324 18.162 19.074 15.323 19.704 18.375 18.352 13.927 17.795 16.761 18.902 16.239 19.158 18.279 15.698 16.239 18.431 18.414 19.801 14.995 18.706 18.232 19.409 16.263 19.017 20.298 19.891 15.203 17.845 17.502 18.532 15.737 17.770 17.224 17.601 14.940 18.507 17.635 19.392 15.699 17.661 18.243 19.643 15.770 17.344 17.229 17.322 16.148 17.916 16.917 18.109 16.306 17.757 16.018 17.951 15.953 17.761 16.607 17.749 15.453 18.099 15.981 15.343 13.173 15.366 15.888 16.506 | |||||||||||||||||||||||||||||||||||||||||
Tables (Output of Computation) | |||||||||||||||||||||||||||||||||||||||||
| |||||||||||||||||||||||||||||||||||||||||
Figures (Output of Computation) | |||||||||||||||||||||||||||||||||||||||||
Input Parameters & R Code | |||||||||||||||||||||||||||||||||||||||||
| Parameters (Session): | |||||||||||||||||||||||||||||||||||||||||
| par1 = verkoop gewone woningen ; par4 = 12 ; | |||||||||||||||||||||||||||||||||||||||||
| Parameters (R input): | |||||||||||||||||||||||||||||||||||||||||
| par1 = verkoop gewone woningen ; par2 = ; par3 = ; par4 = 12 ; | |||||||||||||||||||||||||||||||||||||||||
| R code (references can be found in the software module): | |||||||||||||||||||||||||||||||||||||||||
if (par4 != 'No season') { | |||||||||||||||||||||||||||||||||||||||||