Free Statistics

of Irreproducible Research!

Author's title

Author*Unverified author*
R Software Modulerwasp_histogram.wasp
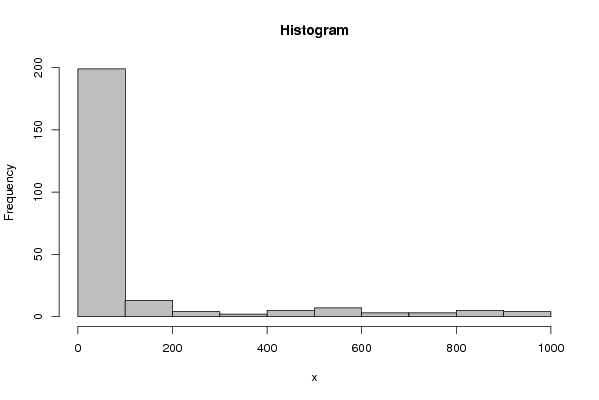
Title produced by softwareHistogram
Date of computationTue, 28 Sep 2010 13:40:21 +0000
Cite this page as followsStatistical Computations at FreeStatistics.org, Office for Research Development and Education, URL https://freestatistics.org/blog/index.php?v=date/2010/Sep/28/t1285681232tr0yephqy8z3uh7.htm/, Retrieved Mon, 29 Apr 2024 07:46:41 +0000
Statistical Computations at FreeStatistics.org, Office for Research Development and Education, URL https://freestatistics.org/blog/index.php?pk=79583, Retrieved Mon, 29 Apr 2024 07:46:41 +0000
QR Codes:

Original text written by user:
IsPrivate?No (this computation is public)
User-defined keywordsKDGP1W1
Estimated Impact177
Family? (F = Feedback message, R = changed R code, M = changed R Module, P = changed Parameters, D = changed Data)
-       [Histogram] [Frequentietabel] [2010-09-28 13:40:21] [72a344459e5b13eacf7bf474aa92c893] [Current]
Feedback Forum

Post a new message
Dataseries X:
51.807
52.882
47.845
50.145
48.830
28.262
23.561
24.263
25.095
19.936
11.902
7.316
8.677
7.919
3.491
8.595
10.941
5.765
3.043
4.032
4.023
4.704
108
5.390
3.192
2.384
2.140
2.181
2.927
1.887
963
3
201
1.557
619
489
565
83
65
40
52
90
92
42
21
129
1.190
587
57
50.145
52.393
55.403
56.490
52.143
34.916
24.889
27.432
29.281
22.452
11.053
9.606
7.629
10.854
6.177
8.723
12.561
6.316
3.119
3.832
4.743
5.624
670
7.178
3.202
2.256
2.545
1.783
3.639
1.478
1.122
332
215
1.579
1.221
627
571
738
54
77
106
143
86
53
21
106
439
2
117
45.636
51.773
50.114
55.708
49.261
36.299
25.197
28.343
29.269
22.136
13.128
12.093
7.298
13.176
8.231
9.353
11.886
6.827
3.726
3.723
4.798
5.502
1.955
6.543
3.859
2.658
3.165
1.610
3.031
1.155
1.180
806
256
1.148
1.088
704
827
571
70
70
143
102
111
72
17
44
2
0
131
48.961
52.917
49.127
53.160
45.154
39.464
27.415
31.066
23.760
23.253
12.225
15.105
11.169
13.196
9.799
11.049
10.388
6.234
7.147
5.993
4.743
4.854
3.482
4.628
3.483
2.365
2.663
1.866
2.591
1.628
995
847
474
1.042
819
972
815
308
111
75
134
163
75
59
21
61
0
0
91
46.774
44.680
43.516
42.483
40.825
37.702
26.860
25.774
20.356
18.674
13.011
12.731
12.526
12.235
9.587
9.467
8.807
7.761
5.443
4.447
4.420
4.272
4.049
3.867
2.866
2.273
1.906
1.386
1.259
1.088
973
747
576
530
503
484
483
267
92
89
85
73
46
43
35
26
0
0
97


Summary of computational transaction
Raw Inputview raw input (R code)
Raw Outputview raw output of R engine
Computing time2 seconds
R Server'Sir Ronald Aylmer Fisher' @ 193.190.124.24

\begin{tabular}{lllllllll}
\hline
Summary of computational transaction \tabularnewline
Raw Input & view raw input (R code)  \tabularnewline
Raw Output & view raw output of R engine  \tabularnewline
Computing time & 2 seconds \tabularnewline
R Server & 'Sir Ronald Aylmer Fisher' @ 193.190.124.24 \tabularnewline
\hline
\end{tabular}
%Source: https://freestatistics.org/blog/index.php?pk=79583&T=0

[TABLE]
[ROW][C]Summary of computational transaction[/C][/ROW]
[ROW][C]Raw Input[/C][C]view raw input (R code) [/C][/ROW]
[ROW][C]Raw Output[/C][C]view raw output of R engine [/C][/ROW]
[ROW][C]Computing time[/C][C]2 seconds[/C][/ROW]
[ROW][C]R Server[/C][C]'Sir Ronald Aylmer Fisher' @ 193.190.124.24[/C][/ROW]
[/TABLE]
Source: https://freestatistics.org/blog/index.php?pk=79583&T=0

Globally Unique Identifier (entire table): ba.freestatistics.org/blog/index.php?pk=79583&T=0

As an alternative you can also use a QR Code:  

The GUIDs for individual cells are displayed in the table below:

Summary of computational transaction
Raw Inputview raw input (R code)
Raw Outputview raw output of R engine
Computing time2 seconds
R Server'Sir Ronald Aylmer Fisher' @ 193.190.124.24


Frequency Table (Histogram)
BinsMidpointAbs. FrequencyRel. FrequencyCumul. Rel. Freq.Density
[0,100[501990.8122450.8122450.008122
[100,200[150130.0530610.8653060.000531
[200,300[25040.0163270.8816330.000163
[300,400[35020.0081630.8897968.2e-05
[400,500[45050.0204080.9102040.000204
[500,600[55070.0285710.9387760.000286
[600,700[65030.0122450.951020.000122
[700,800[75030.0122450.9632650.000122
[800,900[85050.0204080.9836730.000204
[900,1000]95040.01632710.000163

\begin{tabular}{lllllllll}
\hline
Frequency Table (Histogram) \tabularnewline
Bins & Midpoint & Abs. Frequency & Rel. Frequency & Cumul. Rel. Freq. & Density \tabularnewline
[0,100[ & 50 & 199 & 0.812245 & 0.812245 & 0.008122 \tabularnewline
[100,200[ & 150 & 13 & 0.053061 & 0.865306 & 0.000531 \tabularnewline
[200,300[ & 250 & 4 & 0.016327 & 0.881633 & 0.000163 \tabularnewline
[300,400[ & 350 & 2 & 0.008163 & 0.889796 & 8.2e-05 \tabularnewline
[400,500[ & 450 & 5 & 0.020408 & 0.910204 & 0.000204 \tabularnewline
[500,600[ & 550 & 7 & 0.028571 & 0.938776 & 0.000286 \tabularnewline
[600,700[ & 650 & 3 & 0.012245 & 0.95102 & 0.000122 \tabularnewline
[700,800[ & 750 & 3 & 0.012245 & 0.963265 & 0.000122 \tabularnewline
[800,900[ & 850 & 5 & 0.020408 & 0.983673 & 0.000204 \tabularnewline
[900,1000] & 950 & 4 & 0.016327 & 1 & 0.000163 \tabularnewline
\hline
\end{tabular}
%Source: https://freestatistics.org/blog/index.php?pk=79583&T=1

[TABLE]
[ROW][C]Frequency Table (Histogram)[/C][/ROW]
[ROW][C]Bins[/C][C]Midpoint[/C][C]Abs. Frequency[/C][C]Rel. Frequency[/C][C]Cumul. Rel. Freq.[/C][C]Density[/C][/ROW]
[ROW][C][0,100[[/C][C]50[/C][C]199[/C][C]0.812245[/C][C]0.812245[/C][C]0.008122[/C][/ROW]
[ROW][C][100,200[[/C][C]150[/C][C]13[/C][C]0.053061[/C][C]0.865306[/C][C]0.000531[/C][/ROW]
[ROW][C][200,300[[/C][C]250[/C][C]4[/C][C]0.016327[/C][C]0.881633[/C][C]0.000163[/C][/ROW]
[ROW][C][300,400[[/C][C]350[/C][C]2[/C][C]0.008163[/C][C]0.889796[/C][C]8.2e-05[/C][/ROW]
[ROW][C][400,500[[/C][C]450[/C][C]5[/C][C]0.020408[/C][C]0.910204[/C][C]0.000204[/C][/ROW]
[ROW][C][500,600[[/C][C]550[/C][C]7[/C][C]0.028571[/C][C]0.938776[/C][C]0.000286[/C][/ROW]
[ROW][C][600,700[[/C][C]650[/C][C]3[/C][C]0.012245[/C][C]0.95102[/C][C]0.000122[/C][/ROW]
[ROW][C][700,800[[/C][C]750[/C][C]3[/C][C]0.012245[/C][C]0.963265[/C][C]0.000122[/C][/ROW]
[ROW][C][800,900[[/C][C]850[/C][C]5[/C][C]0.020408[/C][C]0.983673[/C][C]0.000204[/C][/ROW]
[ROW][C][900,1000][/C][C]950[/C][C]4[/C][C]0.016327[/C][C]1[/C][C]0.000163[/C][/ROW]
[/TABLE]
Source: https://freestatistics.org/blog/index.php?pk=79583&T=1

Globally Unique Identifier (entire table): ba.freestatistics.org/blog/index.php?pk=79583&T=1

As an alternative you can also use a QR Code:  

The GUIDs for individual cells are displayed in the table below:

Frequency Table (Histogram)
BinsMidpointAbs. FrequencyRel. FrequencyCumul. Rel. Freq.Density
[0,100[501990.8122450.8122450.008122
[100,200[150130.0530610.8653060.000531
[200,300[25040.0163270.8816330.000163
[300,400[35020.0081630.8897968.2e-05
[400,500[45050.0204080.9102040.000204
[500,600[55070.0285710.9387760.000286
[600,700[65030.0122450.951020.000122
[700,800[75030.0122450.9632650.000122
[800,900[85050.0204080.9836730.000204
[900,1000]95040.01632710.000163


Parameters (Session):
par2 = grey ; par3 = FALSE ; par4 = Unknown ;
Parameters (R input):
par1 = ; par2 = grey ; par3 = FALSE ; par4 = Unknown ;
R code (references can be found in the software module):
par1 <- as.numeric(par1)
if (par3 == 'TRUE') par3 <- TRUE
if (par3 == 'FALSE') par3 <- FALSE
if (par4 == 'Unknown') par1 <- as.numeric(par1)
if (par4 == 'Interval/Ratio') par1 <- as.numeric(par1)
if (par4 == '3-point Likert') par1 <- c(1:3 - 0.5, 3.5)
if (par4 == '4-point Likert') par1 <- c(1:4 - 0.5, 4.5)
if (par4 == '5-point Likert') par1 <- c(1:5 - 0.5, 5.5)
if (par4 == '6-point Likert') par1 <- c(1:6 - 0.5, 6.5)
if (par4 == '7-point Likert') par1 <- c(1:7 - 0.5, 7.5)
if (par4 == '8-point Likert') par1 <- c(1:8 - 0.5, 8.5)
if (par4 == '9-point Likert') par1 <- c(1:9 - 0.5, 9.5)
if (par4 == '10-point Likert') par1 <- c(1:10 - 0.5, 10.5)
bitmap(file='test1.png')
if(is.numeric(x[1])) {
if (is.na(par1)) {
myhist<-hist(x,col=par2,main=main,xlab=xlab,right=par3)
} else {
if (par1 < 0) par1 <- 3
if (par1 > 50) par1 <- 50
myhist<-hist(x,breaks=par1,col=par2,main=main,xlab=xlab,right=par3)
}
} else {
plot(mytab <- table(x),col=par2,main='Frequency Plot',xlab=xlab,ylab='Absolute Frequency')
}
dev.off()
if(is.numeric(x[1])) {
myhist
n <- length(x)
load(file='createtable')
a<-table.start()
a<-table.row.start(a)
a<-table.element(a,hyperlink('histogram.htm','Frequency Table (Histogram)',''),6,TRUE)
a<-table.row.end(a)
a<-table.row.start(a)
a<-table.element(a,'Bins',header=TRUE)
a<-table.element(a,'Midpoint',header=TRUE)
a<-table.element(a,'Abs. Frequency',header=TRUE)
a<-table.element(a,'Rel. Frequency',header=TRUE)
a<-table.element(a,'Cumul. Rel. Freq.',header=TRUE)
a<-table.element(a,'Density',header=TRUE)
a<-table.row.end(a)
crf <- 0
if (par3 == FALSE) mybracket <- '[' else mybracket <- ']'
mynumrows <- (length(myhist$breaks)-1)
for (i in 1:mynumrows) {
a<-table.row.start(a)
if (i == 1)
dum <- paste('[',myhist$breaks[i],sep='')
else
dum <- paste(mybracket,myhist$breaks[i],sep='')
dum <- paste(dum,myhist$breaks[i+1],sep=',')
if (i==mynumrows)
dum <- paste(dum,']',sep='')
else
dum <- paste(dum,mybracket,sep='')
a<-table.element(a,dum,header=TRUE)
a<-table.element(a,myhist$mids[i])
a<-table.element(a,myhist$counts[i])
rf <- myhist$counts[i]/n
crf <- crf + rf
a<-table.element(a,round(rf,6))
a<-table.element(a,round(crf,6))
a<-table.element(a,round(myhist$density[i],6))
a<-table.row.end(a)
}
a<-table.end(a)
table.save(a,file='mytable.tab')
} else {
mytab
reltab <- mytab / sum(mytab)
n <- length(mytab)
load(file='createtable')
a<-table.start()
a<-table.row.start(a)
a<-table.element(a,'Frequency Table (Categorical Data)',3,TRUE)
a<-table.row.end(a)
a<-table.row.start(a)
a<-table.element(a,'Category',header=TRUE)
a<-table.element(a,'Abs. Frequency',header=TRUE)
a<-table.element(a,'Rel. Frequency',header=TRUE)
a<-table.row.end(a)
for (i in 1:n) {
a<-table.row.start(a)
a<-table.element(a,labels(mytab)$x[i],header=TRUE)
a<-table.element(a,mytab[i])
a<-table.element(a,round(reltab[i],4))
a<-table.row.end(a)
}
a<-table.end(a)
table.save(a,file='mytable1.tab')
}