Free Statistics
of Irreproducible Research!
Description of Statistical Computation | |||||||||||||||||||||||||||||||||||||||||
|---|---|---|---|---|---|---|---|---|---|---|---|---|---|---|---|---|---|---|---|---|---|---|---|---|---|---|---|---|---|---|---|---|---|---|---|---|---|---|---|---|---|
| Author's title | |||||||||||||||||||||||||||||||||||||||||
| Author | *Unverified author* | ||||||||||||||||||||||||||||||||||||||||
| R Software Module | rwasp_univariatedataseries.wasp | ||||||||||||||||||||||||||||||||||||||||
| Title produced by software | Univariate Data Series | ||||||||||||||||||||||||||||||||||||||||
| Date of computation | Tue, 28 Sep 2010 14:18:35 +0000 | ||||||||||||||||||||||||||||||||||||||||
| Cite this page as follows | Statistical Computations at FreeStatistics.org, Office for Research Development and Education, URL https://freestatistics.org/blog/index.php?v=date/2010/Sep/28/t12856840790nmbfal37gghqsy.htm/, Retrieved Mon, 29 Apr 2024 05:14:49 +0000 | ||||||||||||||||||||||||||||||||||||||||
| Statistical Computations at FreeStatistics.org, Office for Research Development and Education, URL https://freestatistics.org/blog/index.php?pk=79588, Retrieved Mon, 29 Apr 2024 05:14:49 +0000 | |||||||||||||||||||||||||||||||||||||||||
| QR Codes: | |||||||||||||||||||||||||||||||||||||||||
|
| |||||||||||||||||||||||||||||||||||||||||
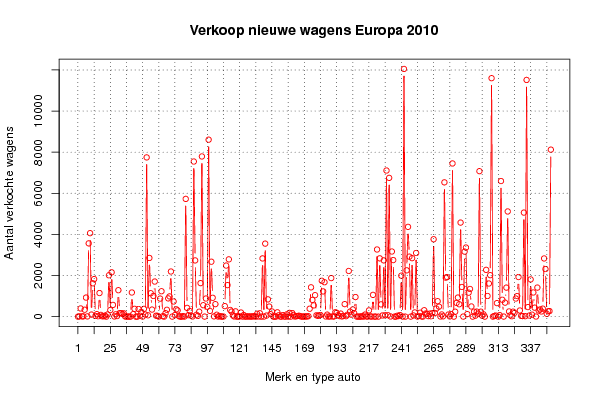
| Original text written by user: | Deze reeks stelt de nieuwverkoop van autos per merk en per model van het jaar 2010 (tot augustus) voor (in Europa), uitgedrukt in aantallen. | ||||||||||||||||||||||||||||||||||||||||
| IsPrivate? | No (this computation is public) | ||||||||||||||||||||||||||||||||||||||||
| User-defined keywords | KDGP1W1 | ||||||||||||||||||||||||||||||||||||||||
| Estimated Impact | 190 | ||||||||||||||||||||||||||||||||||||||||
Tree of Dependent Computations | |||||||||||||||||||||||||||||||||||||||||
| Family? (F = Feedback message, R = changed R code, M = changed R Module, P = changed Parameters, D = changed Data) | |||||||||||||||||||||||||||||||||||||||||
| - [Univariate Data Series] [Verkoop nieuwe wa...] [2010-09-28 14:18:35] [5815de052410d7754c978b0de903e641] [Current] | |||||||||||||||||||||||||||||||||||||||||
| Feedback Forum | |||||||||||||||||||||||||||||||||||||||||
Post a new message | |||||||||||||||||||||||||||||||||||||||||
Dataset | |||||||||||||||||||||||||||||||||||||||||
| Dataseries X: | |||||||||||||||||||||||||||||||||||||||||
1 15 400 15 16 337 928 13 3565 4062 102 1625 1829 35 122 21 1149 86 18 20 51 1 106 2013 321 2157 572 12 116 30 1288 174 176 131 165 12 2 8 1 1 1176 121 382 1 1 372 48 231 3 379 104 7746 67 2857 1141 345 1007 1708 48 39 2 880 1237 24 4 170 334 890 987 2196 2 738 79 357 305 23 1 1 27 5 5728 426 72 272 55 8 7546 2737 94 36 242 1631 7793 558 3 883 483 8608 279 2673 918 14 609 95 4 34 8 2 6 512 2486 1534 2788 326 247 61 10 260 1 2 17 202 4 79 1 7 13 11 8 4 16 25 1 141 7 167 2 2833 3 3553 54 842 492 122 253 3 2 2 212 67 6 1 78 9 1 110 1 184 3 177 81 6 19 32 48 23 4 2 9 12 8 23 386 1428 815 549 1046 67 42 58 81 1746 1229 1675 8 100 2 14 1877 6 13 215 190 75 28 148 8 40 610 25 94 2223 247 94 350 175 954 2 4 1 1 24 1 100 16 1 306 17 2 1059 4 2 3268 2 2837 599 59 2738 70 7107 71 6751 11 3169 2753 2 1 46 27 80 1994 3 12048 2 2255 4368 2919 2 2847 60 206 3097 3 36 192 14 1 313 148 147 27 145 18 171 3766 180 391 753 488 11 107 16 6533 1899 1924 104 12 122 7452 1 241 672 929 604 4576 1444 4 3164 3362 124 1167 1347 496 1 242 48 246 146 7077 243 49 115 2 2277 1007 1613 2019 11599 1 33 56 660 1 76 6597 822 4 682 1413 5117 254 69 21 243 186 882 1004 1928 301 39 30 5062 25 11514 467 53 1813 98 1177 439 6 1415 297 352 254 389 2831 2316 139 263 271 8123 | |||||||||||||||||||||||||||||||||||||||||
Tables (Output of Computation) | |||||||||||||||||||||||||||||||||||||||||
| |||||||||||||||||||||||||||||||||||||||||
Figures (Output of Computation) | |||||||||||||||||||||||||||||||||||||||||
Input Parameters & R Code | |||||||||||||||||||||||||||||||||||||||||
| Parameters (Session): | |||||||||||||||||||||||||||||||||||||||||
| par1 = Verkoop nieuwe wagens Europa 2010 ; par2 = http://www.raivereniging.nl/markt-informatie/statistieken/europese-statistieken.aspx ; par3 = Deze gegevensreeks geeft de verkochte modellen per merk in 2010 in Europa. ; par4 = 12 ; | |||||||||||||||||||||||||||||||||||||||||
| Parameters (R input): | |||||||||||||||||||||||||||||||||||||||||
| par1 = Verkoop nieuwe wagens Europa 2010 ; par2 = http://www.raivereniging.nl/markt-informatie/statistieken/europese-statistieken.aspx ; par3 = Deze gegevensreeks geeft de verkochte modellen per merk in 2010 in Europa. ; par4 = 12 ; | |||||||||||||||||||||||||||||||||||||||||
| R code (references can be found in the software module): | |||||||||||||||||||||||||||||||||||||||||
if (par4 != 'No season') { | |||||||||||||||||||||||||||||||||||||||||