Free Statistics
of Irreproducible Research!
Description of Statistical Computation | |||||||||||||||||||||||||||||||||||||||||
|---|---|---|---|---|---|---|---|---|---|---|---|---|---|---|---|---|---|---|---|---|---|---|---|---|---|---|---|---|---|---|---|---|---|---|---|---|---|---|---|---|---|
| Author's title | |||||||||||||||||||||||||||||||||||||||||
| Author | *Unverified author* | ||||||||||||||||||||||||||||||||||||||||
| R Software Module | rwasp_univariatedataseries.wasp | ||||||||||||||||||||||||||||||||||||||||
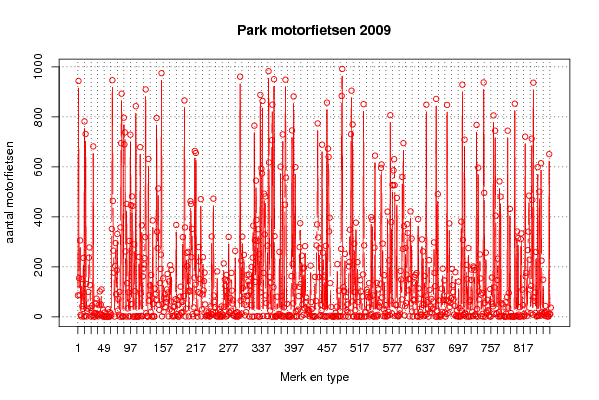
| Title produced by software | Univariate Data Series | ||||||||||||||||||||||||||||||||||||||||
| Date of computation | Tue, 28 Sep 2010 14:18:11 +0000 | ||||||||||||||||||||||||||||||||||||||||
| Cite this page as follows | Statistical Computations at FreeStatistics.org, Office for Research Development and Education, URL https://freestatistics.org/blog/index.php?v=date/2010/Sep/28/t1285684079r01vxt19nnos9se.htm/, Retrieved Sun, 28 Apr 2024 18:54:26 +0000 | ||||||||||||||||||||||||||||||||||||||||
| Statistical Computations at FreeStatistics.org, Office for Research Development and Education, URL https://freestatistics.org/blog/index.php?pk=79587, Retrieved Sun, 28 Apr 2024 18:54:26 +0000 | |||||||||||||||||||||||||||||||||||||||||
| QR Codes: | |||||||||||||||||||||||||||||||||||||||||
|
| |||||||||||||||||||||||||||||||||||||||||
| Original text written by user: | Deze cijfers geven het aantal motorfietsen per merk en model aan op de Nederlandse wegen op 31 oktober 2009 | ||||||||||||||||||||||||||||||||||||||||
| IsPrivate? | No (this computation is public) | ||||||||||||||||||||||||||||||||||||||||
| User-defined keywords | KDGP1W1 | ||||||||||||||||||||||||||||||||||||||||
| Estimated Impact | 204 | ||||||||||||||||||||||||||||||||||||||||
Tree of Dependent Computations | |||||||||||||||||||||||||||||||||||||||||
| Family? (F = Feedback message, R = changed R code, M = changed R Module, P = changed Parameters, D = changed Data) | |||||||||||||||||||||||||||||||||||||||||
| - [Univariate Data Series] [Park motorfietsen...] [2010-09-28 14:18:11] [97983bf7277c2e38098275bb77d0f83a] [Current] | |||||||||||||||||||||||||||||||||||||||||
| Feedback Forum | |||||||||||||||||||||||||||||||||||||||||
Post a new message | |||||||||||||||||||||||||||||||||||||||||
Dataset | |||||||||||||||||||||||||||||||||||||||||
| Dataseries X: | |||||||||||||||||||||||||||||||||||||||||
86 944 155 88 306 8 2 152 43 32 236 1 782 4 732 132 2.028 24 33 100 237 278 127 36 1 24 45 6 682 2 15 1 15 54 73 12 8 2 47 10 102 13 49 110 7 2 28 2 1 18 2 4 1 2 2 31 1 1 19 2 14 6.841 352 947 464 265 177 1.565 204 295 91 187 332 25 71 9 100 1 358 695 893 1.756 1.250 2.185 797 690 738 262 1.357 452 135 34 98 1.642 304 2.245 729 447 51 482 444 1.206 1.120 290 103 1.339 843 1.432 2.680 1.082 2.443 1.040 240 2.691 679 94 3.998 366 2.083 162 193 210 235 319 910 15 4 1.872 1 632 65 88 126 20 168 2.082 1.449 386 52 3 1.116 113 91 68 796 341 275 514 48 28 135 192 249 975 2 52 154 20 76 90 39 60 73 110 172 98 2 142 30 207 62 188 24 2 4 39 2 42 5 71 368 11 68 2 49 1 7 81 121 17 17 60 319 21 84 866 358 1.604 33 256 203 103 260 1.776 106 102 463 452 239 352 11 2.244 38 157 664 129 656 15 18 1.077 99 279 222 152 94 471 2 30 90 239 106 143 177 50 2.159 22 4 6 6 18 9 1 3 42 12 322 9 20 473 86 60 38 18 2.924 3.432 182 1 8 8.381 31 1.011 19 2.771 42 1 9.450 6.102 214 40 150 124 1.443 168 5 145 10 320 20 16 76 25 176 105 53 66 5 5 13 264 1 17 4 19 1 3 6 9 961 65 225 13 321 116 72 248 82 6 48 19 84 168 85 142 170 1.298 126 104 47 200 1.007 237 365 1.306 765 307 140 545 388 3.257 304 351 1 251 1.358 888 98 593 574 864 4 176 493 330 482 86 55 3.233 285 2.925 983 618 160 25 136 1.245 707 849 1 119 951 323 1.749 3.359 1.797 1.551 81 4 12 6 260 10.622 601 2.018 84 5.482 730 1 38 2 449 949 557 3 52 1 6 8 1 7 3 1 163 746 212 54 882 1.343 121 599 22 3.223 1 23 29 83 120 279 375 132 1 245 50 193 8.251 197 34.069 283 59 77 10 33 27 26 18 25 2 205 59 31 3.435 1.617 1.298 3 1.119 160 2 64 286 370 774 318 159 275 2 7.675 48 26 689 4 257 159 1.058 166 1.066 284 3.358 857 1.251 673 640 342 397 135 4.472 40 1.753 1.275 1.775 3.269 2 1 4 16 3.707 41 211 1.552 2.210 105 2.597 22 2.920 272 884 992 1.116 119 105 102 252 2.281 80 27 50 19 1 202 220 349 17 731 905 62 770 2.505 1.562 293 100 27 377 2 1 219 59 2 1.433 5 147 102 1.026 1 82 170 851 286 1 20 18 2 109 99 79 37 135 2 79 8 399 12 388 86 1.474 1.826 277 645 2.111 5.426 136 1.327 8.387 110 45 39 57 133 596 610 78 293 3 30 167 2 15 47 1.949 2.779 421 7.319 20 226 6.787 807 66 379 14 528 526 586 631 527 3.470 48 49 476 5 2.163 2.812 5.649 28 13 184 150 70 560 272 695 363 6 43 276 56 169 371 336 106 151 2.292 152 422 54 313 22 1 70 66 160 134 168 20 175 4 1 391 114 73 1 20 10 8 310 48 262 2.533 54 164 7 86 849 11 59 33 1.177 227 108 19 42 72 17 30 34 61 298 176 123 1.313 872 1.021 24 491 2 66 2 8 1 10 113 20 193 68 86 146 18 1 68 11 848 63 15 62 374 40 56 75 75 192 127 100 70 9 44 179 3 4 27 3 2.087 141 1 35 4.011 1.554 381 24 929 308 10.281 6.353 709 16.601 11.576 1.563 208 151 2.713 275 1 61 68 1.699 148 189 20 3 202 197 187 8 11.257 2.963 768 32 1 597 102 70 250 154 89 2.818 96 12.333 1.293 938 496 56 1 257 21 15 68 27 25 6 1.418 111 1.144 58 157 52 42 806 13 118 745 405 11 15 147 233 1.080 19 542 2.023 481 3 54 4 50 21 3 1 1 58 13 1 80 745 37 96 1 432 3 15 2.123 3.609 1 1 1 1.012 853 2.842 3.599 4.728 342 2 315 9 1 39 1 311 334 4 109 47 1.319 12 6 721 162 176 3.345 18 267 341 485 229 109 15 124 713 468 9 937 78 64 98 15.744 260 1.409 4 599 4.340 6.789 501 14.905 4.571 615 225 20.186 10 149 10 16 20 44 3 18 6 1.285 11 2 651 10 11.437 37.157 | |||||||||||||||||||||||||||||||||||||||||
Tables (Output of Computation) | |||||||||||||||||||||||||||||||||||||||||
| |||||||||||||||||||||||||||||||||||||||||
Figures (Output of Computation) | |||||||||||||||||||||||||||||||||||||||||
Input Parameters & R Code | |||||||||||||||||||||||||||||||||||||||||
| Parameters (Session): | |||||||||||||||||||||||||||||||||||||||||
| par1 = Park motorfietsen 2009 ; par2 = http://www.raivereniging.nl/markt-informatie/statistieken/wagenparkstatistieken.aspx ; par3 = Deze cijfers geven het aantal motorfietsen per merk en model aan op de Nederlandse wegen op 31 oktober 2009 ; par4 = 12 ; | |||||||||||||||||||||||||||||||||||||||||
| Parameters (R input): | |||||||||||||||||||||||||||||||||||||||||
| par1 = Park motorfietsen 2009 ; par2 = http://www.raivereniging.nl/markt-informatie/statistieken/wagenparkstatistieken.aspx ; par3 = Deze cijfers geven het aantal motorfietsen per merk en model aan op de Nederlandse wegen op 31 oktober 2009 ; par4 = 12 ; | |||||||||||||||||||||||||||||||||||||||||
| R code (references can be found in the software module): | |||||||||||||||||||||||||||||||||||||||||
if (par4 != 'No season') { | |||||||||||||||||||||||||||||||||||||||||