Free Statistics
of Irreproducible Research!
Description of Statistical Computation | |||||||||||||||||||||||||||||||||||||||||
|---|---|---|---|---|---|---|---|---|---|---|---|---|---|---|---|---|---|---|---|---|---|---|---|---|---|---|---|---|---|---|---|---|---|---|---|---|---|---|---|---|---|
| Author's title | |||||||||||||||||||||||||||||||||||||||||
| Author | *Unverified author* | ||||||||||||||||||||||||||||||||||||||||
| R Software Module | rwasp_univariatedataseries.wasp | ||||||||||||||||||||||||||||||||||||||||
| Title produced by software | Univariate Data Series | ||||||||||||||||||||||||||||||||||||||||
| Date of computation | Tue, 28 Sep 2010 14:59:28 +0000 | ||||||||||||||||||||||||||||||||||||||||
| Cite this page as follows | Statistical Computations at FreeStatistics.org, Office for Research Development and Education, URL https://freestatistics.org/blog/index.php?v=date/2010/Sep/28/t1285686337zk243dsgc8d9gs5.htm/, Retrieved Sun, 28 Apr 2024 23:23:57 +0000 | ||||||||||||||||||||||||||||||||||||||||
| Statistical Computations at FreeStatistics.org, Office for Research Development and Education, URL https://freestatistics.org/blog/index.php?pk=79594, Retrieved Sun, 28 Apr 2024 23:23:57 +0000 | |||||||||||||||||||||||||||||||||||||||||
| QR Codes: | |||||||||||||||||||||||||||||||||||||||||
|
| |||||||||||||||||||||||||||||||||||||||||
| Original text written by user: | |||||||||||||||||||||||||||||||||||||||||
| IsPrivate? | No (this computation is public) | ||||||||||||||||||||||||||||||||||||||||
| User-defined keywords | KDGP1W1 - Kristina Henderickx | ||||||||||||||||||||||||||||||||||||||||
| Estimated Impact | 196 | ||||||||||||||||||||||||||||||||||||||||
Tree of Dependent Computations | |||||||||||||||||||||||||||||||||||||||||
| Family? (F = Feedback message, R = changed R code, M = changed R Module, P = changed Parameters, D = changed Data) | |||||||||||||||||||||||||||||||||||||||||
| - [Univariate Data Series] [Opgave 1] [2010-09-28 14:59:28] [fc25096fe10e0eaa0ba5faf39fc096b3] [Current] | |||||||||||||||||||||||||||||||||||||||||
| Feedback Forum | |||||||||||||||||||||||||||||||||||||||||
Post a new message | |||||||||||||||||||||||||||||||||||||||||
Dataset | |||||||||||||||||||||||||||||||||||||||||
| Dataseries X: | |||||||||||||||||||||||||||||||||||||||||
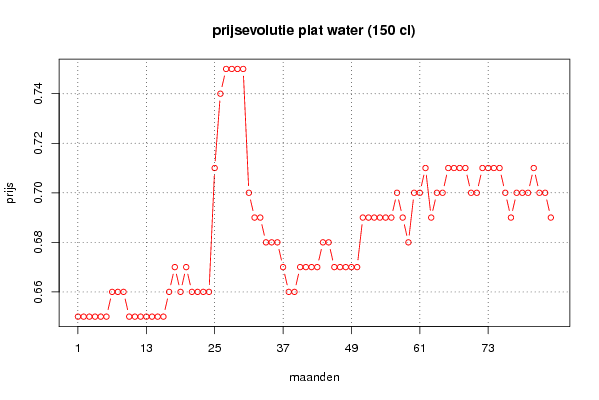
0,65 0,65 0,65 0,65 0,65 0,65 0,66 0,66 0,66 0,65 0,65 0,65 0,65 0,65 0,65 0,65 0,66 0,67 0,66 0,67 0,66 0,66 0,66 0,66 0,71 0,74 0,75 0,75 0,75 0,75 0,7 0,69 0,69 0,68 0,68 0,68 0,67 0,66 0,66 0,67 0,67 0,67 0,67 0,68 0,68 0,67 0,67 0,67 0,67 0,67 0,69 0,69 0,69 0,69 0,69 0,69 0,7 0,69 0,68 0,7 0,7 0,71 0,69 0,7 0,7 0,71 0,71 0,71 0,71 0,7 0,7 0,71 0,71 0,71 0,71 0,7 0,69 0,7 0,7 0,7 0,71 0,7 0,7 0,69 | |||||||||||||||||||||||||||||||||||||||||
Tables (Output of Computation) | |||||||||||||||||||||||||||||||||||||||||
| |||||||||||||||||||||||||||||||||||||||||
Figures (Output of Computation) | |||||||||||||||||||||||||||||||||||||||||
Input Parameters & R Code | |||||||||||||||||||||||||||||||||||||||||
| Parameters (Session): | |||||||||||||||||||||||||||||||||||||||||
| par1 = Prijsevolutie plat water 150 cl ; par2 = Belgostat ; par3 = gemiddelde consumptieprijs van 150 cl plat water ; par4 = 12 ; | |||||||||||||||||||||||||||||||||||||||||
| Parameters (R input): | |||||||||||||||||||||||||||||||||||||||||
| par1 = Prijsevolutie plat water 150 cl ; par2 = Belgostat ; par3 = gemiddelde consumptieprijs van 150 cl plat water ; par4 = 12 ; | |||||||||||||||||||||||||||||||||||||||||
| R code (references can be found in the software module): | |||||||||||||||||||||||||||||||||||||||||
if (par4 != 'No season') { | |||||||||||||||||||||||||||||||||||||||||