Free Statistics
of Irreproducible Research!
Description of Statistical Computation | |||||||||||||||||||||||||||||||||||||||||
|---|---|---|---|---|---|---|---|---|---|---|---|---|---|---|---|---|---|---|---|---|---|---|---|---|---|---|---|---|---|---|---|---|---|---|---|---|---|---|---|---|---|
| Author's title | |||||||||||||||||||||||||||||||||||||||||
| Author | *Unverified author* | ||||||||||||||||||||||||||||||||||||||||
| R Software Module | rwasp_univariatedataseries.wasp | ||||||||||||||||||||||||||||||||||||||||
| Title produced by software | Univariate Data Series | ||||||||||||||||||||||||||||||||||||||||
| Date of computation | Tue, 28 Sep 2010 15:38:36 +0000 | ||||||||||||||||||||||||||||||||||||||||
| Cite this page as follows | Statistical Computations at FreeStatistics.org, Office for Research Development and Education, URL https://freestatistics.org/blog/index.php?v=date/2010/Sep/28/t12856886744pahpd66407da13.htm/, Retrieved Mon, 29 Apr 2024 01:43:48 +0000 | ||||||||||||||||||||||||||||||||||||||||
| Statistical Computations at FreeStatistics.org, Office for Research Development and Education, URL https://freestatistics.org/blog/index.php?pk=79598, Retrieved Mon, 29 Apr 2024 01:43:48 +0000 | |||||||||||||||||||||||||||||||||||||||||
| QR Codes: | |||||||||||||||||||||||||||||||||||||||||
|
| |||||||||||||||||||||||||||||||||||||||||
| Original text written by user: | |||||||||||||||||||||||||||||||||||||||||
| IsPrivate? | No (this computation is public) | ||||||||||||||||||||||||||||||||||||||||
| User-defined keywords | |||||||||||||||||||||||||||||||||||||||||
| Estimated Impact | 210 | ||||||||||||||||||||||||||||||||||||||||
Tree of Dependent Computations | |||||||||||||||||||||||||||||||||||||||||
| Family? (F = Feedback message, R = changed R code, M = changed R Module, P = changed Parameters, D = changed Data) | |||||||||||||||||||||||||||||||||||||||||
| - [Univariate Data Series] [prijs diesel per ...] [2010-09-28 15:38:36] [93b6d34f85f9cfe38e2fbbaaab7aeb02] [Current] | |||||||||||||||||||||||||||||||||||||||||
| Feedback Forum | |||||||||||||||||||||||||||||||||||||||||
Post a new message | |||||||||||||||||||||||||||||||||||||||||
Dataset | |||||||||||||||||||||||||||||||||||||||||
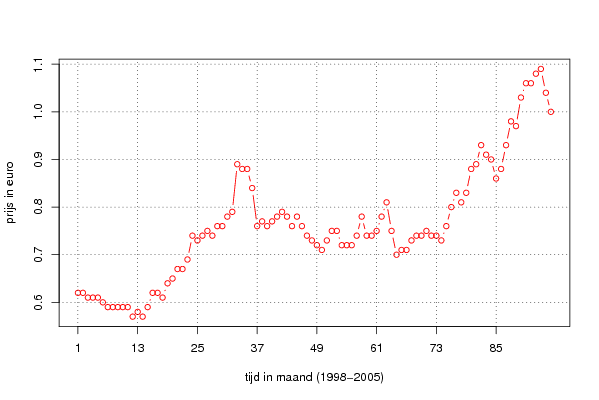
| Dataseries X: | |||||||||||||||||||||||||||||||||||||||||
0,62 0,62 0,61 0,61 0,61 0,6 0,59 0,59 0,59 0,59 0,59 0,57 0,58 0,57 0,59 0,62 0,62 0,61 0,64 0,65 0,67 0,67 0,69 0,74 0,73 0,74 0,75 0,74 0,76 0,76 0,78 0,79 0,89 0,88 0,88 0,84 0,76 0,77 0,76 0,77 0,78 0,79 0,78 0,76 0,78 0,76 0,74 0,73 0,72 0,71 0,73 0,75 0,75 0,72 0,72 0,72 0,74 0,78 0,74 0,74 0,75 0,78 0,81 0,75 0,7 0,71 0,71 0,73 0,74 0,74 0,75 0,74 0,74 0,73 0,76 0,8 0,83 0,81 0,83 0,88 0,89 0,93 0,91 0,9 0,86 0,88 0,93 0,98 0,97 1,03 1,06 1,06 1,08 1,09 1,04 1 | |||||||||||||||||||||||||||||||||||||||||
Tables (Output of Computation) | |||||||||||||||||||||||||||||||||||||||||
| |||||||||||||||||||||||||||||||||||||||||
Figures (Output of Computation) | |||||||||||||||||||||||||||||||||||||||||
Input Parameters & R Code | |||||||||||||||||||||||||||||||||||||||||
| Parameters (Session): | |||||||||||||||||||||||||||||||||||||||||
| par1 = Kostprijs Diesel ; par2 = http://www.nbb.be/belgostat/PublicatieSelectieLinker?LinkID=251000019|910000082&Lang=N ; par3 = maandelijkse prijs van diesel van 1998 tot 2005 ; par4 = 12 ; | |||||||||||||||||||||||||||||||||||||||||
| Parameters (R input): | |||||||||||||||||||||||||||||||||||||||||
| par1 = Kostprijs Diesel ; par2 = http://www.nbb.be/belgostat/PublicatieSelectieLinker?LinkID=251000019|910000082&Lang=N ; par3 = maandelijkse prijs van diesel van 1998 tot 2005 ; par4 = 12 ; | |||||||||||||||||||||||||||||||||||||||||
| R code (references can be found in the software module): | |||||||||||||||||||||||||||||||||||||||||
if (par4 != 'No season') { | |||||||||||||||||||||||||||||||||||||||||