Free Statistics
of Irreproducible Research!
Description of Statistical Computation | |||||||||||||||||||||||||||||||||||||||||
|---|---|---|---|---|---|---|---|---|---|---|---|---|---|---|---|---|---|---|---|---|---|---|---|---|---|---|---|---|---|---|---|---|---|---|---|---|---|---|---|---|---|
| Author's title | |||||||||||||||||||||||||||||||||||||||||
| Author | *Unverified author* | ||||||||||||||||||||||||||||||||||||||||
| R Software Module | rwasp_univariatedataseries.wasp | ||||||||||||||||||||||||||||||||||||||||
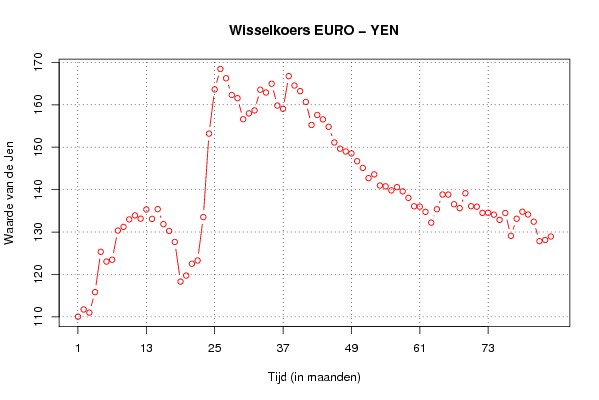
| Title produced by software | Univariate Data Series | ||||||||||||||||||||||||||||||||||||||||
| Date of computation | Wed, 29 Sep 2010 17:37:44 +0000 | ||||||||||||||||||||||||||||||||||||||||
| Cite this page as follows | Statistical Computations at FreeStatistics.org, Office for Research Development and Education, URL https://freestatistics.org/blog/index.php?v=date/2010/Sep/29/t1285781859j83nd3avcubpcpv.htm/, Retrieved Sat, 04 May 2024 14:11:31 +0000 | ||||||||||||||||||||||||||||||||||||||||
| Statistical Computations at FreeStatistics.org, Office for Research Development and Education, URL https://freestatistics.org/blog/index.php?pk=79673, Retrieved Sat, 04 May 2024 14:11:31 +0000 | |||||||||||||||||||||||||||||||||||||||||
| QR Codes: | |||||||||||||||||||||||||||||||||||||||||
|
| |||||||||||||||||||||||||||||||||||||||||
| Original text written by user: | |||||||||||||||||||||||||||||||||||||||||
| IsPrivate? | No (this computation is public) | ||||||||||||||||||||||||||||||||||||||||
| User-defined keywords | KDGP1W1 | ||||||||||||||||||||||||||||||||||||||||
| Estimated Impact | 170 | ||||||||||||||||||||||||||||||||||||||||
Tree of Dependent Computations | |||||||||||||||||||||||||||||||||||||||||
| Family? (F = Feedback message, R = changed R code, M = changed R Module, P = changed Parameters, D = changed Data) | |||||||||||||||||||||||||||||||||||||||||
| - [Univariate Data Series] [Wisselkoers Euro Jen] [2010-09-29 17:37:44] [8926b0113c2f0aa20b2cf07d29df363f] [Current] - RMP [Histogram] [Stefan Hereijgers...] [2010-10-06 18:14:22] [ca9acc7ddfad525f2136abf1b3000808] - RMP [Histogram] [Stefan Hereijgers...] [2010-10-06 18:18:59] [ca9acc7ddfad525f2136abf1b3000808] - RMP [Kernel Density Estimation] [Stefan Hereijgers...] [2010-10-06 18:24:15] [ca9acc7ddfad525f2136abf1b3000808] | |||||||||||||||||||||||||||||||||||||||||
| Feedback Forum | |||||||||||||||||||||||||||||||||||||||||
Post a new message | |||||||||||||||||||||||||||||||||||||||||
Dataset | |||||||||||||||||||||||||||||||||||||||||
| Dataseries X: | |||||||||||||||||||||||||||||||||||||||||
110.04 111.73 110.99 115.83 125.33 123.03 123.46 130.34 131.21 132.97 133.91 133.14 135.31 133.09 135.39 131.85 130.25 127.65 118.3 119.73 122.51 123.28 133.52 153.2 163.63 168.45 166.26 162.31 161.56 156.59 157.97 158.68 163.55 162.89 164.95 159.82 159.05 166.76 164.55 163.22 160.68 155.24 157.6 156.56 154.82 151.11 149.65 148.99 148.53 146.7 145.11 142.7 143.59 140.96 140.77 139.81 140.58 139.59 138.05 136.06 135.98 134.75 132.22 135.37 138.84 138.83 136.55 135.63 139.14 136.09 135.97 134.51 134.54 134.08 132.86 134.48 129.08 133.13 134.78 134.13 132.43 127.84 128.12 128.94 | |||||||||||||||||||||||||||||||||||||||||
Tables (Output of Computation) | |||||||||||||||||||||||||||||||||||||||||
| |||||||||||||||||||||||||||||||||||||||||
Figures (Output of Computation) | |||||||||||||||||||||||||||||||||||||||||
Input Parameters & R Code | |||||||||||||||||||||||||||||||||||||||||
| Parameters (Session): | |||||||||||||||||||||||||||||||||||||||||
| par1 = Wisselkoers EURO - YEN ; par2 = http://www.nbb.be/belgostat/PublicatieSelectieLinker?LinkID=451000038|910000082&Lang=N ; par3 = De waarde van de Japanse Jen ten opzicihte van de Euro ; par4 = 12 ; | |||||||||||||||||||||||||||||||||||||||||
| Parameters (R input): | |||||||||||||||||||||||||||||||||||||||||
| par1 = Wisselkoers EURO - YEN ; par2 = http://www.nbb.be/belgostat/PublicatieSelectieLinker?LinkID=451000038|910000082&Lang=N ; par3 = De waarde van de Japanse Jen ten opzicihte van de Euro ; par4 = 12 ; | |||||||||||||||||||||||||||||||||||||||||
| R code (references can be found in the software module): | |||||||||||||||||||||||||||||||||||||||||
if (par4 != 'No season') { | |||||||||||||||||||||||||||||||||||||||||