Free Statistics

of Irreproducible Research!

Author's title

Author*Unverified author*
R Software Modulerwasp_smp.wasp
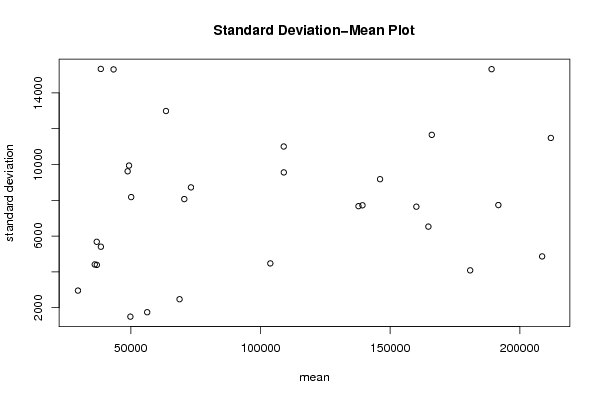
Title produced by softwareStandard Deviation-Mean Plot
Date of computationMon, 15 Aug 2011 09:25:28 -0400
Cite this page as followsStatistical Computations at FreeStatistics.org, Office for Research Development and Education, URL https://freestatistics.org/blog/index.php?v=date/2011/Aug/15/t13134148054qc6xz62fbdgkai.htm/, Retrieved Sun, 19 May 2024 01:44:04 +0000
Statistical Computations at FreeStatistics.org, Office for Research Development and Education, URL https://freestatistics.org/blog/index.php?pk=123769, Retrieved Sun, 19 May 2024 01:44:04 +0000
QR Codes:

Original text written by user:
IsPrivate?No (this computation is public)
User-defined keywordsSébastien Delforge
Estimated Impact104
Family? (F = Feedback message, R = changed R code, M = changed R Module, P = changed Parameters, D = changed Data)
-       [Standard Deviation-Mean Plot] [Tijdreeks 1 - sta...] [2011-08-15 13:25:28] [923770d86edf74ed976a539eae527e37] [Current]
Feedback Forum

Post a new message
Dataseries X:
58109
57087
56064
54019
74712
73689
58109
47763
48785
48785
49808
51964
45718
39462
34339
34339
54019
56064
40484
22859
32183
32183
39462
43663
42640
32183
37417
35362
52987
48785
32183
19782
31160
34339
37417
41507
33205
26038
29116
30138
57087
57087
41507
39462
45718
42640
50942
61288
63343
48785
44685
40484
68567
70622
65388
70622
69589
61288
70622
80968
85169
72667
64365
70622
97570
105872
103827
107916
106894
96548
114173
118374
124519
105872
98593
106894
126675
144300
140099
140099
142154
134976
153634
153634
150455
132820
135999
138054
151579
169204
156701
162958
157724
154656
178538
173304
166025
155679
166025
171259
177505
185806
177505
182628
176381
175359
201285
203441
195140
180583
192984
198208
204464
213788
204464
211743
208564
197185
221066
221066


Summary of computational transaction
Raw Inputview raw input (R code)
Raw Outputview raw output of R engine
Computing time2 seconds
R Server'George Udny Yule' @ yule.wessa.net

\begin{tabular}{lllllllll}
\hline
Summary of computational transaction \tabularnewline
Raw Input & view raw input (R code)  \tabularnewline
Raw Output & view raw output of R engine  \tabularnewline
Computing time & 2 seconds \tabularnewline
R Server & 'George Udny Yule' @ yule.wessa.net \tabularnewline
\hline
\end{tabular}
%Source: https://freestatistics.org/blog/index.php?pk=123769&T=0

[TABLE]
[ROW][C]Summary of computational transaction[/C][/ROW]
[ROW][C]Raw Input[/C][C]view raw input (R code) [/C][/ROW]
[ROW][C]Raw Output[/C][C]view raw output of R engine [/C][/ROW]
[ROW][C]Computing time[/C][C]2 seconds[/C][/ROW]
[ROW][C]R Server[/C][C]'George Udny Yule' @ yule.wessa.net[/C][/ROW]
[/TABLE]
Source: https://freestatistics.org/blog/index.php?pk=123769&T=0

Globally Unique Identifier (entire table): ba.freestatistics.org/blog/index.php?pk=123769&T=0

As an alternative you can also use a QR Code:  

The GUIDs for individual cells are displayed in the table below:

Summary of computational transaction
Raw Inputview raw input (R code)
Raw Outputview raw output of R engine
Computing time2 seconds
R Server'George Udny Yule' @ yule.wessa.net


Standard Deviation-Mean Plot
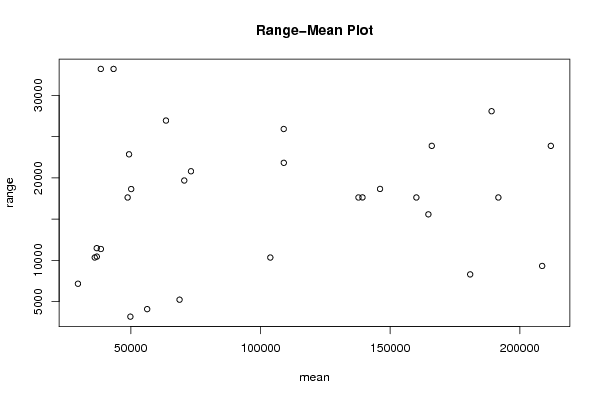
SectionMeanStandard DeviationRange
156319.751746.324401898654090
263568.2512990.02287334426949
349835.51498.707109478033179
438464.55405.1755753166811379
543356.515314.1353548533205
636872.755680.3527105864411480
736900.54390.5360720531610457
838434.2515339.547089685133205
936105.754414.9264527660410347
1029624.252955.515564161357167
1148785.759621.746528047817625
12501478179.7513409638618648
1349324.259941.307807158322859
1468799.752472.205543639125234
1570616.758067.0161924964619680
1673205.758722.4657589850520804
17103796.254473.932377301510346
18108997.259558.9280213142421826
19108969.511005.466959652425926
20137793.257672.1627709097317625
21146099.59180.3522626676318658
221393327721.6027265501517635
23160110.57642.2331160466417625
24166055.511657.845012408323882
251647476529.454699028615580
261808614086.595404490158301
27189116.515326.724579417928082
28191728.757733.492155337517625
29208614.754865.042471551519324
30211970.2511484.358823344623881

\begin{tabular}{lllllllll}
\hline
Standard Deviation-Mean Plot \tabularnewline
Section & Mean & Standard Deviation & Range \tabularnewline
1 & 56319.75 & 1746.32440189865 & 4090 \tabularnewline
2 & 63568.25 & 12990.022873344 & 26949 \tabularnewline
3 & 49835.5 & 1498.70710947803 & 3179 \tabularnewline
4 & 38464.5 & 5405.17557531668 & 11379 \tabularnewline
5 & 43356.5 & 15314.13535485 & 33205 \tabularnewline
6 & 36872.75 & 5680.35271058644 & 11480 \tabularnewline
7 & 36900.5 & 4390.53607205316 & 10457 \tabularnewline
8 & 38434.25 & 15339.5470896851 & 33205 \tabularnewline
9 & 36105.75 & 4414.92645276604 & 10347 \tabularnewline
10 & 29624.25 & 2955.51556416135 & 7167 \tabularnewline
11 & 48785.75 & 9621.7465280478 & 17625 \tabularnewline
12 & 50147 & 8179.75134096386 & 18648 \tabularnewline
13 & 49324.25 & 9941.3078071583 & 22859 \tabularnewline
14 & 68799.75 & 2472.20554363912 & 5234 \tabularnewline
15 & 70616.75 & 8067.01619249646 & 19680 \tabularnewline
16 & 73205.75 & 8722.46575898505 & 20804 \tabularnewline
17 & 103796.25 & 4473.9323773015 & 10346 \tabularnewline
18 & 108997.25 & 9558.92802131424 & 21826 \tabularnewline
19 & 108969.5 & 11005.4669596524 & 25926 \tabularnewline
20 & 137793.25 & 7672.16277090973 & 17625 \tabularnewline
21 & 146099.5 & 9180.35226266763 & 18658 \tabularnewline
22 & 139332 & 7721.60272655015 & 17635 \tabularnewline
23 & 160110.5 & 7642.23311604664 & 17625 \tabularnewline
24 & 166055.5 & 11657.8450124083 & 23882 \tabularnewline
25 & 164747 & 6529.4546990286 & 15580 \tabularnewline
26 & 180861 & 4086.59540449015 & 8301 \tabularnewline
27 & 189116.5 & 15326.7245794179 & 28082 \tabularnewline
28 & 191728.75 & 7733.4921553375 & 17625 \tabularnewline
29 & 208614.75 & 4865.04247155151 & 9324 \tabularnewline
30 & 211970.25 & 11484.3588233446 & 23881 \tabularnewline
\hline
\end{tabular}
%Source: https://freestatistics.org/blog/index.php?pk=123769&T=1

[TABLE]
[ROW][C]Standard Deviation-Mean Plot[/C][/ROW]
[ROW][C]Section[/C][C]Mean[/C][C]Standard Deviation[/C][C]Range[/C][/ROW]
[ROW][C]1[/C][C]56319.75[/C][C]1746.32440189865[/C][C]4090[/C][/ROW]
[ROW][C]2[/C][C]63568.25[/C][C]12990.022873344[/C][C]26949[/C][/ROW]
[ROW][C]3[/C][C]49835.5[/C][C]1498.70710947803[/C][C]3179[/C][/ROW]
[ROW][C]4[/C][C]38464.5[/C][C]5405.17557531668[/C][C]11379[/C][/ROW]
[ROW][C]5[/C][C]43356.5[/C][C]15314.13535485[/C][C]33205[/C][/ROW]
[ROW][C]6[/C][C]36872.75[/C][C]5680.35271058644[/C][C]11480[/C][/ROW]
[ROW][C]7[/C][C]36900.5[/C][C]4390.53607205316[/C][C]10457[/C][/ROW]
[ROW][C]8[/C][C]38434.25[/C][C]15339.5470896851[/C][C]33205[/C][/ROW]
[ROW][C]9[/C][C]36105.75[/C][C]4414.92645276604[/C][C]10347[/C][/ROW]
[ROW][C]10[/C][C]29624.25[/C][C]2955.51556416135[/C][C]7167[/C][/ROW]
[ROW][C]11[/C][C]48785.75[/C][C]9621.7465280478[/C][C]17625[/C][/ROW]
[ROW][C]12[/C][C]50147[/C][C]8179.75134096386[/C][C]18648[/C][/ROW]
[ROW][C]13[/C][C]49324.25[/C][C]9941.3078071583[/C][C]22859[/C][/ROW]
[ROW][C]14[/C][C]68799.75[/C][C]2472.20554363912[/C][C]5234[/C][/ROW]
[ROW][C]15[/C][C]70616.75[/C][C]8067.01619249646[/C][C]19680[/C][/ROW]
[ROW][C]16[/C][C]73205.75[/C][C]8722.46575898505[/C][C]20804[/C][/ROW]
[ROW][C]17[/C][C]103796.25[/C][C]4473.9323773015[/C][C]10346[/C][/ROW]
[ROW][C]18[/C][C]108997.25[/C][C]9558.92802131424[/C][C]21826[/C][/ROW]
[ROW][C]19[/C][C]108969.5[/C][C]11005.4669596524[/C][C]25926[/C][/ROW]
[ROW][C]20[/C][C]137793.25[/C][C]7672.16277090973[/C][C]17625[/C][/ROW]
[ROW][C]21[/C][C]146099.5[/C][C]9180.35226266763[/C][C]18658[/C][/ROW]
[ROW][C]22[/C][C]139332[/C][C]7721.60272655015[/C][C]17635[/C][/ROW]
[ROW][C]23[/C][C]160110.5[/C][C]7642.23311604664[/C][C]17625[/C][/ROW]
[ROW][C]24[/C][C]166055.5[/C][C]11657.8450124083[/C][C]23882[/C][/ROW]
[ROW][C]25[/C][C]164747[/C][C]6529.4546990286[/C][C]15580[/C][/ROW]
[ROW][C]26[/C][C]180861[/C][C]4086.59540449015[/C][C]8301[/C][/ROW]
[ROW][C]27[/C][C]189116.5[/C][C]15326.7245794179[/C][C]28082[/C][/ROW]
[ROW][C]28[/C][C]191728.75[/C][C]7733.4921553375[/C][C]17625[/C][/ROW]
[ROW][C]29[/C][C]208614.75[/C][C]4865.04247155151[/C][C]9324[/C][/ROW]
[ROW][C]30[/C][C]211970.25[/C][C]11484.3588233446[/C][C]23881[/C][/ROW]
[/TABLE]
Source: https://freestatistics.org/blog/index.php?pk=123769&T=1

Globally Unique Identifier (entire table): ba.freestatistics.org/blog/index.php?pk=123769&T=1

As an alternative you can also use a QR Code:  

The GUIDs for individual cells are displayed in the table below:

Standard Deviation-Mean Plot
SectionMeanStandard DeviationRange
156319.751746.324401898654090
263568.2512990.02287334426949
349835.51498.707109478033179
438464.55405.1755753166811379
543356.515314.1353548533205
636872.755680.3527105864411480
736900.54390.5360720531610457
838434.2515339.547089685133205
936105.754414.9264527660410347
1029624.252955.515564161357167
1148785.759621.746528047817625
12501478179.7513409638618648
1349324.259941.307807158322859
1468799.752472.205543639125234
1570616.758067.0161924964619680
1673205.758722.4657589850520804
17103796.254473.932377301510346
18108997.259558.9280213142421826
19108969.511005.466959652425926
20137793.257672.1627709097317625
21146099.59180.3522626676318658
221393327721.6027265501517635
23160110.57642.2331160466417625
24166055.511657.845012408323882
251647476529.454699028615580
261808614086.595404490158301
27189116.515326.724579417928082
28191728.757733.492155337517625
29208614.754865.042471551519324
30211970.2511484.358823344623881


Regression: S.E.(k) = alpha + beta * Mean(k)
alpha6767.90959401574
beta0.0108492811071164
S.D.0.0119471010481412
T-STAT0.908109930886069
p-value0.371570280601432

\begin{tabular}{lllllllll}
\hline
Regression: S.E.(k) = alpha + beta * Mean(k) \tabularnewline
alpha & 6767.90959401574 \tabularnewline
beta & 0.0108492811071164 \tabularnewline
S.D. & 0.0119471010481412 \tabularnewline
T-STAT & 0.908109930886069 \tabularnewline
p-value & 0.371570280601432 \tabularnewline
\hline
\end{tabular}
%Source: https://freestatistics.org/blog/index.php?pk=123769&T=2

[TABLE]
[ROW][C]Regression: S.E.(k) = alpha + beta * Mean(k)[/C][/ROW]
[ROW][C]alpha[/C][C]6767.90959401574[/C][/ROW]
[ROW][C]beta[/C][C]0.0108492811071164[/C][/ROW]
[ROW][C]S.D.[/C][C]0.0119471010481412[/C][/ROW]
[ROW][C]T-STAT[/C][C]0.908109930886069[/C][/ROW]
[ROW][C]p-value[/C][C]0.371570280601432[/C][/ROW]
[/TABLE]
Source: https://freestatistics.org/blog/index.php?pk=123769&T=2

Globally Unique Identifier (entire table): ba.freestatistics.org/blog/index.php?pk=123769&T=2

As an alternative you can also use a QR Code:  

The GUIDs for individual cells are displayed in the table below:

Regression: S.E.(k) = alpha + beta * Mean(k)
alpha6767.90959401574
beta0.0108492811071164
S.D.0.0119471010481412
T-STAT0.908109930886069
p-value0.371570280601432


Regression: ln S.E.(k) = alpha + beta * ln Mean(k)
alpha6.09012976466114
beta0.240951257444471
S.D.0.171318093526714
T-STAT1.40645539816784
p-value0.170591108178072
Lambda0.75904874255553

\begin{tabular}{lllllllll}
\hline
Regression: ln S.E.(k) = alpha + beta * ln Mean(k) \tabularnewline
alpha & 6.09012976466114 \tabularnewline
beta & 0.240951257444471 \tabularnewline
S.D. & 0.171318093526714 \tabularnewline
T-STAT & 1.40645539816784 \tabularnewline
p-value & 0.170591108178072 \tabularnewline
Lambda & 0.75904874255553 \tabularnewline
\hline
\end{tabular}
%Source: https://freestatistics.org/blog/index.php?pk=123769&T=3

[TABLE]
[ROW][C]Regression: ln S.E.(k) = alpha + beta * ln Mean(k)[/C][/ROW]
[ROW][C]alpha[/C][C]6.09012976466114[/C][/ROW]
[ROW][C]beta[/C][C]0.240951257444471[/C][/ROW]
[ROW][C]S.D.[/C][C]0.171318093526714[/C][/ROW]
[ROW][C]T-STAT[/C][C]1.40645539816784[/C][/ROW]
[ROW][C]p-value[/C][C]0.170591108178072[/C][/ROW]
[ROW][C]Lambda[/C][C]0.75904874255553[/C][/ROW]
[/TABLE]
Source: https://freestatistics.org/blog/index.php?pk=123769&T=3

Globally Unique Identifier (entire table): ba.freestatistics.org/blog/index.php?pk=123769&T=3

As an alternative you can also use a QR Code:  

The GUIDs for individual cells are displayed in the table below:

Regression: ln S.E.(k) = alpha + beta * ln Mean(k)
alpha6.09012976466114
beta0.240951257444471
S.D.0.171318093526714
T-STAT1.40645539816784
p-value0.170591108178072
Lambda0.75904874255553


Parameters (Session):
par1 = 4 ;
Parameters (R input):
par1 = 4 ;
R code (references can be found in the software module):
par1 <- as.numeric(par1)
(n <- length(x))
(np <- floor(n / par1))
arr <- array(NA,dim=c(par1,np))
j <- 0
k <- 1
for (i in 1:(np*par1))
{
j = j + 1
arr[j,k] <- x[i]
if (j == par1) {
j = 0
k=k+1
}
}
arr
arr.mean <- array(NA,dim=np)
arr.sd <- array(NA,dim=np)
arr.range <- array(NA,dim=np)
for (j in 1:np)
{
arr.mean[j] <- mean(arr[,j],na.rm=TRUE)
arr.sd[j] <- sd(arr[,j],na.rm=TRUE)
arr.range[j] <- max(arr[,j],na.rm=TRUE) - min(arr[,j],na.rm=TRUE)
}
arr.mean
arr.sd
arr.range
(lm1 <- lm(arr.sd~arr.mean))
(lnlm1 <- lm(log(arr.sd)~log(arr.mean)))
(lm2 <- lm(arr.range~arr.mean))
bitmap(file='test1.png')
plot(arr.mean,arr.sd,main='Standard Deviation-Mean Plot',xlab='mean',ylab='standard deviation')
dev.off()
bitmap(file='test2.png')
plot(arr.mean,arr.range,main='Range-Mean Plot',xlab='mean',ylab='range')
dev.off()
load(file='createtable')
a<-table.start()
a<-table.row.start(a)
a<-table.element(a,'Standard Deviation-Mean Plot',4,TRUE)
a<-table.row.end(a)
a<-table.row.start(a)
a<-table.element(a,'Section',header=TRUE)
a<-table.element(a,'Mean',header=TRUE)
a<-table.element(a,'Standard Deviation',header=TRUE)
a<-table.element(a,'Range',header=TRUE)
a<-table.row.end(a)
for (j in 1:np) {
a<-table.row.start(a)
a<-table.element(a,j,header=TRUE)
a<-table.element(a,arr.mean[j])
a<-table.element(a,arr.sd[j] )
a<-table.element(a,arr.range[j] )
a<-table.row.end(a)
}
a<-table.end(a)
table.save(a,file='mytable.tab')
a<-table.start()
a<-table.row.start(a)
a<-table.element(a,'Regression: S.E.(k) = alpha + beta * Mean(k)',2,TRUE)
a<-table.row.end(a)
a<-table.row.start(a)
a<-table.element(a,'alpha',header=TRUE)
a<-table.element(a,lm1$coefficients[[1]])
a<-table.row.end(a)
a<-table.row.start(a)
a<-table.element(a,'beta',header=TRUE)
a<-table.element(a,lm1$coefficients[[2]])
a<-table.row.end(a)
a<-table.row.start(a)
a<-table.element(a,'S.D.',header=TRUE)
a<-table.element(a,summary(lm1)$coefficients[2,2])
a<-table.row.end(a)
a<-table.row.start(a)
a<-table.element(a,'T-STAT',header=TRUE)
a<-table.element(a,summary(lm1)$coefficients[2,3])
a<-table.row.end(a)
a<-table.row.start(a)
a<-table.element(a,'p-value',header=TRUE)
a<-table.element(a,summary(lm1)$coefficients[2,4])
a<-table.row.end(a)
a<-table.end(a)
table.save(a,file='mytable1.tab')
a<-table.start()
a<-table.row.start(a)
a<-table.element(a,'Regression: ln S.E.(k) = alpha + beta * ln Mean(k)',2,TRUE)
a<-table.row.end(a)
a<-table.row.start(a)
a<-table.element(a,'alpha',header=TRUE)
a<-table.element(a,lnlm1$coefficients[[1]])
a<-table.row.end(a)
a<-table.row.start(a)
a<-table.element(a,'beta',header=TRUE)
a<-table.element(a,lnlm1$coefficients[[2]])
a<-table.row.end(a)
a<-table.row.start(a)
a<-table.element(a,'S.D.',header=TRUE)
a<-table.element(a,summary(lnlm1)$coefficients[2,2])
a<-table.row.end(a)
a<-table.row.start(a)
a<-table.element(a,'T-STAT',header=TRUE)
a<-table.element(a,summary(lnlm1)$coefficients[2,3])
a<-table.row.end(a)
a<-table.row.start(a)
a<-table.element(a,'p-value',header=TRUE)
a<-table.element(a,summary(lnlm1)$coefficients[2,4])
a<-table.row.end(a)
a<-table.row.start(a)
a<-table.element(a,'Lambda',header=TRUE)
a<-table.element(a,1-lnlm1$coefficients[[2]])
a<-table.row.end(a)
a<-table.end(a)
table.save(a,file='mytable2.tab')