Free Statistics

of Irreproducible Research!

Author's title

Author*The author of this computation has been verified*
R Software Modulerwasp_exponentialsmoothing.wasp
Title produced by softwareExponential Smoothing
Date of computationThu, 01 Dec 2011 06:31:03 -0500
Cite this page as followsStatistical Computations at FreeStatistics.org, Office for Research Development and Education, URL https://freestatistics.org/blog/index.php?v=date/2011/Dec/01/t1322739093ke7q1n7n6k6ic6x.htm/, Retrieved Mon, 29 Apr 2024 15:16:52 +0000
Statistical Computations at FreeStatistics.org, Office for Research Development and Education, URL https://freestatistics.org/blog/index.php?pk=149212, Retrieved Mon, 29 Apr 2024 15:16:52 +0000
QR Codes:

Original text written by user:
IsPrivate?No (this computation is public)
User-defined keywords
Estimated Impact133
Family? (F = Feedback message, R = changed R code, M = changed R Module, P = changed Parameters, D = changed Data)
-     [Univariate Explorative Data Analysis] [Monthly US soldie...] [2010-11-02 12:07:39] [b98453cac15ba1066b407e146608df68]
- R P   [Univariate Explorative Data Analysis] [Workshop 8] [2011-12-01 11:10:45] [07b2c5c51166cb60d3a449987e886a27]
- RMP       [Exponential Smoothing] [Workshop 8 (1) ] [2011-12-01 11:31:03] [8ccb8599b802845e9be7b9afcc742f78] [Current]
Feedback Forum

Post a new message
Dataseries X:
37
30
47
35
30
43
82
40
47
19
52
136
80
42
54
66
81
63
137
72
107
58
36
52
79
77
54
84
48
96
83
66
61
53
30
74
69
59
42
65
70
100
63
105
82
81
75
102
121
98
76
77
63
37
35
23
40
29
37
51
20
28
13
22
25
13
16
13
16
17
9
17
25
14
8
7
10
7
10
3


Summary of computational transaction
Raw Inputview raw input (R code)
Raw Outputview raw output of R engine
Computing time2 seconds
R Server'Gertrude Mary Cox' @ cox.wessa.net

\begin{tabular}{lllllllll}
\hline
Summary of computational transaction \tabularnewline
Raw Input & view raw input (R code)  \tabularnewline
Raw Output & view raw output of R engine  \tabularnewline
Computing time & 2 seconds \tabularnewline
R Server & 'Gertrude Mary Cox' @ cox.wessa.net \tabularnewline
\hline
\end{tabular}
%Source: https://freestatistics.org/blog/index.php?pk=149212&T=0

[TABLE]
[ROW][C]Summary of computational transaction[/C][/ROW]
[ROW][C]Raw Input[/C][C]view raw input (R code) [/C][/ROW]
[ROW][C]Raw Output[/C][C]view raw output of R engine [/C][/ROW]
[ROW][C]Computing time[/C][C]2 seconds[/C][/ROW]
[ROW][C]R Server[/C][C]'Gertrude Mary Cox' @ cox.wessa.net[/C][/ROW]
[/TABLE]
Source: https://freestatistics.org/blog/index.php?pk=149212&T=0

Globally Unique Identifier (entire table): ba.freestatistics.org/blog/index.php?pk=149212&T=0

As an alternative you can also use a QR Code:  

The GUIDs for individual cells are displayed in the table below:

Summary of computational transaction
Raw Inputview raw input (R code)
Raw Outputview raw output of R engine
Computing time2 seconds
R Server'Gertrude Mary Cox' @ cox.wessa.net


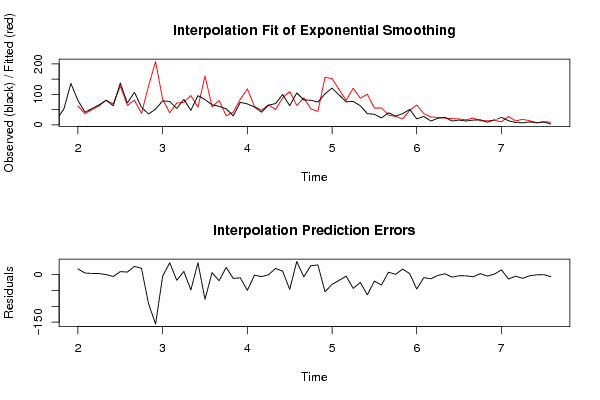
Estimated Parameters of Exponential Smoothing
ParameterValue
alpha0.508264392434624
beta0.0121485853197237
gamma0.979025134159377

\begin{tabular}{lllllllll}
\hline
Estimated Parameters of Exponential Smoothing \tabularnewline
Parameter & Value \tabularnewline
alpha & 0.508264392434624 \tabularnewline
beta & 0.0121485853197237 \tabularnewline
gamma & 0.979025134159377 \tabularnewline
\hline
\end{tabular}
%Source: https://freestatistics.org/blog/index.php?pk=149212&T=1

[TABLE]
[ROW][C]Estimated Parameters of Exponential Smoothing[/C][/ROW]
[ROW][C]Parameter[/C][C]Value[/C][/ROW]
[ROW][C]alpha[/C][C]0.508264392434624[/C][/ROW]
[ROW][C]beta[/C][C]0.0121485853197237[/C][/ROW]
[ROW][C]gamma[/C][C]0.979025134159377[/C][/ROW]
[/TABLE]
Source: https://freestatistics.org/blog/index.php?pk=149212&T=1

Globally Unique Identifier (entire table): ba.freestatistics.org/blog/index.php?pk=149212&T=1

As an alternative you can also use a QR Code:  

The GUIDs for individual cells are displayed in the table below:

Estimated Parameters of Exponential Smoothing
ParameterValue
alpha0.508264392434624
beta0.0121485853197237
gamma0.979025134159377


Interpolation Forecasts of Exponential Smoothing
tObservedFittedResiduals
138062.085248919157717.9147510808423
144237.06931422146524.93068577853484
155450.26245732547553.73754267452446
166662.74498809362433.25501190637567
178180.99049500860180.00950499139824501
186368.9357142664032-5.93571426640315
19137127.6822835606719.31771643932878
207263.93989650363258.06010349636755
2110781.265344025511325.7346559744887
225838.10332245867619.896677541324
2336127.400100077271-91.4001000772712
2452207.755430375586-155.755430375586
257983.9720467922538-4.97204679225385
267739.803295975169437.1967040248306
275471.8562522685229-17.8562522685229
288474.14213118137889.85786881862123
294896.372330335981-48.372330335981
309658.292609017279737.7073909827203
3183160.804925830844-77.8049258308437
326659.71642147546586.28357852453421
336180.2620666352152-19.2620666352152
345330.240309346133122.7596906538669
353042.1008083103263-12.1008083103263
367483.9962956782891-9.99629567828912
3769118.499265778722-49.4992657787218
385960.7944264492036-1.7944264492036
394248.4648725892409-6.4648725892409
406565.4427349518743-0.442734951874314
417050.608919588165619.3910804118344
4210089.009263193434910.9907368065651
4363109.593890953947-46.5938909539475
4410563.865629509893541.1343704901065
458289.0076172144237-7.00761721442368
468152.848154496568428.1518455034316
477544.672478473201430.3275215267986
48102155.951624760753-53.9516247607527
49121151.815615614091-30.8156156140915
5098116.103656058164-18.1036560581635
517680.9242370425471-4.92423704254708
5277120.331036228104-43.3310362281039
536387.587920514926-24.587920514926
5437100.64616837282-63.64616837282
553555.3707922763358-20.3707922763358
562355.8437628857082-32.8437628857082
574032.27392055538647.72607944461357
582928.17245846793990.82754153206011
593719.812921829089917.1870781709101
605147.77476297963453.22523702036547
612065.3647846084341-45.3647846084341
622837.4383425490945-9.43834254909454
631326.2915101865408-13.2915101865408
642224.6422453649286-2.64224536492863
652522.44042488095912.55957511904086
661321.0014091160539-8.00140911605391
671619.6310715708034-3.63107157080337
681316.9316829363479-3.93168293634785
691622.8541741412014-6.85417414120143
701713.98538386266033.01461613733969
71913.7656378268624-4.7656378268624
721715.4008757793581.59912422064199
732510.189803598938914.8101964010611
741427.8626917790798-13.8626917790798
75813.1100219029194-5.11002190291944
76718.6370772937744-11.6370772937744
771013.7236343821553-3.72363438215529
7877.76991313461519-0.769913134615187
791010.0613597590593-0.0613597590592896
8039.29723138677711-6.29723138677711

\begin{tabular}{lllllllll}
\hline
Interpolation Forecasts of Exponential Smoothing \tabularnewline
t & Observed & Fitted & Residuals \tabularnewline
13 & 80 & 62.0852489191577 & 17.9147510808423 \tabularnewline
14 & 42 & 37.0693142214652 & 4.93068577853484 \tabularnewline
15 & 54 & 50.2624573254755 & 3.73754267452446 \tabularnewline
16 & 66 & 62.7449880936243 & 3.25501190637567 \tabularnewline
17 & 81 & 80.9904950086018 & 0.00950499139824501 \tabularnewline
18 & 63 & 68.9357142664032 & -5.93571426640315 \tabularnewline
19 & 137 & 127.682283560671 & 9.31771643932878 \tabularnewline
20 & 72 & 63.9398965036325 & 8.06010349636755 \tabularnewline
21 & 107 & 81.2653440255113 & 25.7346559744887 \tabularnewline
22 & 58 & 38.103322458676 & 19.896677541324 \tabularnewline
23 & 36 & 127.400100077271 & -91.4001000772712 \tabularnewline
24 & 52 & 207.755430375586 & -155.755430375586 \tabularnewline
25 & 79 & 83.9720467922538 & -4.97204679225385 \tabularnewline
26 & 77 & 39.8032959751694 & 37.1967040248306 \tabularnewline
27 & 54 & 71.8562522685229 & -17.8562522685229 \tabularnewline
28 & 84 & 74.1421311813788 & 9.85786881862123 \tabularnewline
29 & 48 & 96.372330335981 & -48.372330335981 \tabularnewline
30 & 96 & 58.2926090172797 & 37.7073909827203 \tabularnewline
31 & 83 & 160.804925830844 & -77.8049258308437 \tabularnewline
32 & 66 & 59.7164214754658 & 6.28357852453421 \tabularnewline
33 & 61 & 80.2620666352152 & -19.2620666352152 \tabularnewline
34 & 53 & 30.2403093461331 & 22.7596906538669 \tabularnewline
35 & 30 & 42.1008083103263 & -12.1008083103263 \tabularnewline
36 & 74 & 83.9962956782891 & -9.99629567828912 \tabularnewline
37 & 69 & 118.499265778722 & -49.4992657787218 \tabularnewline
38 & 59 & 60.7944264492036 & -1.7944264492036 \tabularnewline
39 & 42 & 48.4648725892409 & -6.4648725892409 \tabularnewline
40 & 65 & 65.4427349518743 & -0.442734951874314 \tabularnewline
41 & 70 & 50.6089195881656 & 19.3910804118344 \tabularnewline
42 & 100 & 89.0092631934349 & 10.9907368065651 \tabularnewline
43 & 63 & 109.593890953947 & -46.5938909539475 \tabularnewline
44 & 105 & 63.8656295098935 & 41.1343704901065 \tabularnewline
45 & 82 & 89.0076172144237 & -7.00761721442368 \tabularnewline
46 & 81 & 52.8481544965684 & 28.1518455034316 \tabularnewline
47 & 75 & 44.6724784732014 & 30.3275215267986 \tabularnewline
48 & 102 & 155.951624760753 & -53.9516247607527 \tabularnewline
49 & 121 & 151.815615614091 & -30.8156156140915 \tabularnewline
50 & 98 & 116.103656058164 & -18.1036560581635 \tabularnewline
51 & 76 & 80.9242370425471 & -4.92423704254708 \tabularnewline
52 & 77 & 120.331036228104 & -43.3310362281039 \tabularnewline
53 & 63 & 87.587920514926 & -24.587920514926 \tabularnewline
54 & 37 & 100.64616837282 & -63.64616837282 \tabularnewline
55 & 35 & 55.3707922763358 & -20.3707922763358 \tabularnewline
56 & 23 & 55.8437628857082 & -32.8437628857082 \tabularnewline
57 & 40 & 32.2739205553864 & 7.72607944461357 \tabularnewline
58 & 29 & 28.1724584679399 & 0.82754153206011 \tabularnewline
59 & 37 & 19.8129218290899 & 17.1870781709101 \tabularnewline
60 & 51 & 47.7747629796345 & 3.22523702036547 \tabularnewline
61 & 20 & 65.3647846084341 & -45.3647846084341 \tabularnewline
62 & 28 & 37.4383425490945 & -9.43834254909454 \tabularnewline
63 & 13 & 26.2915101865408 & -13.2915101865408 \tabularnewline
64 & 22 & 24.6422453649286 & -2.64224536492863 \tabularnewline
65 & 25 & 22.4404248809591 & 2.55957511904086 \tabularnewline
66 & 13 & 21.0014091160539 & -8.00140911605391 \tabularnewline
67 & 16 & 19.6310715708034 & -3.63107157080337 \tabularnewline
68 & 13 & 16.9316829363479 & -3.93168293634785 \tabularnewline
69 & 16 & 22.8541741412014 & -6.85417414120143 \tabularnewline
70 & 17 & 13.9853838626603 & 3.01461613733969 \tabularnewline
71 & 9 & 13.7656378268624 & -4.7656378268624 \tabularnewline
72 & 17 & 15.400875779358 & 1.59912422064199 \tabularnewline
73 & 25 & 10.1898035989389 & 14.8101964010611 \tabularnewline
74 & 14 & 27.8626917790798 & -13.8626917790798 \tabularnewline
75 & 8 & 13.1100219029194 & -5.11002190291944 \tabularnewline
76 & 7 & 18.6370772937744 & -11.6370772937744 \tabularnewline
77 & 10 & 13.7236343821553 & -3.72363438215529 \tabularnewline
78 & 7 & 7.76991313461519 & -0.769913134615187 \tabularnewline
79 & 10 & 10.0613597590593 & -0.0613597590592896 \tabularnewline
80 & 3 & 9.29723138677711 & -6.29723138677711 \tabularnewline
\hline
\end{tabular}
%Source: https://freestatistics.org/blog/index.php?pk=149212&T=2

[TABLE]
[ROW][C]Interpolation Forecasts of Exponential Smoothing[/C][/ROW]
[ROW][C]t[/C][C]Observed[/C][C]Fitted[/C][C]Residuals[/C][/ROW]
[ROW][C]13[/C][C]80[/C][C]62.0852489191577[/C][C]17.9147510808423[/C][/ROW]
[ROW][C]14[/C][C]42[/C][C]37.0693142214652[/C][C]4.93068577853484[/C][/ROW]
[ROW][C]15[/C][C]54[/C][C]50.2624573254755[/C][C]3.73754267452446[/C][/ROW]
[ROW][C]16[/C][C]66[/C][C]62.7449880936243[/C][C]3.25501190637567[/C][/ROW]
[ROW][C]17[/C][C]81[/C][C]80.9904950086018[/C][C]0.00950499139824501[/C][/ROW]
[ROW][C]18[/C][C]63[/C][C]68.9357142664032[/C][C]-5.93571426640315[/C][/ROW]
[ROW][C]19[/C][C]137[/C][C]127.682283560671[/C][C]9.31771643932878[/C][/ROW]
[ROW][C]20[/C][C]72[/C][C]63.9398965036325[/C][C]8.06010349636755[/C][/ROW]
[ROW][C]21[/C][C]107[/C][C]81.2653440255113[/C][C]25.7346559744887[/C][/ROW]
[ROW][C]22[/C][C]58[/C][C]38.103322458676[/C][C]19.896677541324[/C][/ROW]
[ROW][C]23[/C][C]36[/C][C]127.400100077271[/C][C]-91.4001000772712[/C][/ROW]
[ROW][C]24[/C][C]52[/C][C]207.755430375586[/C][C]-155.755430375586[/C][/ROW]
[ROW][C]25[/C][C]79[/C][C]83.9720467922538[/C][C]-4.97204679225385[/C][/ROW]
[ROW][C]26[/C][C]77[/C][C]39.8032959751694[/C][C]37.1967040248306[/C][/ROW]
[ROW][C]27[/C][C]54[/C][C]71.8562522685229[/C][C]-17.8562522685229[/C][/ROW]
[ROW][C]28[/C][C]84[/C][C]74.1421311813788[/C][C]9.85786881862123[/C][/ROW]
[ROW][C]29[/C][C]48[/C][C]96.372330335981[/C][C]-48.372330335981[/C][/ROW]
[ROW][C]30[/C][C]96[/C][C]58.2926090172797[/C][C]37.7073909827203[/C][/ROW]
[ROW][C]31[/C][C]83[/C][C]160.804925830844[/C][C]-77.8049258308437[/C][/ROW]
[ROW][C]32[/C][C]66[/C][C]59.7164214754658[/C][C]6.28357852453421[/C][/ROW]
[ROW][C]33[/C][C]61[/C][C]80.2620666352152[/C][C]-19.2620666352152[/C][/ROW]
[ROW][C]34[/C][C]53[/C][C]30.2403093461331[/C][C]22.7596906538669[/C][/ROW]
[ROW][C]35[/C][C]30[/C][C]42.1008083103263[/C][C]-12.1008083103263[/C][/ROW]
[ROW][C]36[/C][C]74[/C][C]83.9962956782891[/C][C]-9.99629567828912[/C][/ROW]
[ROW][C]37[/C][C]69[/C][C]118.499265778722[/C][C]-49.4992657787218[/C][/ROW]
[ROW][C]38[/C][C]59[/C][C]60.7944264492036[/C][C]-1.7944264492036[/C][/ROW]
[ROW][C]39[/C][C]42[/C][C]48.4648725892409[/C][C]-6.4648725892409[/C][/ROW]
[ROW][C]40[/C][C]65[/C][C]65.4427349518743[/C][C]-0.442734951874314[/C][/ROW]
[ROW][C]41[/C][C]70[/C][C]50.6089195881656[/C][C]19.3910804118344[/C][/ROW]
[ROW][C]42[/C][C]100[/C][C]89.0092631934349[/C][C]10.9907368065651[/C][/ROW]
[ROW][C]43[/C][C]63[/C][C]109.593890953947[/C][C]-46.5938909539475[/C][/ROW]
[ROW][C]44[/C][C]105[/C][C]63.8656295098935[/C][C]41.1343704901065[/C][/ROW]
[ROW][C]45[/C][C]82[/C][C]89.0076172144237[/C][C]-7.00761721442368[/C][/ROW]
[ROW][C]46[/C][C]81[/C][C]52.8481544965684[/C][C]28.1518455034316[/C][/ROW]
[ROW][C]47[/C][C]75[/C][C]44.6724784732014[/C][C]30.3275215267986[/C][/ROW]
[ROW][C]48[/C][C]102[/C][C]155.951624760753[/C][C]-53.9516247607527[/C][/ROW]
[ROW][C]49[/C][C]121[/C][C]151.815615614091[/C][C]-30.8156156140915[/C][/ROW]
[ROW][C]50[/C][C]98[/C][C]116.103656058164[/C][C]-18.1036560581635[/C][/ROW]
[ROW][C]51[/C][C]76[/C][C]80.9242370425471[/C][C]-4.92423704254708[/C][/ROW]
[ROW][C]52[/C][C]77[/C][C]120.331036228104[/C][C]-43.3310362281039[/C][/ROW]
[ROW][C]53[/C][C]63[/C][C]87.587920514926[/C][C]-24.587920514926[/C][/ROW]
[ROW][C]54[/C][C]37[/C][C]100.64616837282[/C][C]-63.64616837282[/C][/ROW]
[ROW][C]55[/C][C]35[/C][C]55.3707922763358[/C][C]-20.3707922763358[/C][/ROW]
[ROW][C]56[/C][C]23[/C][C]55.8437628857082[/C][C]-32.8437628857082[/C][/ROW]
[ROW][C]57[/C][C]40[/C][C]32.2739205553864[/C][C]7.72607944461357[/C][/ROW]
[ROW][C]58[/C][C]29[/C][C]28.1724584679399[/C][C]0.82754153206011[/C][/ROW]
[ROW][C]59[/C][C]37[/C][C]19.8129218290899[/C][C]17.1870781709101[/C][/ROW]
[ROW][C]60[/C][C]51[/C][C]47.7747629796345[/C][C]3.22523702036547[/C][/ROW]
[ROW][C]61[/C][C]20[/C][C]65.3647846084341[/C][C]-45.3647846084341[/C][/ROW]
[ROW][C]62[/C][C]28[/C][C]37.4383425490945[/C][C]-9.43834254909454[/C][/ROW]
[ROW][C]63[/C][C]13[/C][C]26.2915101865408[/C][C]-13.2915101865408[/C][/ROW]
[ROW][C]64[/C][C]22[/C][C]24.6422453649286[/C][C]-2.64224536492863[/C][/ROW]
[ROW][C]65[/C][C]25[/C][C]22.4404248809591[/C][C]2.55957511904086[/C][/ROW]
[ROW][C]66[/C][C]13[/C][C]21.0014091160539[/C][C]-8.00140911605391[/C][/ROW]
[ROW][C]67[/C][C]16[/C][C]19.6310715708034[/C][C]-3.63107157080337[/C][/ROW]
[ROW][C]68[/C][C]13[/C][C]16.9316829363479[/C][C]-3.93168293634785[/C][/ROW]
[ROW][C]69[/C][C]16[/C][C]22.8541741412014[/C][C]-6.85417414120143[/C][/ROW]
[ROW][C]70[/C][C]17[/C][C]13.9853838626603[/C][C]3.01461613733969[/C][/ROW]
[ROW][C]71[/C][C]9[/C][C]13.7656378268624[/C][C]-4.7656378268624[/C][/ROW]
[ROW][C]72[/C][C]17[/C][C]15.400875779358[/C][C]1.59912422064199[/C][/ROW]
[ROW][C]73[/C][C]25[/C][C]10.1898035989389[/C][C]14.8101964010611[/C][/ROW]
[ROW][C]74[/C][C]14[/C][C]27.8626917790798[/C][C]-13.8626917790798[/C][/ROW]
[ROW][C]75[/C][C]8[/C][C]13.1100219029194[/C][C]-5.11002190291944[/C][/ROW]
[ROW][C]76[/C][C]7[/C][C]18.6370772937744[/C][C]-11.6370772937744[/C][/ROW]
[ROW][C]77[/C][C]10[/C][C]13.7236343821553[/C][C]-3.72363438215529[/C][/ROW]
[ROW][C]78[/C][C]7[/C][C]7.76991313461519[/C][C]-0.769913134615187[/C][/ROW]
[ROW][C]79[/C][C]10[/C][C]10.0613597590593[/C][C]-0.0613597590592896[/C][/ROW]
[ROW][C]80[/C][C]3[/C][C]9.29723138677711[/C][C]-6.29723138677711[/C][/ROW]
[/TABLE]
Source: https://freestatistics.org/blog/index.php?pk=149212&T=2

Globally Unique Identifier (entire table): ba.freestatistics.org/blog/index.php?pk=149212&T=2

As an alternative you can also use a QR Code:  

The GUIDs for individual cells are displayed in the table below:

Interpolation Forecasts of Exponential Smoothing
tObservedFittedResiduals
138062.085248919157717.9147510808423
144237.06931422146524.93068577853484
155450.26245732547553.73754267452446
166662.74498809362433.25501190637567
178180.99049500860180.00950499139824501
186368.9357142664032-5.93571426640315
19137127.6822835606719.31771643932878
207263.93989650363258.06010349636755
2110781.265344025511325.7346559744887
225838.10332245867619.896677541324
2336127.400100077271-91.4001000772712
2452207.755430375586-155.755430375586
257983.9720467922538-4.97204679225385
267739.803295975169437.1967040248306
275471.8562522685229-17.8562522685229
288474.14213118137889.85786881862123
294896.372330335981-48.372330335981
309658.292609017279737.7073909827203
3183160.804925830844-77.8049258308437
326659.71642147546586.28357852453421
336180.2620666352152-19.2620666352152
345330.240309346133122.7596906538669
353042.1008083103263-12.1008083103263
367483.9962956782891-9.99629567828912
3769118.499265778722-49.4992657787218
385960.7944264492036-1.7944264492036
394248.4648725892409-6.4648725892409
406565.4427349518743-0.442734951874314
417050.608919588165619.3910804118344
4210089.009263193434910.9907368065651
4363109.593890953947-46.5938909539475
4410563.865629509893541.1343704901065
458289.0076172144237-7.00761721442368
468152.848154496568428.1518455034316
477544.672478473201430.3275215267986
48102155.951624760753-53.9516247607527
49121151.815615614091-30.8156156140915
5098116.103656058164-18.1036560581635
517680.9242370425471-4.92423704254708
5277120.331036228104-43.3310362281039
536387.587920514926-24.587920514926
5437100.64616837282-63.64616837282
553555.3707922763358-20.3707922763358
562355.8437628857082-32.8437628857082
574032.27392055538647.72607944461357
582928.17245846793990.82754153206011
593719.812921829089917.1870781709101
605147.77476297963453.22523702036547
612065.3647846084341-45.3647846084341
622837.4383425490945-9.43834254909454
631326.2915101865408-13.2915101865408
642224.6422453649286-2.64224536492863
652522.44042488095912.55957511904086
661321.0014091160539-8.00140911605391
671619.6310715708034-3.63107157080337
681316.9316829363479-3.93168293634785
691622.8541741412014-6.85417414120143
701713.98538386266033.01461613733969
71913.7656378268624-4.7656378268624
721715.4008757793581.59912422064199
732510.189803598938914.8101964010611
741427.8626917790798-13.8626917790798
75813.1100219029194-5.11002190291944
76718.6370772937744-11.6370772937744
771013.7236343821553-3.72363438215529
7877.76991313461519-0.769913134615187
791010.0613597590593-0.0613597590592896
8039.29723138677711-6.29723138677711


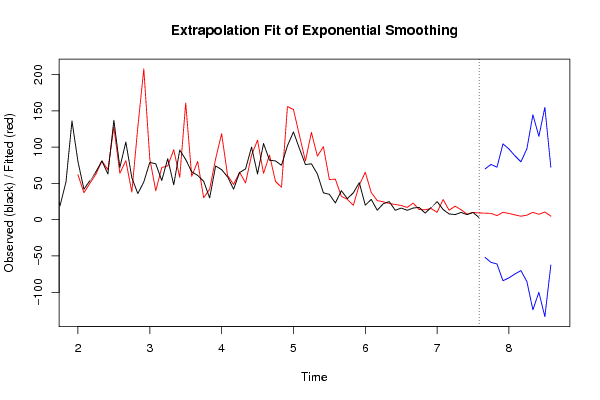
Extrapolation Forecasts of Exponential Smoothing
tForecast95% Lower Bound95% Upper Bound
818.99905097450173-51.935306911663569.933408860667
828.65140459552228-58.855928028003676.1587372190481
835.66441924523338-61.007434637614572.3362731280813
8410.1648195622573-84.1446639296397104.474303054154
858.61507856003649-80.194575840717997.4247329607909
866.6656307142292-74.771411351300288.1026727797586
874.78378211877638-70.171899912608979.7394641501617
886.23643494043251-85.296832179099197.7697020599641
8910.1808474630254-124.218650414045144.580345340096
907.44390546146279-100.018195959627114.906006882553
9110.5878982291931-133.626573696998154.802370155384
924.91873234702756-62.5342195948572.3716842889051

\begin{tabular}{lllllllll}
\hline
Extrapolation Forecasts of Exponential Smoothing \tabularnewline
t & Forecast & 95% Lower Bound & 95% Upper Bound \tabularnewline
81 & 8.99905097450173 & -51.9353069116635 & 69.933408860667 \tabularnewline
82 & 8.65140459552228 & -58.8559280280036 & 76.1587372190481 \tabularnewline
83 & 5.66441924523338 & -61.0074346376145 & 72.3362731280813 \tabularnewline
84 & 10.1648195622573 & -84.1446639296397 & 104.474303054154 \tabularnewline
85 & 8.61507856003649 & -80.1945758407179 & 97.4247329607909 \tabularnewline
86 & 6.6656307142292 & -74.7714113513002 & 88.1026727797586 \tabularnewline
87 & 4.78378211877638 & -70.1718999126089 & 79.7394641501617 \tabularnewline
88 & 6.23643494043251 & -85.2968321790991 & 97.7697020599641 \tabularnewline
89 & 10.1808474630254 & -124.218650414045 & 144.580345340096 \tabularnewline
90 & 7.44390546146279 & -100.018195959627 & 114.906006882553 \tabularnewline
91 & 10.5878982291931 & -133.626573696998 & 154.802370155384 \tabularnewline
92 & 4.91873234702756 & -62.53421959485 & 72.3716842889051 \tabularnewline
\hline
\end{tabular}
%Source: https://freestatistics.org/blog/index.php?pk=149212&T=3

[TABLE]
[ROW][C]Extrapolation Forecasts of Exponential Smoothing[/C][/ROW]
[ROW][C]t[/C][C]Forecast[/C][C]95% Lower Bound[/C][C]95% Upper Bound[/C][/ROW]
[ROW][C]81[/C][C]8.99905097450173[/C][C]-51.9353069116635[/C][C]69.933408860667[/C][/ROW]
[ROW][C]82[/C][C]8.65140459552228[/C][C]-58.8559280280036[/C][C]76.1587372190481[/C][/ROW]
[ROW][C]83[/C][C]5.66441924523338[/C][C]-61.0074346376145[/C][C]72.3362731280813[/C][/ROW]
[ROW][C]84[/C][C]10.1648195622573[/C][C]-84.1446639296397[/C][C]104.474303054154[/C][/ROW]
[ROW][C]85[/C][C]8.61507856003649[/C][C]-80.1945758407179[/C][C]97.4247329607909[/C][/ROW]
[ROW][C]86[/C][C]6.6656307142292[/C][C]-74.7714113513002[/C][C]88.1026727797586[/C][/ROW]
[ROW][C]87[/C][C]4.78378211877638[/C][C]-70.1718999126089[/C][C]79.7394641501617[/C][/ROW]
[ROW][C]88[/C][C]6.23643494043251[/C][C]-85.2968321790991[/C][C]97.7697020599641[/C][/ROW]
[ROW][C]89[/C][C]10.1808474630254[/C][C]-124.218650414045[/C][C]144.580345340096[/C][/ROW]
[ROW][C]90[/C][C]7.44390546146279[/C][C]-100.018195959627[/C][C]114.906006882553[/C][/ROW]
[ROW][C]91[/C][C]10.5878982291931[/C][C]-133.626573696998[/C][C]154.802370155384[/C][/ROW]
[ROW][C]92[/C][C]4.91873234702756[/C][C]-62.53421959485[/C][C]72.3716842889051[/C][/ROW]
[/TABLE]
Source: https://freestatistics.org/blog/index.php?pk=149212&T=3

Globally Unique Identifier (entire table): ba.freestatistics.org/blog/index.php?pk=149212&T=3

As an alternative you can also use a QR Code:  

The GUIDs for individual cells are displayed in the table below:

Extrapolation Forecasts of Exponential Smoothing
tForecast95% Lower Bound95% Upper Bound
818.99905097450173-51.935306911663569.933408860667
828.65140459552228-58.855928028003676.1587372190481
835.66441924523338-61.007434637614572.3362731280813
8410.1648195622573-84.1446639296397104.474303054154
858.61507856003649-80.194575840717997.4247329607909
866.6656307142292-74.771411351300288.1026727797586
874.78378211877638-70.171899912608979.7394641501617
886.23643494043251-85.296832179099197.7697020599641
8910.1808474630254-124.218650414045144.580345340096
907.44390546146279-100.018195959627114.906006882553
9110.5878982291931-133.626573696998154.802370155384
924.91873234702756-62.5342195948572.3716842889051


Parameters (Session):
par1 = 12 ; par2 = Triple ; par3 = multiplicative ;
Parameters (R input):
par1 = 12 ; par2 = Triple ; par3 = multiplicative ;
R code (references can be found in the software module):
par1 <- as.numeric(par1)
if (par2 == 'Single') K <- 1
if (par2 == 'Double') K <- 2
if (par2 == 'Triple') K <- par1
nx <- length(x)
nxmK <- nx - K
x <- ts(x, frequency = par1)
if (par2 == 'Single') fit <- HoltWinters(x, gamma=F, beta=F)
if (par2 == 'Double') fit <- HoltWinters(x, gamma=F)
if (par2 == 'Triple') fit <- HoltWinters(x, seasonal=par3)
fit
myresid <- x - fit$fitted[,'xhat']
bitmap(file='test1.png')
op <- par(mfrow=c(2,1))
plot(fit,ylab='Observed (black) / Fitted (red)',main='Interpolation Fit of Exponential Smoothing')
plot(myresid,ylab='Residuals',main='Interpolation Prediction Errors')
par(op)
dev.off()
bitmap(file='test2.png')
p <- predict(fit, par1, prediction.interval=TRUE)
np <- length(p[,1])
plot(fit,p,ylab='Observed (black) / Fitted (red)',main='Extrapolation Fit of Exponential Smoothing')
dev.off()
bitmap(file='test3.png')
op <- par(mfrow = c(2,2))
acf(as.numeric(myresid),lag.max = nx/2,main='Residual ACF')
spectrum(myresid,main='Residals Periodogram')
cpgram(myresid,main='Residal Cumulative Periodogram')
qqnorm(myresid,main='Residual Normal QQ Plot')
qqline(myresid)
par(op)
dev.off()
load(file='createtable')
a<-table.start()
a<-table.row.start(a)
a<-table.element(a,'Estimated Parameters of Exponential Smoothing',2,TRUE)
a<-table.row.end(a)
a<-table.row.start(a)
a<-table.element(a,'Parameter',header=TRUE)
a<-table.element(a,'Value',header=TRUE)
a<-table.row.end(a)
a<-table.row.start(a)
a<-table.element(a,'alpha',header=TRUE)
a<-table.element(a,fit$alpha)
a<-table.row.end(a)
a<-table.row.start(a)
a<-table.element(a,'beta',header=TRUE)
a<-table.element(a,fit$beta)
a<-table.row.end(a)
a<-table.row.start(a)
a<-table.element(a,'gamma',header=TRUE)
a<-table.element(a,fit$gamma)
a<-table.row.end(a)
a<-table.end(a)
table.save(a,file='mytable.tab')
a<-table.start()
a<-table.row.start(a)
a<-table.element(a,'Interpolation Forecasts of Exponential Smoothing',4,TRUE)
a<-table.row.end(a)
a<-table.row.start(a)
a<-table.element(a,'t',header=TRUE)
a<-table.element(a,'Observed',header=TRUE)
a<-table.element(a,'Fitted',header=TRUE)
a<-table.element(a,'Residuals',header=TRUE)
a<-table.row.end(a)
for (i in 1:nxmK) {
a<-table.row.start(a)
a<-table.element(a,i+K,header=TRUE)
a<-table.element(a,x[i+K])
a<-table.element(a,fit$fitted[i,'xhat'])
a<-table.element(a,myresid[i])
a<-table.row.end(a)
}
a<-table.end(a)
table.save(a,file='mytable1.tab')
a<-table.start()
a<-table.row.start(a)
a<-table.element(a,'Extrapolation Forecasts of Exponential Smoothing',4,TRUE)
a<-table.row.end(a)
a<-table.row.start(a)
a<-table.element(a,'t',header=TRUE)
a<-table.element(a,'Forecast',header=TRUE)
a<-table.element(a,'95% Lower Bound',header=TRUE)
a<-table.element(a,'95% Upper Bound',header=TRUE)
a<-table.row.end(a)
for (i in 1:np) {
a<-table.row.start(a)
a<-table.element(a,nx+i,header=TRUE)
a<-table.element(a,p[i,'fit'])
a<-table.element(a,p[i,'lwr'])
a<-table.element(a,p[i,'upr'])
a<-table.row.end(a)
}
a<-table.end(a)
table.save(a,file='mytable2.tab')