Free Statistics
of Irreproducible Research!
Description of Statistical Computation | |||||||||||||||||||||||||||||||||||||||||
|---|---|---|---|---|---|---|---|---|---|---|---|---|---|---|---|---|---|---|---|---|---|---|---|---|---|---|---|---|---|---|---|---|---|---|---|---|---|---|---|---|---|
| Author's title | |||||||||||||||||||||||||||||||||||||||||
| Author | *Unverified author* | ||||||||||||||||||||||||||||||||||||||||
| R Software Module | rwasp_univariatedataseries.wasp | ||||||||||||||||||||||||||||||||||||||||
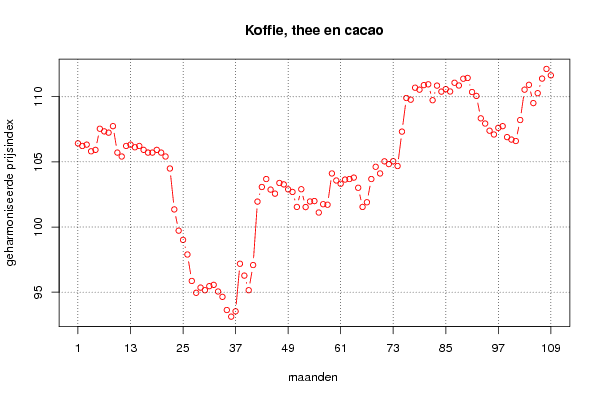
| Title produced by software | Univariate Data Series | ||||||||||||||||||||||||||||||||||||||||
| Date of computation | Thu, 10 Feb 2011 12:07:10 +0000 | ||||||||||||||||||||||||||||||||||||||||
| Cite this page as follows | Statistical Computations at FreeStatistics.org, Office for Research Development and Education, URL https://freestatistics.org/blog/index.php?v=date/2011/Feb/10/t1297340095lkht02279rjrys1.htm/, Retrieved Sun, 19 May 2024 13:17:28 +0000 | ||||||||||||||||||||||||||||||||||||||||
| Statistical Computations at FreeStatistics.org, Office for Research Development and Education, URL https://freestatistics.org/blog/index.php?pk=118153, Retrieved Sun, 19 May 2024 13:17:28 +0000 | |||||||||||||||||||||||||||||||||||||||||
| QR Codes: | |||||||||||||||||||||||||||||||||||||||||
|
| |||||||||||||||||||||||||||||||||||||||||
| Original text written by user: | |||||||||||||||||||||||||||||||||||||||||
| IsPrivate? | No (this computation is public) | ||||||||||||||||||||||||||||||||||||||||
| User-defined keywords | KDGP1W1 | ||||||||||||||||||||||||||||||||||||||||
| Estimated Impact | 244 | ||||||||||||||||||||||||||||||||||||||||
Tree of Dependent Computations | |||||||||||||||||||||||||||||||||||||||||
| Family? (F = Feedback message, R = changed R code, M = changed R Module, P = changed Parameters, D = changed Data) | |||||||||||||||||||||||||||||||||||||||||
| - [Univariate Data Series] [Koffie, thee, cac...] [2011-02-10 12:07:10] [79bc85661dd8e300e34a2ba1a0b6f2ae] [Current] - RMP [Histogram] [Isabelle Regnard,...] [2011-02-21 21:35:59] [b5d41e9d9fd90b738a079e65b35766a6] - RMP [Kernel Density Estimation] [Isabelle Regnard,...] [2011-02-21 21:42:58] [b5d41e9d9fd90b738a079e65b35766a6] | |||||||||||||||||||||||||||||||||||||||||
| Feedback Forum | |||||||||||||||||||||||||||||||||||||||||
Post a new message | |||||||||||||||||||||||||||||||||||||||||
Dataset | |||||||||||||||||||||||||||||||||||||||||
| Dataseries X: | |||||||||||||||||||||||||||||||||||||||||
106.42 106.22 106.32 105.81 105.92 107.54 107.34 107.24 107.74 105.71 105.41 106.22 106.32 106.12 106.22 105.92 105.71 105.71 105.92 105.71 105.41 104.49 101.35 99.72 99.01 97.89 95.86 94.95 95.35 95.15 95.46 95.56 95.05 94.64 93.63 93.12 93.53 97.18 96.27 95.15 97.08 101.95 103.07 103.68 102.87 102.56 103.38 103.27 102.89 102.69 101.54 102.9 101.53 101.96 101.99 101.11 101.75 101.71 104.11 103.57 103.32 103.64 103.68 103.79 103.01 101.54 101.9 103.68 104.62 104.11 105.04 104.83 105.05 104.68 107.32 109.9 109.77 110.69 110.54 110.89 110.95 109.73 110.85 110.39 110.58 110.4 111.07 110.86 111.38 111.44 110.36 110.06 108.34 107.94 107.39 107.1 107.61 107.74 106.9 106.71 106.6 108.21 110.54 110.91 109.51 110.27 111.39 112.13 111.64 | |||||||||||||||||||||||||||||||||||||||||
Tables (Output of Computation) | |||||||||||||||||||||||||||||||||||||||||
| |||||||||||||||||||||||||||||||||||||||||
Figures (Output of Computation) | |||||||||||||||||||||||||||||||||||||||||
Input Parameters & R Code | |||||||||||||||||||||||||||||||||||||||||
| Parameters (Session): | |||||||||||||||||||||||||||||||||||||||||
| par1 = Koffie, thee en cacao ; par2 = http://statline.cbs.nl/StatWeb/publication/?DM=SLNL&PA=80087NED&D1=0-1,4-5&D2=13&D3=a&HDR=G1,T&STB=G2&VW=T. ; par3 = Consumentenprijsindex ; par4 = 12 ; | |||||||||||||||||||||||||||||||||||||||||
| Parameters (R input): | |||||||||||||||||||||||||||||||||||||||||
| par1 = Koffie, thee en cacao ; par2 = http://statline.cbs.nl/StatWeb/publication/?DM=SLNL&PA=80087NED&D1=0-1,4-5&D2=13&D3=a&HDR=G1,T&STB=G2&VW=T. ; par3 = Consumentenprijsindex ; par4 = 12 ; | |||||||||||||||||||||||||||||||||||||||||
| R code (references can be found in the software module): | |||||||||||||||||||||||||||||||||||||||||
if (par4 != 'No season') { | |||||||||||||||||||||||||||||||||||||||||