Free Statistics
of Irreproducible Research!
Description of Statistical Computation | |||||||||||||||||||||||||||||||||
|---|---|---|---|---|---|---|---|---|---|---|---|---|---|---|---|---|---|---|---|---|---|---|---|---|---|---|---|---|---|---|---|---|---|
| Author's title | |||||||||||||||||||||||||||||||||
| Author | *Unverified author* | ||||||||||||||||||||||||||||||||
| R Software Module | rwasp_meanversusmedian.wasp | ||||||||||||||||||||||||||||||||
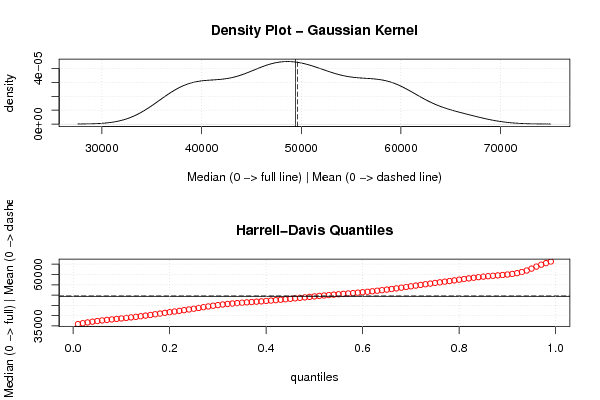
| Title produced by software | Mean versus Median | ||||||||||||||||||||||||||||||||
| Date of computation | Mon, 03 Jan 2011 15:19:17 +0000 | ||||||||||||||||||||||||||||||||
| Cite this page as follows | Statistical Computations at FreeStatistics.org, Office for Research Development and Education, URL https://freestatistics.org/blog/index.php?v=date/2011/Jan/03/t1294067827vlog9hlaos9hiu2.htm/, Retrieved Thu, 16 May 2024 09:06:31 +0000 | ||||||||||||||||||||||||||||||||
| Statistical Computations at FreeStatistics.org, Office for Research Development and Education, URL https://freestatistics.org/blog/index.php?pk=117250, Retrieved Thu, 16 May 2024 09:06:31 +0000 | |||||||||||||||||||||||||||||||||
| QR Codes: | |||||||||||||||||||||||||||||||||
|
| |||||||||||||||||||||||||||||||||
| Original text written by user: | |||||||||||||||||||||||||||||||||
| IsPrivate? | No (this computation is public) | ||||||||||||||||||||||||||||||||
| User-defined keywords | KDGP1W52 | ||||||||||||||||||||||||||||||||
| Estimated Impact | 199 | ||||||||||||||||||||||||||||||||
Tree of Dependent Computations | |||||||||||||||||||||||||||||||||
| Family? (F = Feedback message, R = changed R code, M = changed R Module, P = changed Parameters, D = changed Data) | |||||||||||||||||||||||||||||||||
| - [Mean versus Median] [Gemiddelde-Mediaan] [2011-01-03 15:19:17] [a6954a1d1f0e31732d0acb07eec786a1] [Current] | |||||||||||||||||||||||||||||||||
| Feedback Forum | |||||||||||||||||||||||||||||||||
Post a new message | |||||||||||||||||||||||||||||||||
Dataset | |||||||||||||||||||||||||||||||||
| Dataseries X: | |||||||||||||||||||||||||||||||||
52347 52407 50570 50442 50590 50040 50476 50268 50595 48708 48547 48196 48375 47915 46462 46132 46308 46532 46817 46824 46263 45992 46404 46995 48102 48719 47912 48430 50141 50608 51005 51857 52513 52406 53634 55165 57294 58026 56701 58706 60103 61153 62395 63850 64534 65765 66954 65741 65474 60687 59227 59373 59995 59532 59696 59507 60210 58782 59372 58827 60481 59508 56565 56201 56193 56431 56316 55316 54795 53310 51848 50618 52026 50120 46825 46374 45441 45392 45032 44302 42880 42101 41886 41415 43228 41633 39375 38603 37847 36881 36700 36477 35684 35896 37109 37612 39570 39518 37970 38343 37966 38942 39304 39438 38999 38110 40024 41050 42239 42313 41159 42067 42515 43554 45018 45797 46749 47291 48800 50566 54884 54002 51813 52751 54461 55364 56900 57795 | |||||||||||||||||||||||||||||||||
Tables (Output of Computation) | |||||||||||||||||||||||||||||||||
| |||||||||||||||||||||||||||||||||
Figures (Output of Computation) | |||||||||||||||||||||||||||||||||
Input Parameters & R Code | |||||||||||||||||||||||||||||||||
| Parameters (Session): | |||||||||||||||||||||||||||||||||
| Parameters (R input): | |||||||||||||||||||||||||||||||||
| R code (references can be found in the software module): | |||||||||||||||||||||||||||||||||
library(Hmisc) | |||||||||||||||||||||||||||||||||