Free Statistics

of Irreproducible Research!

Author's title

Author*Unverified author*
R Software Modulerwasp_autocorrelation.wasp
Title produced by software(Partial) Autocorrelation Function
Date of computationSat, 15 Jan 2011 10:11:09 +0000
Cite this page as followsStatistical Computations at FreeStatistics.org, Office for Research Development and Education, URL https://freestatistics.org/blog/index.php?v=date/2011/Jan/15/t1295086537ucd98oe7vhmxrfa.htm/, Retrieved Thu, 16 May 2024 22:01:57 +0000
Statistical Computations at FreeStatistics.org, Office for Research Development and Education, URL https://freestatistics.org/blog/index.php?pk=117322, Retrieved Thu, 16 May 2024 22:01:57 +0000
QR Codes:

Original text written by user:
IsPrivate?No (this computation is public)
User-defined keywordsKDGP2W12
Estimated Impact149
Family? (F = Feedback message, R = changed R code, M = changed R Module, P = changed Parameters, D = changed Data)
-       [(Partial) Autocorrelation Function] [] [2011-01-15 10:11:09] [a6954a1d1f0e31732d0acb07eec786a1] [Current]
Feedback Forum

Post a new message
Dataseries X:
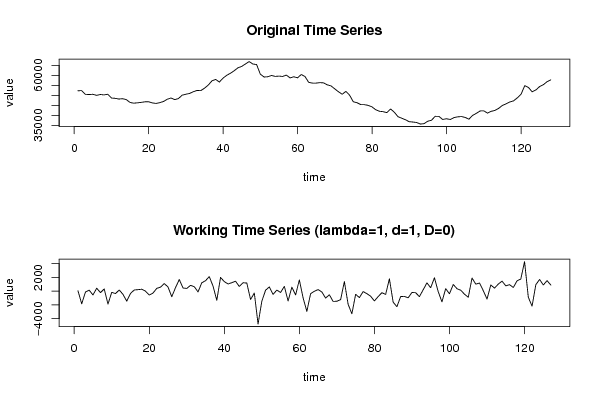
52347
52407
50570
50442
50590
50040
50476
50268
50595
48708
48547
48196
48375
47915
46462
46132
46308
46532
46817
46824
46263
45992
46404
46995
48102
48719
47912
48430
50141
50608
51005
51857
52513
52406
53634
55165
57294
58026
56701
58706
60103
61153
62395
63850
64534
65765
66954
65741
65474
60687
59227
59373
59995
59532
59696
59507
60210
58782
59372
58827
60481
59508
56565
56201
56193
56431
56316
55316
54795
53310
51848
50618
52026
50120
46825
46374
45441
45392
45032
44302
42880
42101
41886
41415
43228
41633
39375
38603
37847
36881
36700
36477
35684
35896
37109
37612
39570
39518
37970
38343
37966
38942
39304
39438
38999
38110
40024
41050
42239
42313
41159
42067
42515
43554
45018
45797
46749
47291
48800
50566
54884
54002
51813
52751
54461
55364
56900
57795


Summary of computational transaction
Raw Inputview raw input (R code)
Raw Outputview raw output of R engine
Computing time2 seconds
R Server'Gwilym Jenkins' @ www.wessa.org

\begin{tabular}{lllllllll}
\hline
Summary of computational transaction \tabularnewline
Raw Input & view raw input (R code)  \tabularnewline
Raw Output & view raw output of R engine  \tabularnewline
Computing time & 2 seconds \tabularnewline
R Server & 'Gwilym Jenkins' @ www.wessa.org \tabularnewline
\hline
\end{tabular}
%Source: https://freestatistics.org/blog/index.php?pk=117322&T=0

[TABLE]
[ROW][C]Summary of computational transaction[/C][/ROW]
[ROW][C]Raw Input[/C][C]view raw input (R code) [/C][/ROW]
[ROW][C]Raw Output[/C][C]view raw output of R engine [/C][/ROW]
[ROW][C]Computing time[/C][C]2 seconds[/C][/ROW]
[ROW][C]R Server[/C][C]'Gwilym Jenkins' @ www.wessa.org[/C][/ROW]
[/TABLE]
Source: https://freestatistics.org/blog/index.php?pk=117322&T=0

Globally Unique Identifier (entire table): ba.freestatistics.org/blog/index.php?pk=117322&T=0

As an alternative you can also use a QR Code:  

The GUIDs for individual cells are displayed in the table below:

Summary of computational transaction
Raw Inputview raw input (R code)
Raw Outputview raw output of R engine
Computing time2 seconds
R Server'Gwilym Jenkins' @ www.wessa.org


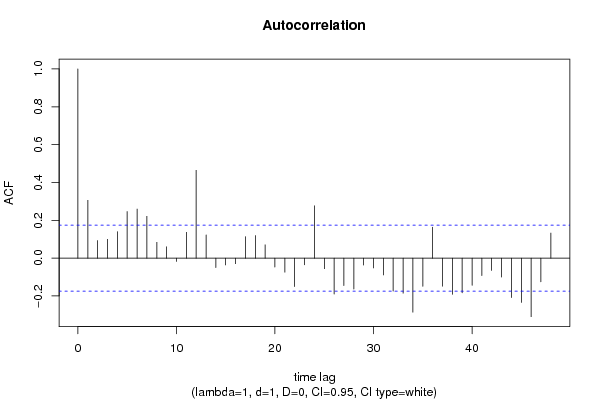
Autocorrelation Function
Time lag kACF(k)T-STATP-value
10.3055793.44370.000389
20.0930591.04870.148149
30.0992391.11840.13276
40.1399811.57750.058584
50.2464382.77720.003157
60.2592112.92120.002064
70.2209032.48950.007043
80.0838470.94490.17325
90.0597110.67290.251115
10-0.017302-0.1950.422858
110.1363771.53690.063404
120.4641465.23070
130.1224781.38030.084966
14-0.049741-0.56060.288045
15-0.035662-0.40190.344219
16-0.029052-0.32740.371954
170.1134521.27850.101695
180.1190731.34190.091013
190.0703890.79320.214559
20-0.046921-0.52880.298944
21-0.074571-0.84040.20114
22-0.149941-1.68970.046765
23-0.035201-0.39670.346127
240.2762713.11340.001143
25-0.055751-0.62830.265474
26-0.189836-2.13930.017161
27-0.145101-1.63520.052242
28-0.163738-1.84520.033666
29-0.036496-0.41130.340776
30-0.051913-0.5850.279783
31-0.088741-1.00010.159591
32-0.174139-1.96240.025949
33-0.185479-2.09020.019295
34-0.285866-3.22160.00081
35-0.149091-1.68020.047691
360.1638411.84640.033582
37-0.148025-1.66820.048874
38-0.191127-2.15390.016568
39-0.183064-2.0630.020574
40-0.14353-1.61750.054125
41-0.092199-1.0390.150382
42-0.064898-0.73140.232953
43-0.100089-1.12790.130735
44-0.2087-2.35190.010107
45-0.234394-2.64150.004646
46-0.309285-3.48550.000338
47-0.124959-1.40820.080754
480.1324491.49260.069008

\begin{tabular}{lllllllll}
\hline
Autocorrelation Function \tabularnewline
Time lag k & ACF(k) & T-STAT & P-value \tabularnewline
1 & 0.305579 & 3.4437 & 0.000389 \tabularnewline
2 & 0.093059 & 1.0487 & 0.148149 \tabularnewline
3 & 0.099239 & 1.1184 & 0.13276 \tabularnewline
4 & 0.139981 & 1.5775 & 0.058584 \tabularnewline
5 & 0.246438 & 2.7772 & 0.003157 \tabularnewline
6 & 0.259211 & 2.9212 & 0.002064 \tabularnewline
7 & 0.220903 & 2.4895 & 0.007043 \tabularnewline
8 & 0.083847 & 0.9449 & 0.17325 \tabularnewline
9 & 0.059711 & 0.6729 & 0.251115 \tabularnewline
10 & -0.017302 & -0.195 & 0.422858 \tabularnewline
11 & 0.136377 & 1.5369 & 0.063404 \tabularnewline
12 & 0.464146 & 5.2307 & 0 \tabularnewline
13 & 0.122478 & 1.3803 & 0.084966 \tabularnewline
14 & -0.049741 & -0.5606 & 0.288045 \tabularnewline
15 & -0.035662 & -0.4019 & 0.344219 \tabularnewline
16 & -0.029052 & -0.3274 & 0.371954 \tabularnewline
17 & 0.113452 & 1.2785 & 0.101695 \tabularnewline
18 & 0.119073 & 1.3419 & 0.091013 \tabularnewline
19 & 0.070389 & 0.7932 & 0.214559 \tabularnewline
20 & -0.046921 & -0.5288 & 0.298944 \tabularnewline
21 & -0.074571 & -0.8404 & 0.20114 \tabularnewline
22 & -0.149941 & -1.6897 & 0.046765 \tabularnewline
23 & -0.035201 & -0.3967 & 0.346127 \tabularnewline
24 & 0.276271 & 3.1134 & 0.001143 \tabularnewline
25 & -0.055751 & -0.6283 & 0.265474 \tabularnewline
26 & -0.189836 & -2.1393 & 0.017161 \tabularnewline
27 & -0.145101 & -1.6352 & 0.052242 \tabularnewline
28 & -0.163738 & -1.8452 & 0.033666 \tabularnewline
29 & -0.036496 & -0.4113 & 0.340776 \tabularnewline
30 & -0.051913 & -0.585 & 0.279783 \tabularnewline
31 & -0.088741 & -1.0001 & 0.159591 \tabularnewline
32 & -0.174139 & -1.9624 & 0.025949 \tabularnewline
33 & -0.185479 & -2.0902 & 0.019295 \tabularnewline
34 & -0.285866 & -3.2216 & 0.00081 \tabularnewline
35 & -0.149091 & -1.6802 & 0.047691 \tabularnewline
36 & 0.163841 & 1.8464 & 0.033582 \tabularnewline
37 & -0.148025 & -1.6682 & 0.048874 \tabularnewline
38 & -0.191127 & -2.1539 & 0.016568 \tabularnewline
39 & -0.183064 & -2.063 & 0.020574 \tabularnewline
40 & -0.14353 & -1.6175 & 0.054125 \tabularnewline
41 & -0.092199 & -1.039 & 0.150382 \tabularnewline
42 & -0.064898 & -0.7314 & 0.232953 \tabularnewline
43 & -0.100089 & -1.1279 & 0.130735 \tabularnewline
44 & -0.2087 & -2.3519 & 0.010107 \tabularnewline
45 & -0.234394 & -2.6415 & 0.004646 \tabularnewline
46 & -0.309285 & -3.4855 & 0.000338 \tabularnewline
47 & -0.124959 & -1.4082 & 0.080754 \tabularnewline
48 & 0.132449 & 1.4926 & 0.069008 \tabularnewline
\hline
\end{tabular}
%Source: https://freestatistics.org/blog/index.php?pk=117322&T=1

[TABLE]
[ROW][C]Autocorrelation Function[/C][/ROW]
[ROW][C]Time lag k[/C][C]ACF(k)[/C][C]T-STAT[/C][C]P-value[/C][/ROW]
[ROW][C]1[/C][C]0.305579[/C][C]3.4437[/C][C]0.000389[/C][/ROW]
[ROW][C]2[/C][C]0.093059[/C][C]1.0487[/C][C]0.148149[/C][/ROW]
[ROW][C]3[/C][C]0.099239[/C][C]1.1184[/C][C]0.13276[/C][/ROW]
[ROW][C]4[/C][C]0.139981[/C][C]1.5775[/C][C]0.058584[/C][/ROW]
[ROW][C]5[/C][C]0.246438[/C][C]2.7772[/C][C]0.003157[/C][/ROW]
[ROW][C]6[/C][C]0.259211[/C][C]2.9212[/C][C]0.002064[/C][/ROW]
[ROW][C]7[/C][C]0.220903[/C][C]2.4895[/C][C]0.007043[/C][/ROW]
[ROW][C]8[/C][C]0.083847[/C][C]0.9449[/C][C]0.17325[/C][/ROW]
[ROW][C]9[/C][C]0.059711[/C][C]0.6729[/C][C]0.251115[/C][/ROW]
[ROW][C]10[/C][C]-0.017302[/C][C]-0.195[/C][C]0.422858[/C][/ROW]
[ROW][C]11[/C][C]0.136377[/C][C]1.5369[/C][C]0.063404[/C][/ROW]
[ROW][C]12[/C][C]0.464146[/C][C]5.2307[/C][C]0[/C][/ROW]
[ROW][C]13[/C][C]0.122478[/C][C]1.3803[/C][C]0.084966[/C][/ROW]
[ROW][C]14[/C][C]-0.049741[/C][C]-0.5606[/C][C]0.288045[/C][/ROW]
[ROW][C]15[/C][C]-0.035662[/C][C]-0.4019[/C][C]0.344219[/C][/ROW]
[ROW][C]16[/C][C]-0.029052[/C][C]-0.3274[/C][C]0.371954[/C][/ROW]
[ROW][C]17[/C][C]0.113452[/C][C]1.2785[/C][C]0.101695[/C][/ROW]
[ROW][C]18[/C][C]0.119073[/C][C]1.3419[/C][C]0.091013[/C][/ROW]
[ROW][C]19[/C][C]0.070389[/C][C]0.7932[/C][C]0.214559[/C][/ROW]
[ROW][C]20[/C][C]-0.046921[/C][C]-0.5288[/C][C]0.298944[/C][/ROW]
[ROW][C]21[/C][C]-0.074571[/C][C]-0.8404[/C][C]0.20114[/C][/ROW]
[ROW][C]22[/C][C]-0.149941[/C][C]-1.6897[/C][C]0.046765[/C][/ROW]
[ROW][C]23[/C][C]-0.035201[/C][C]-0.3967[/C][C]0.346127[/C][/ROW]
[ROW][C]24[/C][C]0.276271[/C][C]3.1134[/C][C]0.001143[/C][/ROW]
[ROW][C]25[/C][C]-0.055751[/C][C]-0.6283[/C][C]0.265474[/C][/ROW]
[ROW][C]26[/C][C]-0.189836[/C][C]-2.1393[/C][C]0.017161[/C][/ROW]
[ROW][C]27[/C][C]-0.145101[/C][C]-1.6352[/C][C]0.052242[/C][/ROW]
[ROW][C]28[/C][C]-0.163738[/C][C]-1.8452[/C][C]0.033666[/C][/ROW]
[ROW][C]29[/C][C]-0.036496[/C][C]-0.4113[/C][C]0.340776[/C][/ROW]
[ROW][C]30[/C][C]-0.051913[/C][C]-0.585[/C][C]0.279783[/C][/ROW]
[ROW][C]31[/C][C]-0.088741[/C][C]-1.0001[/C][C]0.159591[/C][/ROW]
[ROW][C]32[/C][C]-0.174139[/C][C]-1.9624[/C][C]0.025949[/C][/ROW]
[ROW][C]33[/C][C]-0.185479[/C][C]-2.0902[/C][C]0.019295[/C][/ROW]
[ROW][C]34[/C][C]-0.285866[/C][C]-3.2216[/C][C]0.00081[/C][/ROW]
[ROW][C]35[/C][C]-0.149091[/C][C]-1.6802[/C][C]0.047691[/C][/ROW]
[ROW][C]36[/C][C]0.163841[/C][C]1.8464[/C][C]0.033582[/C][/ROW]
[ROW][C]37[/C][C]-0.148025[/C][C]-1.6682[/C][C]0.048874[/C][/ROW]
[ROW][C]38[/C][C]-0.191127[/C][C]-2.1539[/C][C]0.016568[/C][/ROW]
[ROW][C]39[/C][C]-0.183064[/C][C]-2.063[/C][C]0.020574[/C][/ROW]
[ROW][C]40[/C][C]-0.14353[/C][C]-1.6175[/C][C]0.054125[/C][/ROW]
[ROW][C]41[/C][C]-0.092199[/C][C]-1.039[/C][C]0.150382[/C][/ROW]
[ROW][C]42[/C][C]-0.064898[/C][C]-0.7314[/C][C]0.232953[/C][/ROW]
[ROW][C]43[/C][C]-0.100089[/C][C]-1.1279[/C][C]0.130735[/C][/ROW]
[ROW][C]44[/C][C]-0.2087[/C][C]-2.3519[/C][C]0.010107[/C][/ROW]
[ROW][C]45[/C][C]-0.234394[/C][C]-2.6415[/C][C]0.004646[/C][/ROW]
[ROW][C]46[/C][C]-0.309285[/C][C]-3.4855[/C][C]0.000338[/C][/ROW]
[ROW][C]47[/C][C]-0.124959[/C][C]-1.4082[/C][C]0.080754[/C][/ROW]
[ROW][C]48[/C][C]0.132449[/C][C]1.4926[/C][C]0.069008[/C][/ROW]
[/TABLE]
Source: https://freestatistics.org/blog/index.php?pk=117322&T=1

Globally Unique Identifier (entire table): ba.freestatistics.org/blog/index.php?pk=117322&T=1

As an alternative you can also use a QR Code:  

The GUIDs for individual cells are displayed in the table below:

Autocorrelation Function
Time lag kACF(k)T-STATP-value
10.3055793.44370.000389
20.0930591.04870.148149
30.0992391.11840.13276
40.1399811.57750.058584
50.2464382.77720.003157
60.2592112.92120.002064
70.2209032.48950.007043
80.0838470.94490.17325
90.0597110.67290.251115
10-0.017302-0.1950.422858
110.1363771.53690.063404
120.4641465.23070
130.1224781.38030.084966
14-0.049741-0.56060.288045
15-0.035662-0.40190.344219
16-0.029052-0.32740.371954
170.1134521.27850.101695
180.1190731.34190.091013
190.0703890.79320.214559
20-0.046921-0.52880.298944
21-0.074571-0.84040.20114
22-0.149941-1.68970.046765
23-0.035201-0.39670.346127
240.2762713.11340.001143
25-0.055751-0.62830.265474
26-0.189836-2.13930.017161
27-0.145101-1.63520.052242
28-0.163738-1.84520.033666
29-0.036496-0.41130.340776
30-0.051913-0.5850.279783
31-0.088741-1.00010.159591
32-0.174139-1.96240.025949
33-0.185479-2.09020.019295
34-0.285866-3.22160.00081
35-0.149091-1.68020.047691
360.1638411.84640.033582
37-0.148025-1.66820.048874
38-0.191127-2.15390.016568
39-0.183064-2.0630.020574
40-0.14353-1.61750.054125
41-0.092199-1.0390.150382
42-0.064898-0.73140.232953
43-0.100089-1.12790.130735
44-0.2087-2.35190.010107
45-0.234394-2.64150.004646
46-0.309285-3.48550.000338
47-0.124959-1.40820.080754
480.1324491.49260.069008


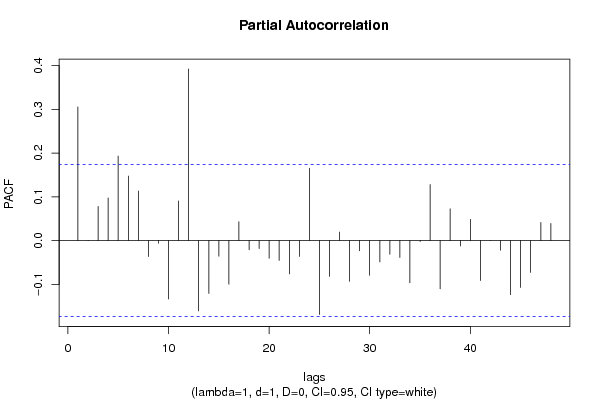
Partial Autocorrelation Function
Time lag kPACF(k)T-STATP-value
10.3055793.44370.000389
2-0.000352-0.0040.498419
30.0782030.88130.189911
40.0976641.10060.136573
50.1933282.17870.0156
60.1475441.66270.049416
70.1131951.27560.102206
8-0.036497-0.41130.340772
9-0.006026-0.06790.472983
10-0.133719-1.50690.067156
110.0905591.02060.154704
120.3924794.4231e-05
13-0.160911-1.81340.036067
14-0.120828-1.36170.087858
15-0.035773-0.40310.343762
16-0.099661-1.12310.131751
170.0433020.4880.3132
18-0.020956-0.23620.406845
19-0.01821-0.20520.418868
20-0.040588-0.45740.324081
21-0.045422-0.51190.30481
22-0.076332-0.86020.195643
23-0.036099-0.40680.342416
240.165691.86720.032088
25-0.169203-1.90680.029402
26-0.082067-0.92480.178399
270.0194450.21910.41345
28-0.093091-1.04910.148067
29-0.023392-0.26360.396252
30-0.079394-0.89470.186313
31-0.048953-0.55170.291071
32-0.031422-0.35410.361922
33-0.038497-0.43380.332569
34-0.09648-1.08730.139487
35-0.002142-0.02410.490392
360.1280361.44290.075757
37-0.110294-1.24290.108088
380.072630.81850.207304
39-0.012507-0.14090.444069
400.0487330.54920.291919
41-0.091323-1.02920.152681
420.0005120.00580.497703
43-0.021837-0.24610.403005
44-0.123737-1.39440.082809
45-0.107029-1.20620.115001
46-0.072909-0.82160.206409
470.0416420.46930.319838
480.0391710.44140.329824

\begin{tabular}{lllllllll}
\hline
Partial Autocorrelation Function \tabularnewline
Time lag k & PACF(k) & T-STAT & P-value \tabularnewline
1 & 0.305579 & 3.4437 & 0.000389 \tabularnewline
2 & -0.000352 & -0.004 & 0.498419 \tabularnewline
3 & 0.078203 & 0.8813 & 0.189911 \tabularnewline
4 & 0.097664 & 1.1006 & 0.136573 \tabularnewline
5 & 0.193328 & 2.1787 & 0.0156 \tabularnewline
6 & 0.147544 & 1.6627 & 0.049416 \tabularnewline
7 & 0.113195 & 1.2756 & 0.102206 \tabularnewline
8 & -0.036497 & -0.4113 & 0.340772 \tabularnewline
9 & -0.006026 & -0.0679 & 0.472983 \tabularnewline
10 & -0.133719 & -1.5069 & 0.067156 \tabularnewline
11 & 0.090559 & 1.0206 & 0.154704 \tabularnewline
12 & 0.392479 & 4.423 & 1e-05 \tabularnewline
13 & -0.160911 & -1.8134 & 0.036067 \tabularnewline
14 & -0.120828 & -1.3617 & 0.087858 \tabularnewline
15 & -0.035773 & -0.4031 & 0.343762 \tabularnewline
16 & -0.099661 & -1.1231 & 0.131751 \tabularnewline
17 & 0.043302 & 0.488 & 0.3132 \tabularnewline
18 & -0.020956 & -0.2362 & 0.406845 \tabularnewline
19 & -0.01821 & -0.2052 & 0.418868 \tabularnewline
20 & -0.040588 & -0.4574 & 0.324081 \tabularnewline
21 & -0.045422 & -0.5119 & 0.30481 \tabularnewline
22 & -0.076332 & -0.8602 & 0.195643 \tabularnewline
23 & -0.036099 & -0.4068 & 0.342416 \tabularnewline
24 & 0.16569 & 1.8672 & 0.032088 \tabularnewline
25 & -0.169203 & -1.9068 & 0.029402 \tabularnewline
26 & -0.082067 & -0.9248 & 0.178399 \tabularnewline
27 & 0.019445 & 0.2191 & 0.41345 \tabularnewline
28 & -0.093091 & -1.0491 & 0.148067 \tabularnewline
29 & -0.023392 & -0.2636 & 0.396252 \tabularnewline
30 & -0.079394 & -0.8947 & 0.186313 \tabularnewline
31 & -0.048953 & -0.5517 & 0.291071 \tabularnewline
32 & -0.031422 & -0.3541 & 0.361922 \tabularnewline
33 & -0.038497 & -0.4338 & 0.332569 \tabularnewline
34 & -0.09648 & -1.0873 & 0.139487 \tabularnewline
35 & -0.002142 & -0.0241 & 0.490392 \tabularnewline
36 & 0.128036 & 1.4429 & 0.075757 \tabularnewline
37 & -0.110294 & -1.2429 & 0.108088 \tabularnewline
38 & 0.07263 & 0.8185 & 0.207304 \tabularnewline
39 & -0.012507 & -0.1409 & 0.444069 \tabularnewline
40 & 0.048733 & 0.5492 & 0.291919 \tabularnewline
41 & -0.091323 & -1.0292 & 0.152681 \tabularnewline
42 & 0.000512 & 0.0058 & 0.497703 \tabularnewline
43 & -0.021837 & -0.2461 & 0.403005 \tabularnewline
44 & -0.123737 & -1.3944 & 0.082809 \tabularnewline
45 & -0.107029 & -1.2062 & 0.115001 \tabularnewline
46 & -0.072909 & -0.8216 & 0.206409 \tabularnewline
47 & 0.041642 & 0.4693 & 0.319838 \tabularnewline
48 & 0.039171 & 0.4414 & 0.329824 \tabularnewline
\hline
\end{tabular}
%Source: https://freestatistics.org/blog/index.php?pk=117322&T=2

[TABLE]
[ROW][C]Partial Autocorrelation Function[/C][/ROW]
[ROW][C]Time lag k[/C][C]PACF(k)[/C][C]T-STAT[/C][C]P-value[/C][/ROW]
[ROW][C]1[/C][C]0.305579[/C][C]3.4437[/C][C]0.000389[/C][/ROW]
[ROW][C]2[/C][C]-0.000352[/C][C]-0.004[/C][C]0.498419[/C][/ROW]
[ROW][C]3[/C][C]0.078203[/C][C]0.8813[/C][C]0.189911[/C][/ROW]
[ROW][C]4[/C][C]0.097664[/C][C]1.1006[/C][C]0.136573[/C][/ROW]
[ROW][C]5[/C][C]0.193328[/C][C]2.1787[/C][C]0.0156[/C][/ROW]
[ROW][C]6[/C][C]0.147544[/C][C]1.6627[/C][C]0.049416[/C][/ROW]
[ROW][C]7[/C][C]0.113195[/C][C]1.2756[/C][C]0.102206[/C][/ROW]
[ROW][C]8[/C][C]-0.036497[/C][C]-0.4113[/C][C]0.340772[/C][/ROW]
[ROW][C]9[/C][C]-0.006026[/C][C]-0.0679[/C][C]0.472983[/C][/ROW]
[ROW][C]10[/C][C]-0.133719[/C][C]-1.5069[/C][C]0.067156[/C][/ROW]
[ROW][C]11[/C][C]0.090559[/C][C]1.0206[/C][C]0.154704[/C][/ROW]
[ROW][C]12[/C][C]0.392479[/C][C]4.423[/C][C]1e-05[/C][/ROW]
[ROW][C]13[/C][C]-0.160911[/C][C]-1.8134[/C][C]0.036067[/C][/ROW]
[ROW][C]14[/C][C]-0.120828[/C][C]-1.3617[/C][C]0.087858[/C][/ROW]
[ROW][C]15[/C][C]-0.035773[/C][C]-0.4031[/C][C]0.343762[/C][/ROW]
[ROW][C]16[/C][C]-0.099661[/C][C]-1.1231[/C][C]0.131751[/C][/ROW]
[ROW][C]17[/C][C]0.043302[/C][C]0.488[/C][C]0.3132[/C][/ROW]
[ROW][C]18[/C][C]-0.020956[/C][C]-0.2362[/C][C]0.406845[/C][/ROW]
[ROW][C]19[/C][C]-0.01821[/C][C]-0.2052[/C][C]0.418868[/C][/ROW]
[ROW][C]20[/C][C]-0.040588[/C][C]-0.4574[/C][C]0.324081[/C][/ROW]
[ROW][C]21[/C][C]-0.045422[/C][C]-0.5119[/C][C]0.30481[/C][/ROW]
[ROW][C]22[/C][C]-0.076332[/C][C]-0.8602[/C][C]0.195643[/C][/ROW]
[ROW][C]23[/C][C]-0.036099[/C][C]-0.4068[/C][C]0.342416[/C][/ROW]
[ROW][C]24[/C][C]0.16569[/C][C]1.8672[/C][C]0.032088[/C][/ROW]
[ROW][C]25[/C][C]-0.169203[/C][C]-1.9068[/C][C]0.029402[/C][/ROW]
[ROW][C]26[/C][C]-0.082067[/C][C]-0.9248[/C][C]0.178399[/C][/ROW]
[ROW][C]27[/C][C]0.019445[/C][C]0.2191[/C][C]0.41345[/C][/ROW]
[ROW][C]28[/C][C]-0.093091[/C][C]-1.0491[/C][C]0.148067[/C][/ROW]
[ROW][C]29[/C][C]-0.023392[/C][C]-0.2636[/C][C]0.396252[/C][/ROW]
[ROW][C]30[/C][C]-0.079394[/C][C]-0.8947[/C][C]0.186313[/C][/ROW]
[ROW][C]31[/C][C]-0.048953[/C][C]-0.5517[/C][C]0.291071[/C][/ROW]
[ROW][C]32[/C][C]-0.031422[/C][C]-0.3541[/C][C]0.361922[/C][/ROW]
[ROW][C]33[/C][C]-0.038497[/C][C]-0.4338[/C][C]0.332569[/C][/ROW]
[ROW][C]34[/C][C]-0.09648[/C][C]-1.0873[/C][C]0.139487[/C][/ROW]
[ROW][C]35[/C][C]-0.002142[/C][C]-0.0241[/C][C]0.490392[/C][/ROW]
[ROW][C]36[/C][C]0.128036[/C][C]1.4429[/C][C]0.075757[/C][/ROW]
[ROW][C]37[/C][C]-0.110294[/C][C]-1.2429[/C][C]0.108088[/C][/ROW]
[ROW][C]38[/C][C]0.07263[/C][C]0.8185[/C][C]0.207304[/C][/ROW]
[ROW][C]39[/C][C]-0.012507[/C][C]-0.1409[/C][C]0.444069[/C][/ROW]
[ROW][C]40[/C][C]0.048733[/C][C]0.5492[/C][C]0.291919[/C][/ROW]
[ROW][C]41[/C][C]-0.091323[/C][C]-1.0292[/C][C]0.152681[/C][/ROW]
[ROW][C]42[/C][C]0.000512[/C][C]0.0058[/C][C]0.497703[/C][/ROW]
[ROW][C]43[/C][C]-0.021837[/C][C]-0.2461[/C][C]0.403005[/C][/ROW]
[ROW][C]44[/C][C]-0.123737[/C][C]-1.3944[/C][C]0.082809[/C][/ROW]
[ROW][C]45[/C][C]-0.107029[/C][C]-1.2062[/C][C]0.115001[/C][/ROW]
[ROW][C]46[/C][C]-0.072909[/C][C]-0.8216[/C][C]0.206409[/C][/ROW]
[ROW][C]47[/C][C]0.041642[/C][C]0.4693[/C][C]0.319838[/C][/ROW]
[ROW][C]48[/C][C]0.039171[/C][C]0.4414[/C][C]0.329824[/C][/ROW]
[/TABLE]
Source: https://freestatistics.org/blog/index.php?pk=117322&T=2

Globally Unique Identifier (entire table): ba.freestatistics.org/blog/index.php?pk=117322&T=2

As an alternative you can also use a QR Code:  

The GUIDs for individual cells are displayed in the table below:

Partial Autocorrelation Function
Time lag kPACF(k)T-STATP-value
10.3055793.44370.000389
2-0.000352-0.0040.498419
30.0782030.88130.189911
40.0976641.10060.136573
50.1933282.17870.0156
60.1475441.66270.049416
70.1131951.27560.102206
8-0.036497-0.41130.340772
9-0.006026-0.06790.472983
10-0.133719-1.50690.067156
110.0905591.02060.154704
120.3924794.4231e-05
13-0.160911-1.81340.036067
14-0.120828-1.36170.087858
15-0.035773-0.40310.343762
16-0.099661-1.12310.131751
170.0433020.4880.3132
18-0.020956-0.23620.406845
19-0.01821-0.20520.418868
20-0.040588-0.45740.324081
21-0.045422-0.51190.30481
22-0.076332-0.86020.195643
23-0.036099-0.40680.342416
240.165691.86720.032088
25-0.169203-1.90680.029402
26-0.082067-0.92480.178399
270.0194450.21910.41345
28-0.093091-1.04910.148067
29-0.023392-0.26360.396252
30-0.079394-0.89470.186313
31-0.048953-0.55170.291071
32-0.031422-0.35410.361922
33-0.038497-0.43380.332569
34-0.09648-1.08730.139487
35-0.002142-0.02410.490392
360.1280361.44290.075757
37-0.110294-1.24290.108088
380.072630.81850.207304
39-0.012507-0.14090.444069
400.0487330.54920.291919
41-0.091323-1.02920.152681
420.0005120.00580.497703
43-0.021837-0.24610.403005
44-0.123737-1.39440.082809
45-0.107029-1.20620.115001
46-0.072909-0.82160.206409
470.0416420.46930.319838
480.0391710.44140.329824


Parameters (Session):
par1 = 48 ; par2 = 1 ; par3 = 1 ; par4 = 0 ; par5 = 12 ; par6 = White Noise ; par7 = 0.95 ;
Parameters (R input):
par1 = 48 ; par2 = 1 ; par3 = 1 ; par4 = 0 ; par5 = 12 ; par6 = White Noise ; par7 = 0.95 ; par8 = ;
R code (references can be found in the software module):
if (par1 == 'Default') {
par1 = 10*log10(length(x))
} else {
par1 <- as.numeric(par1)
}
par2 <- as.numeric(par2)
par3 <- as.numeric(par3)
par4 <- as.numeric(par4)
par5 <- as.numeric(par5)
if (par6 == 'White Noise') par6 <- 'white' else par6 <- 'ma'
par7 <- as.numeric(par7)
if (par8 != '') par8 <- as.numeric(par8)
ox <- x
if (par8 == '') {
if (par2 == 0) {
x <- log(x)
} else {
x <- (x ^ par2 - 1) / par2
}
} else {
x <- log(x,base=par8)
}
if (par3 > 0) x <- diff(x,lag=1,difference=par3)
if (par4 > 0) x <- diff(x,lag=par5,difference=par4)
bitmap(file='picts.png')
op <- par(mfrow=c(2,1))
plot(ox,type='l',main='Original Time Series',xlab='time',ylab='value')
if (par8=='') {
mytitle <- paste('Working Time Series (lambda=',par2,', d=',par3,', D=',par4,')',sep='')
mysub <- paste('(lambda=',par2,', d=',par3,', D=',par4,', CI=', par7, ', CI type=',par6,')',sep='')
} else {
mytitle <- paste('Working Time Series (base=',par8,', d=',par3,', D=',par4,')',sep='')
mysub <- paste('(base=',par8,', d=',par3,', D=',par4,', CI=', par7, ', CI type=',par6,')',sep='')
}
plot(x,type='l', main=mytitle,xlab='time',ylab='value')
par(op)
dev.off()
bitmap(file='pic1.png')
racf <- acf(x, par1, main='Autocorrelation', xlab='time lag', ylab='ACF', ci.type=par6, ci=par7, sub=mysub)
dev.off()
bitmap(file='pic2.png')
rpacf <- pacf(x,par1,main='Partial Autocorrelation',xlab='lags',ylab='PACF',sub=mysub)
dev.off()
(myacf <- c(racf$acf))
(mypacf <- c(rpacf$acf))
lengthx <- length(x)
sqrtn <- sqrt(lengthx)
load(file='createtable')
a<-table.start()
a<-table.row.start(a)
a<-table.element(a,'Autocorrelation Function',4,TRUE)
a<-table.row.end(a)
a<-table.row.start(a)
a<-table.element(a,'Time lag k',header=TRUE)
a<-table.element(a,hyperlink('basics.htm','ACF(k)','click here for more information about the Autocorrelation Function'),header=TRUE)
a<-table.element(a,'T-STAT',header=TRUE)
a<-table.element(a,'P-value',header=TRUE)
a<-table.row.end(a)
for (i in 2:(par1+1)) {
a<-table.row.start(a)
a<-table.element(a,i-1,header=TRUE)
a<-table.element(a,round(myacf[i],6))
mytstat <- myacf[i]*sqrtn
a<-table.element(a,round(mytstat,4))
a<-table.element(a,round(1-pt(abs(mytstat),lengthx),6))
a<-table.row.end(a)
}
a<-table.end(a)
table.save(a,file='mytable.tab')
a<-table.start()
a<-table.row.start(a)
a<-table.element(a,'Partial Autocorrelation Function',4,TRUE)
a<-table.row.end(a)
a<-table.row.start(a)
a<-table.element(a,'Time lag k',header=TRUE)
a<-table.element(a,hyperlink('basics.htm','PACF(k)','click here for more information about the Partial Autocorrelation Function'),header=TRUE)
a<-table.element(a,'T-STAT',header=TRUE)
a<-table.element(a,'P-value',header=TRUE)
a<-table.row.end(a)
for (i in 1:par1) {
a<-table.row.start(a)
a<-table.element(a,i,header=TRUE)
a<-table.element(a,round(mypacf[i],6))
mytstat <- mypacf[i]*sqrtn
a<-table.element(a,round(mytstat,4))
a<-table.element(a,round(1-pt(abs(mytstat),lengthx),6))
a<-table.row.end(a)
}
a<-table.end(a)
table.save(a,file='mytable1.tab')