Free Statistics
of Irreproducible Research!
Description of Statistical Computation | ||||||||||||||||||||||||||||||
|---|---|---|---|---|---|---|---|---|---|---|---|---|---|---|---|---|---|---|---|---|---|---|---|---|---|---|---|---|---|---|
| Author's title | ||||||||||||||||||||||||||||||
| Author | *The author of this computation has been verified* | |||||||||||||||||||||||||||||
| R Software Module | Ian.Hollidayrwasp_Distributional Plots.wasp | |||||||||||||||||||||||||||||
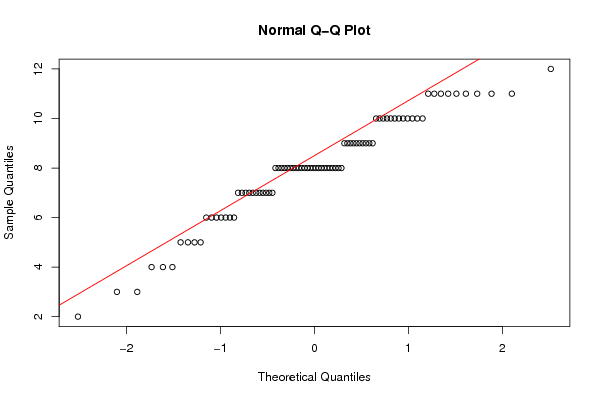
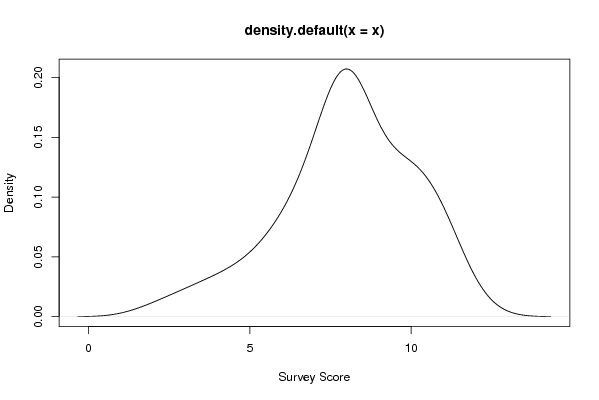
| Title produced by software | Histogram, QQplot and Density | |||||||||||||||||||||||||||||
| Date of computation | Thu, 20 Jan 2011 16:23:35 +0000 | |||||||||||||||||||||||||||||
| Cite this page as follows | Statistical Computations at FreeStatistics.org, Office for Research Development and Education, URL https://freestatistics.org/blog/index.php?v=date/2011/Jan/20/t1295540489asy17s5u61gmsyc.htm/, Retrieved Thu, 16 May 2024 11:57:51 +0000 | |||||||||||||||||||||||||||||
| Statistical Computations at FreeStatistics.org, Office for Research Development and Education, URL https://freestatistics.org/blog/index.php?pk=117575, Retrieved Thu, 16 May 2024 11:57:51 +0000 | ||||||||||||||||||||||||||||||
| QR Codes: | ||||||||||||||||||||||||||||||
|
| ||||||||||||||||||||||||||||||
| Original text written by user: | ||||||||||||||||||||||||||||||
| IsPrivate? | No (this computation is public) | |||||||||||||||||||||||||||||
| User-defined keywords | ||||||||||||||||||||||||||||||
| Estimated Impact | 189 | |||||||||||||||||||||||||||||
Tree of Dependent Computations | ||||||||||||||||||||||||||||||
| Family? (F = Feedback message, R = changed R code, M = changed R Module, P = changed Parameters, D = changed Data) | ||||||||||||||||||||||||||||||
| - [Histogram, QQplot and Density] [Workshop 1 ] [2010-09-29 15:04:17] [98fd0e87c3eb04e0cc2efde01dbafab6] - R PD [Histogram, QQplot and Density] [did placement] [2010-10-18 21:05:01] [05616fbd08f92db09f64c90de8227106] - D [Histogram, QQplot and Density] [part 2 cat] [2011-01-20 16:23:35] [e0a847501dfcd0f3c528e83c12b79c52] [Current] | ||||||||||||||||||||||||||||||
| Feedback Forum | ||||||||||||||||||||||||||||||
Post a new message | ||||||||||||||||||||||||||||||
Dataset | ||||||||||||||||||||||||||||||
| Dataseries X: | ||||||||||||||||||||||||||||||
7 7 7 8 4 10 8 8 8 8 6 8 9 5 7 6 8 4 6 8 10 11 10 9 11 10 11 9 10 9 8 7 11 10 7 10 8 4 8 8 10 11 2 8 3 9 11 7 7 9 7 7 9 9 5 8 10 8 11 8 10 8 6 8 3 10 9 9 6 5 8 10 6 12 8 11 8 8 8 8 7 11 6 5 | ||||||||||||||||||||||||||||||
Tables (Output of Computation) | ||||||||||||||||||||||||||||||
| ||||||||||||||||||||||||||||||
Figures (Output of Computation) | ||||||||||||||||||||||||||||||
Input Parameters & R Code | ||||||||||||||||||||||||||||||
| Parameters (Session): | ||||||||||||||||||||||||||||||
| par1 = 30 ; | ||||||||||||||||||||||||||||||
| Parameters (R input): | ||||||||||||||||||||||||||||||
| par1 = 30 ; | ||||||||||||||||||||||||||||||
| R code (references can be found in the software module): | ||||||||||||||||||||||||||||||
bitmap(file='test1.png') | ||||||||||||||||||||||||||||||