Free Statistics
of Irreproducible Research!
Description of Statistical Computation | |||||||||||||||||||||||||||||||||||||||||||||||||||||
|---|---|---|---|---|---|---|---|---|---|---|---|---|---|---|---|---|---|---|---|---|---|---|---|---|---|---|---|---|---|---|---|---|---|---|---|---|---|---|---|---|---|---|---|---|---|---|---|---|---|---|---|---|---|
| Author's title | |||||||||||||||||||||||||||||||||||||||||||||||||||||
| Author | *The author of this computation has been verified* | ||||||||||||||||||||||||||||||||||||||||||||||||||||
| R Software Module | rwasp_bidataseries.wasp | ||||||||||||||||||||||||||||||||||||||||||||||||||||
| Title produced by software | Bivariate Data Series | ||||||||||||||||||||||||||||||||||||||||||||||||||||
| Date of computation | Thu, 10 Nov 2011 18:31:12 -0500 | ||||||||||||||||||||||||||||||||||||||||||||||||||||
| Cite this page as follows | Statistical Computations at FreeStatistics.org, Office for Research Development and Education, URL https://freestatistics.org/blog/index.php?v=date/2011/Nov/10/t1320967900ydgvjfahe13capf.htm/, Retrieved Mon, 30 Jun 2025 21:32:57 +0000 | ||||||||||||||||||||||||||||||||||||||||||||||||||||
| Statistical Computations at FreeStatistics.org, Office for Research Development and Education, URL https://freestatistics.org/blog/index.php?pk=141277, Retrieved Mon, 30 Jun 2025 21:32:57 +0000 | |||||||||||||||||||||||||||||||||||||||||||||||||||||
| QR Codes: | |||||||||||||||||||||||||||||||||||||||||||||||||||||
|
| |||||||||||||||||||||||||||||||||||||||||||||||||||||
| Original text written by user: | |||||||||||||||||||||||||||||||||||||||||||||||||||||
| IsPrivate? | No (this computation is public) | ||||||||||||||||||||||||||||||||||||||||||||||||||||
| User-defined keywords | |||||||||||||||||||||||||||||||||||||||||||||||||||||
| Estimated Impact | 199 | ||||||||||||||||||||||||||||||||||||||||||||||||||||
Tree of Dependent Computations | |||||||||||||||||||||||||||||||||||||||||||||||||||||
| Family? (F = Feedback message, R = changed R code, M = changed R Module, P = changed Parameters, D = changed Data) | |||||||||||||||||||||||||||||||||||||||||||||||||||||
| - [Bivariate Data Series] [Bivariate dataset] [2008-01-05 23:51:08] [74be16979710d4c4e7c6647856088456] - MPD [Bivariate Data Series] [Bivariate Data An...] [2011-11-10 23:31:12] [614dd89c388120cee0dd25886939832b] [Current] | |||||||||||||||||||||||||||||||||||||||||||||||||||||
| Feedback Forum | |||||||||||||||||||||||||||||||||||||||||||||||||||||
Post a new message | |||||||||||||||||||||||||||||||||||||||||||||||||||||
Dataset | |||||||||||||||||||||||||||||||||||||||||||||||||||||
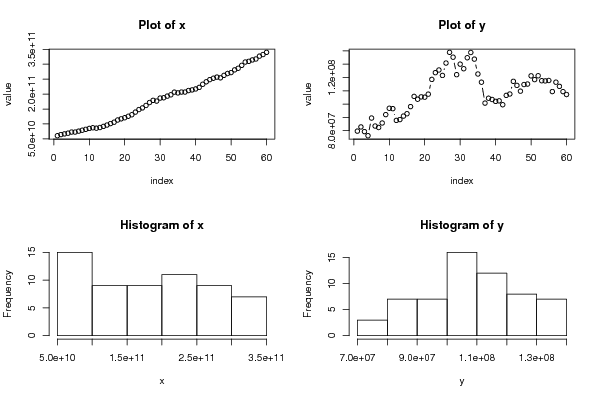
| Dataseries X: | |||||||||||||||||||||||||||||||||||||||||||||||||||||
60635408600.00 64463389370.00 66750859382.00 69032584255.95 72841303906.58 72838685607.53 75887977453.76 78936158549.66 81986612544.38 85038924238.38 87328862789.67 85794984680.72 88082838620.17 91885510657.40 96355573323.80 101321342608.80 105791395836.80 113241494103.00 117215849652.80 120940898880.60 125658810316.50 130873880200.80 139583536623.40 148226520849.00 153789461350.00 161871513310.40 171781295610.40 178996585758.20 176620960002.00 186604680395.00 187772917033.20 193109744878.60 197630528464.00 206483683756.40 203906590621.60 206783719069.34 206759082201.76 211878483671.40 214009149959.00 217203709135.40 222331811922.60 232825724880.00 241180274038.70 248494123822.10 253049202253.08 256922518700.16 254451243638.75 262662316800.94 268926171539.67 272037080259.13 281118338865.04 286389613939.39 296190694318.91 307294826961.69 309697986635.60 314369521231.48 317533640477.42 327005697520.69 332458473876.00 339794119726.27 | |||||||||||||||||||||||||||||||||||||||||||||||||||||
| Dataseries Y: | |||||||||||||||||||||||||||||||||||||||||||||||||||||
79717000 82855667 79346667 76270333 89532667 83541333 82456000 85818333 92106667 96873333 96580000 87769000 88396000 90995667 92785000 98112667 105779667 103660333 105435000 105204000 107466333 118554333 123614333 125620000 121524333 130830333 138871333 135215667 122096333 130005333 126566000 134808667 138761333 133778333 122598667 116446000 100745333 104419333 103477000 102054333 102446667 99528000 106549667 107587333 117091333 114029667 109721333 114697000 115063667 121234667 118393000 121308000 117579000 117414000 117740333 109417000 116442333 113311000 109391333 107198667 | |||||||||||||||||||||||||||||||||||||||||||||||||||||
Tables (Output of Computation) | |||||||||||||||||||||||||||||||||||||||||||||||||||||
| |||||||||||||||||||||||||||||||||||||||||||||||||||||
Figures (Output of Computation) | |||||||||||||||||||||||||||||||||||||||||||||||||||||
Input Parameters & R Code | |||||||||||||||||||||||||||||||||||||||||||||||||||||
| Parameters (Session): | |||||||||||||||||||||||||||||||||||||||||||||||||||||
| par1 = 0 ; par2 = 36 ; | |||||||||||||||||||||||||||||||||||||||||||||||||||||
| Parameters (R input): | |||||||||||||||||||||||||||||||||||||||||||||||||||||
| par1 = BBP Belgi� ; par2 = www.gapminder.org ; par3 = BBP Belgi� ; par4 = Co2-Uitstoot Belgi� ; par5 = www.gapminder.org ; par6 = Co2-uitstoot Belgi� <> BBP ; | |||||||||||||||||||||||||||||||||||||||||||||||||||||
| R code (references can be found in the software module): | |||||||||||||||||||||||||||||||||||||||||||||||||||||
bitmap(file='test1.png') | |||||||||||||||||||||||||||||||||||||||||||||||||||||