Free Statistics

of Irreproducible Research!

Author's title

Author*The author of this computation has been verified*
R Software Modulerwasp_multipleregression.wasp
Title produced by softwareMultiple Regression
Date of computationTue, 22 Nov 2011 02:43:48 -0500
Cite this page as followsStatistical Computations at FreeStatistics.org, Office for Research Development and Education, URL https://freestatistics.org/blog/index.php?v=date/2011/Nov/22/t1321947851r45v2lq8j83s0f8.htm/, Retrieved Sun, 28 Apr 2024 13:37:49 +0000
Statistical Computations at FreeStatistics.org, Office for Research Development and Education, URL https://freestatistics.org/blog/index.php?pk=146068, Retrieved Sun, 28 Apr 2024 13:37:49 +0000
QR Codes:

Original text written by user:
IsPrivate?No (this computation is public)
User-defined keywords
Estimated Impact133
Family? (F = Feedback message, R = changed R code, M = changed R Module, P = changed Parameters, D = changed Data)
-       [Multiple Regression] [] [2011-11-22 07:43:48] [204816f6f70a8d342ddc2b9d4f4a80d3] [Current]
-   P     [Multiple Regression] [] [2011-11-22 08:04:47] [80bca13c5f9401fbb753952fd2952f4a]
-    D      [Multiple Regression] [] [2011-11-22 10:08:56] [80bca13c5f9401fbb753952fd2952f4a]
Feedback Forum

Post a new message
Dataseries X:
116,24	112,42	120,58
116,03	112	120,17
115,94	111,72	120,02
114,19	111,67	120,49
115,74	111,55	120,38
115,4	111,33	120,09
115,2	111,06	119,62
114,82	110,97	118,93
114,33	110,81	119,09
111,84	110,62	118,59
113,16	110,71	117,87
112,52	110,51	117,74
112,39	110,5	117,61
112,24	110,37	117,55
112,1	110,38	117,06
109,85	110,26	117,08
111,89	110,28	117,21
111,88	110,25	117,58
111,48	110,09	117,27
110,98	110,01	117,14
110,42	109,75	116,52
107,9	109,57	116,16
109,46	109,59	114,79
109,23	109,45	114,97
109,02	109,21	114,66
109,04	109	114,3
109,49	108,83	114,48
107,23	108,62	114,96
109	108,56	115,44
109,12	108,41	116,38
109,24	108,27	116,5
108,92	108,03	116,2
109,53	107,67	116,37
107,06	107,31	116,46
109,11	107,14	115,07
109,26	107,02	115,03
109,99	106,79	115,15
110,17	106,49	114,71
110,28	106,14	114,67
109,13	105,94	115,49
110,15	105,87	114,65
109,39	105,71	114,92
108,45	105,48	114,17
108,23	105,31	112,8
107,44	105,09	112,28
104,86	104,88	112,05
106,23	104,76	111,03
105,85	104,62	110,4
104,95	104,49	109,08
104,46	104,29	107,89


Summary of computational transaction
Raw Inputview raw input (R code)
Raw Outputview raw output of R engine
Computing time4 seconds
R Server'Gertrude Mary Cox' @ cox.wessa.net

\begin{tabular}{lllllllll}
\hline
Summary of computational transaction \tabularnewline
Raw Input & view raw input (R code)  \tabularnewline
Raw Output & view raw output of R engine  \tabularnewline
Computing time & 4 seconds \tabularnewline
R Server & 'Gertrude Mary Cox' @ cox.wessa.net \tabularnewline
\hline
\end{tabular}
%Source: https://freestatistics.org/blog/index.php?pk=146068&T=0

[TABLE]
[ROW][C]Summary of computational transaction[/C][/ROW]
[ROW][C]Raw Input[/C][C]view raw input (R code) [/C][/ROW]
[ROW][C]Raw Output[/C][C]view raw output of R engine [/C][/ROW]
[ROW][C]Computing time[/C][C]4 seconds[/C][/ROW]
[ROW][C]R Server[/C][C]'Gertrude Mary Cox' @ cox.wessa.net[/C][/ROW]
[/TABLE]
Source: https://freestatistics.org/blog/index.php?pk=146068&T=0

Globally Unique Identifier (entire table): ba.freestatistics.org/blog/index.php?pk=146068&T=0

As an alternative you can also use a QR Code:  

The GUIDs for individual cells are displayed in the table below:

Summary of computational transaction
Raw Inputview raw input (R code)
Raw Outputview raw output of R engine
Computing time4 seconds
R Server'Gertrude Mary Cox' @ cox.wessa.net


Multiple Linear Regression - Estimated Regression Equation
prijsindex[t] = + 228.733517073554 -1.64854689736647gezondheid[t] + 0.59891940633533tabak[t] -0.34359909436074t + e[t]

\begin{tabular}{lllllllll}
\hline
Multiple Linear Regression - Estimated Regression Equation \tabularnewline
prijsindex[t] =  +  228.733517073554 -1.64854689736647gezondheid[t] +  0.59891940633533tabak[t] -0.34359909436074t  + e[t] \tabularnewline
\hline
\end{tabular}
%Source: https://freestatistics.org/blog/index.php?pk=146068&T=1

[TABLE]
[ROW][C]Multiple Linear Regression - Estimated Regression Equation[/C][/ROW]
[ROW][C]prijsindex[t] =  +  228.733517073554 -1.64854689736647gezondheid[t] +  0.59891940633533tabak[t] -0.34359909436074t  + e[t][/C][/ROW]
[/TABLE]
Source: https://freestatistics.org/blog/index.php?pk=146068&T=1

Globally Unique Identifier (entire table): ba.freestatistics.org/blog/index.php?pk=146068&T=1

As an alternative you can also use a QR Code:  

The GUIDs for individual cells are displayed in the table below:

Multiple Linear Regression - Estimated Regression Equation
prijsindex[t] = + 228.733517073554 -1.64854689736647gezondheid[t] + 0.59891940633533tabak[t] -0.34359909436074t + e[t]


Multiple Linear Regression - Ordinary Least Squares
VariableParameterS.D.T-STATH0: parameter = 02-tail p-value1-tail p-value
(Intercept)228.73351707355443.5075685.25734e-062e-06
gezondheid-1.648546897366470.361864-4.55573.8e-051.9e-05
tabak0.598919406335330.1160595.16055e-063e-06
t-0.343599094360740.062871-5.46512e-061e-06

\begin{tabular}{lllllllll}
\hline
Multiple Linear Regression - Ordinary Least Squares \tabularnewline
Variable & Parameter & S.D. & T-STATH0: parameter = 0 & 2-tail p-value & 1-tail p-value \tabularnewline
(Intercept) & 228.733517073554 & 43.507568 & 5.2573 & 4e-06 & 2e-06 \tabularnewline
gezondheid & -1.64854689736647 & 0.361864 & -4.5557 & 3.8e-05 & 1.9e-05 \tabularnewline
tabak & 0.59891940633533 & 0.116059 & 5.1605 & 5e-06 & 3e-06 \tabularnewline
t & -0.34359909436074 & 0.062871 & -5.4651 & 2e-06 & 1e-06 \tabularnewline
\hline
\end{tabular}
%Source: https://freestatistics.org/blog/index.php?pk=146068&T=2

[TABLE]
[ROW][C]Multiple Linear Regression - Ordinary Least Squares[/C][/ROW]
[ROW][C]Variable[/C][C]Parameter[/C][C]S.D.[/C][C]T-STATH0: parameter = 0[/C][C]2-tail p-value[/C][C]1-tail p-value[/C][/ROW]
[ROW][C](Intercept)[/C][C]228.733517073554[/C][C]43.507568[/C][C]5.2573[/C][C]4e-06[/C][C]2e-06[/C][/ROW]
[ROW][C]gezondheid[/C][C]-1.64854689736647[/C][C]0.361864[/C][C]-4.5557[/C][C]3.8e-05[/C][C]1.9e-05[/C][/ROW]
[ROW][C]tabak[/C][C]0.59891940633533[/C][C]0.116059[/C][C]5.1605[/C][C]5e-06[/C][C]3e-06[/C][/ROW]
[ROW][C]t[/C][C]-0.34359909436074[/C][C]0.062871[/C][C]-5.4651[/C][C]2e-06[/C][C]1e-06[/C][/ROW]
[/TABLE]
Source: https://freestatistics.org/blog/index.php?pk=146068&T=2

Globally Unique Identifier (entire table): ba.freestatistics.org/blog/index.php?pk=146068&T=2

As an alternative you can also use a QR Code:  

The GUIDs for individual cells are displayed in the table below:

Multiple Linear Regression - Ordinary Least Squares
VariableParameterS.D.T-STATH0: parameter = 02-tail p-value1-tail p-value
(Intercept)228.73351707355443.5075685.25734e-062e-06
gezondheid-1.648546897366470.361864-4.55573.8e-051.9e-05
tabak0.598919406335330.1160595.16055e-063e-06
t-0.343599094360740.062871-5.46512e-061e-06


Multiple Linear Regression - Regression Statistics
Multiple R0.951120874863822
R-squared0.904630918601722
Adjusted R-squared0.898411195901834
F-TEST (value)145.445538692272
F-TEST (DF numerator)3
F-TEST (DF denominator)46
p-value0
Multiple Linear Regression - Residual Statistics
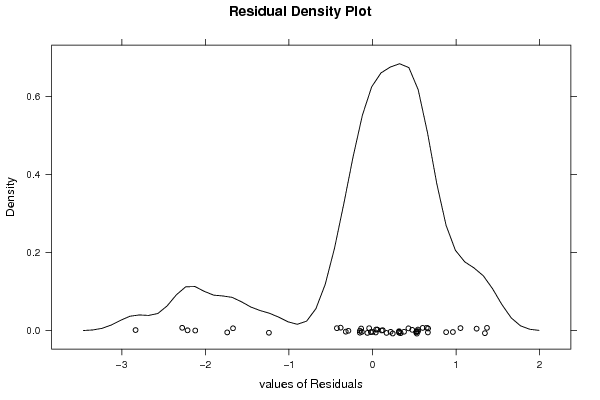
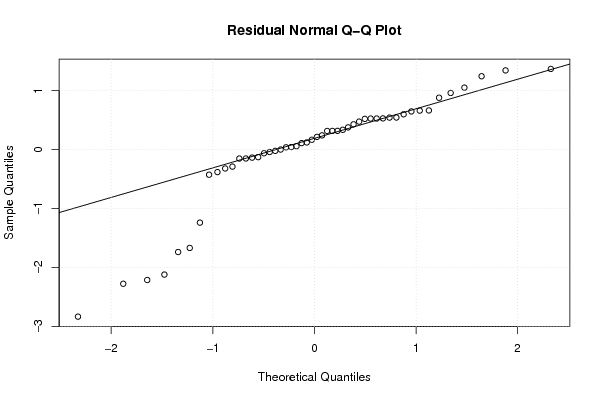
Residual Standard Deviation0.968187319599203
Sum Squared Residuals43.1197875483037

\begin{tabular}{lllllllll}
\hline
Multiple Linear Regression - Regression Statistics \tabularnewline
Multiple R & 0.951120874863822 \tabularnewline
R-squared & 0.904630918601722 \tabularnewline
Adjusted R-squared & 0.898411195901834 \tabularnewline
F-TEST (value) & 145.445538692272 \tabularnewline
F-TEST (DF numerator) & 3 \tabularnewline
F-TEST (DF denominator) & 46 \tabularnewline
p-value & 0 \tabularnewline
Multiple Linear Regression - Residual Statistics \tabularnewline
Residual Standard Deviation & 0.968187319599203 \tabularnewline
Sum Squared Residuals & 43.1197875483037 \tabularnewline
\hline
\end{tabular}
%Source: https://freestatistics.org/blog/index.php?pk=146068&T=3

[TABLE]
[ROW][C]Multiple Linear Regression - Regression Statistics[/C][/ROW]
[ROW][C]Multiple R[/C][C]0.951120874863822[/C][/ROW]
[ROW][C]R-squared[/C][C]0.904630918601722[/C][/ROW]
[ROW][C]Adjusted R-squared[/C][C]0.898411195901834[/C][/ROW]
[ROW][C]F-TEST (value)[/C][C]145.445538692272[/C][/ROW]
[ROW][C]F-TEST (DF numerator)[/C][C]3[/C][/ROW]
[ROW][C]F-TEST (DF denominator)[/C][C]46[/C][/ROW]
[ROW][C]p-value[/C][C]0[/C][/ROW]
[ROW][C]Multiple Linear Regression - Residual Statistics[/C][/ROW]
[ROW][C]Residual Standard Deviation[/C][C]0.968187319599203[/C][/ROW]
[ROW][C]Sum Squared Residuals[/C][C]43.1197875483037[/C][/ROW]
[/TABLE]
Source: https://freestatistics.org/blog/index.php?pk=146068&T=3

Globally Unique Identifier (entire table): ba.freestatistics.org/blog/index.php?pk=146068&T=3

As an alternative you can also use a QR Code:  

The GUIDs for individual cells are displayed in the table below:

Multiple Linear Regression - Regression Statistics
Multiple R0.951120874863822
R-squared0.904630918601722
Adjusted R-squared0.898411195901834
F-TEST (value)145.445538692272
F-TEST (DF numerator)3
F-TEST (DF denominator)46
p-value0
Multiple Linear Regression - Residual Statistics
Residual Standard Deviation0.968187319599203
Sum Squared Residuals43.1197875483037


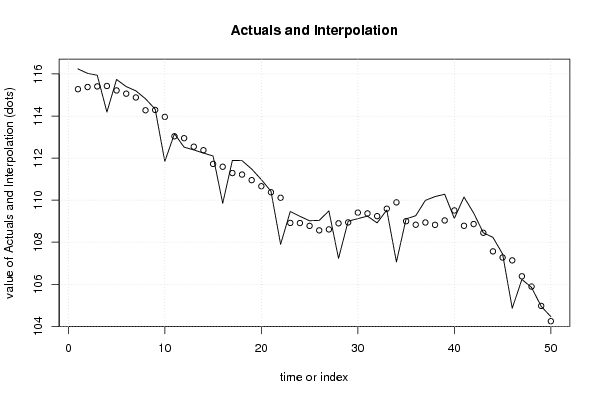
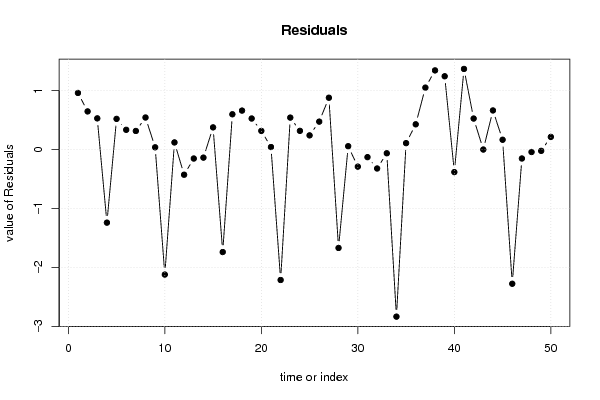
Multiple Linear Regression - Actuals, Interpolation, and Residuals
Time or IndexActualsInterpolationForecastResidualsPrediction Error
1116.24115.2779777931690.962022206831092
2116.03115.3812114391050.6487885608954
3115.94115.4093675650560.530632434943825
4114.19115.429687936541-1.23968793654136
5115.74115.2180333351680.521966664832281
6115.4115.063427930390.336572069609652
7115.2114.8834443773410.316555622659053
8114.82114.2749601133720.545039886628172
9114.33114.2909556276030.0390443723966369
10111.84113.961120740575-2.12112074057458
11113.16113.0379304528890.122069547110556
12112.52112.946181215178-0.426181215178381
13112.39112.541208066968-0.151208066967719
14112.24112.375984904884-0.135984904884497
15112.1111.7224298324460.3775701675542
16109.85111.588634753896-1.73863475389572
17111.89111.2899242444110.600075755588755
18111.88111.2173817373160.662618262684419
19111.48110.951885130570.528114869430492
20110.98110.6623102651740.317689734825508
21110.42110.3760033322010.0439966677988616
22107.9110.113531693086-2.21353169308565
23109.46108.9164420740980.543557925901819
24109.23108.9114450385090.318554961490908
25109.02108.7778321835520.242167816447625
26109.04108.5648169513580.475183048642145
27109.49108.609276322690.880723677310208
28107.23108.899353391817-1.66935339181694
29109108.9421484263390.0578515736608395
30109.12109.408815608539-0.288815608538604
31109.24109.367883408569-0.127883408569423
32108.92109.240259747676-0.320259747676023
33109.53109.591953835444-0.0619538354442193
34107.06109.895734370706-2.83573437070558
35109.11108.9998902740910.110109725908963
36109.26108.8301600311610.429839968839133
37109.99108.9375970519551.05240294804535
38110.17108.8250374880161.34496251198369
39110.28109.034473031481.24552696851958
40109.13109.511697229788-0.38169722978795
41110.15108.7804041169211.36959588307883
42109.39108.862280765850.527719234150375
43108.45108.4486579031320.00134209686834286
44108.23107.5647921946440.665207805356186
45107.44107.2724353264090.167564673590667
46104.86107.137279617038-2.27727961703844
47106.23106.3806083559-0.150608355899617
48105.85105.890486601179-0.0404866011789387
49104.95104.970624987113-0.0206249871132063
50104.46104.2440211786870.21597882131329

\begin{tabular}{lllllllll}
\hline
Multiple Linear Regression - Actuals, Interpolation, and Residuals \tabularnewline
Time or Index & Actuals & InterpolationForecast & ResidualsPrediction Error \tabularnewline
1 & 116.24 & 115.277977793169 & 0.962022206831092 \tabularnewline
2 & 116.03 & 115.381211439105 & 0.6487885608954 \tabularnewline
3 & 115.94 & 115.409367565056 & 0.530632434943825 \tabularnewline
4 & 114.19 & 115.429687936541 & -1.23968793654136 \tabularnewline
5 & 115.74 & 115.218033335168 & 0.521966664832281 \tabularnewline
6 & 115.4 & 115.06342793039 & 0.336572069609652 \tabularnewline
7 & 115.2 & 114.883444377341 & 0.316555622659053 \tabularnewline
8 & 114.82 & 114.274960113372 & 0.545039886628172 \tabularnewline
9 & 114.33 & 114.290955627603 & 0.0390443723966369 \tabularnewline
10 & 111.84 & 113.961120740575 & -2.12112074057458 \tabularnewline
11 & 113.16 & 113.037930452889 & 0.122069547110556 \tabularnewline
12 & 112.52 & 112.946181215178 & -0.426181215178381 \tabularnewline
13 & 112.39 & 112.541208066968 & -0.151208066967719 \tabularnewline
14 & 112.24 & 112.375984904884 & -0.135984904884497 \tabularnewline
15 & 112.1 & 111.722429832446 & 0.3775701675542 \tabularnewline
16 & 109.85 & 111.588634753896 & -1.73863475389572 \tabularnewline
17 & 111.89 & 111.289924244411 & 0.600075755588755 \tabularnewline
18 & 111.88 & 111.217381737316 & 0.662618262684419 \tabularnewline
19 & 111.48 & 110.95188513057 & 0.528114869430492 \tabularnewline
20 & 110.98 & 110.662310265174 & 0.317689734825508 \tabularnewline
21 & 110.42 & 110.376003332201 & 0.0439966677988616 \tabularnewline
22 & 107.9 & 110.113531693086 & -2.21353169308565 \tabularnewline
23 & 109.46 & 108.916442074098 & 0.543557925901819 \tabularnewline
24 & 109.23 & 108.911445038509 & 0.318554961490908 \tabularnewline
25 & 109.02 & 108.777832183552 & 0.242167816447625 \tabularnewline
26 & 109.04 & 108.564816951358 & 0.475183048642145 \tabularnewline
27 & 109.49 & 108.60927632269 & 0.880723677310208 \tabularnewline
28 & 107.23 & 108.899353391817 & -1.66935339181694 \tabularnewline
29 & 109 & 108.942148426339 & 0.0578515736608395 \tabularnewline
30 & 109.12 & 109.408815608539 & -0.288815608538604 \tabularnewline
31 & 109.24 & 109.367883408569 & -0.127883408569423 \tabularnewline
32 & 108.92 & 109.240259747676 & -0.320259747676023 \tabularnewline
33 & 109.53 & 109.591953835444 & -0.0619538354442193 \tabularnewline
34 & 107.06 & 109.895734370706 & -2.83573437070558 \tabularnewline
35 & 109.11 & 108.999890274091 & 0.110109725908963 \tabularnewline
36 & 109.26 & 108.830160031161 & 0.429839968839133 \tabularnewline
37 & 109.99 & 108.937597051955 & 1.05240294804535 \tabularnewline
38 & 110.17 & 108.825037488016 & 1.34496251198369 \tabularnewline
39 & 110.28 & 109.03447303148 & 1.24552696851958 \tabularnewline
40 & 109.13 & 109.511697229788 & -0.38169722978795 \tabularnewline
41 & 110.15 & 108.780404116921 & 1.36959588307883 \tabularnewline
42 & 109.39 & 108.86228076585 & 0.527719234150375 \tabularnewline
43 & 108.45 & 108.448657903132 & 0.00134209686834286 \tabularnewline
44 & 108.23 & 107.564792194644 & 0.665207805356186 \tabularnewline
45 & 107.44 & 107.272435326409 & 0.167564673590667 \tabularnewline
46 & 104.86 & 107.137279617038 & -2.27727961703844 \tabularnewline
47 & 106.23 & 106.3806083559 & -0.150608355899617 \tabularnewline
48 & 105.85 & 105.890486601179 & -0.0404866011789387 \tabularnewline
49 & 104.95 & 104.970624987113 & -0.0206249871132063 \tabularnewline
50 & 104.46 & 104.244021178687 & 0.21597882131329 \tabularnewline
\hline
\end{tabular}
%Source: https://freestatistics.org/blog/index.php?pk=146068&T=4

[TABLE]
[ROW][C]Multiple Linear Regression - Actuals, Interpolation, and Residuals[/C][/ROW]
[ROW][C]Time or Index[/C][C]Actuals[/C][C]InterpolationForecast[/C][C]ResidualsPrediction Error[/C][/ROW]
[ROW][C]1[/C][C]116.24[/C][C]115.277977793169[/C][C]0.962022206831092[/C][/ROW]
[ROW][C]2[/C][C]116.03[/C][C]115.381211439105[/C][C]0.6487885608954[/C][/ROW]
[ROW][C]3[/C][C]115.94[/C][C]115.409367565056[/C][C]0.530632434943825[/C][/ROW]
[ROW][C]4[/C][C]114.19[/C][C]115.429687936541[/C][C]-1.23968793654136[/C][/ROW]
[ROW][C]5[/C][C]115.74[/C][C]115.218033335168[/C][C]0.521966664832281[/C][/ROW]
[ROW][C]6[/C][C]115.4[/C][C]115.06342793039[/C][C]0.336572069609652[/C][/ROW]
[ROW][C]7[/C][C]115.2[/C][C]114.883444377341[/C][C]0.316555622659053[/C][/ROW]
[ROW][C]8[/C][C]114.82[/C][C]114.274960113372[/C][C]0.545039886628172[/C][/ROW]
[ROW][C]9[/C][C]114.33[/C][C]114.290955627603[/C][C]0.0390443723966369[/C][/ROW]
[ROW][C]10[/C][C]111.84[/C][C]113.961120740575[/C][C]-2.12112074057458[/C][/ROW]
[ROW][C]11[/C][C]113.16[/C][C]113.037930452889[/C][C]0.122069547110556[/C][/ROW]
[ROW][C]12[/C][C]112.52[/C][C]112.946181215178[/C][C]-0.426181215178381[/C][/ROW]
[ROW][C]13[/C][C]112.39[/C][C]112.541208066968[/C][C]-0.151208066967719[/C][/ROW]
[ROW][C]14[/C][C]112.24[/C][C]112.375984904884[/C][C]-0.135984904884497[/C][/ROW]
[ROW][C]15[/C][C]112.1[/C][C]111.722429832446[/C][C]0.3775701675542[/C][/ROW]
[ROW][C]16[/C][C]109.85[/C][C]111.588634753896[/C][C]-1.73863475389572[/C][/ROW]
[ROW][C]17[/C][C]111.89[/C][C]111.289924244411[/C][C]0.600075755588755[/C][/ROW]
[ROW][C]18[/C][C]111.88[/C][C]111.217381737316[/C][C]0.662618262684419[/C][/ROW]
[ROW][C]19[/C][C]111.48[/C][C]110.95188513057[/C][C]0.528114869430492[/C][/ROW]
[ROW][C]20[/C][C]110.98[/C][C]110.662310265174[/C][C]0.317689734825508[/C][/ROW]
[ROW][C]21[/C][C]110.42[/C][C]110.376003332201[/C][C]0.0439966677988616[/C][/ROW]
[ROW][C]22[/C][C]107.9[/C][C]110.113531693086[/C][C]-2.21353169308565[/C][/ROW]
[ROW][C]23[/C][C]109.46[/C][C]108.916442074098[/C][C]0.543557925901819[/C][/ROW]
[ROW][C]24[/C][C]109.23[/C][C]108.911445038509[/C][C]0.318554961490908[/C][/ROW]
[ROW][C]25[/C][C]109.02[/C][C]108.777832183552[/C][C]0.242167816447625[/C][/ROW]
[ROW][C]26[/C][C]109.04[/C][C]108.564816951358[/C][C]0.475183048642145[/C][/ROW]
[ROW][C]27[/C][C]109.49[/C][C]108.60927632269[/C][C]0.880723677310208[/C][/ROW]
[ROW][C]28[/C][C]107.23[/C][C]108.899353391817[/C][C]-1.66935339181694[/C][/ROW]
[ROW][C]29[/C][C]109[/C][C]108.942148426339[/C][C]0.0578515736608395[/C][/ROW]
[ROW][C]30[/C][C]109.12[/C][C]109.408815608539[/C][C]-0.288815608538604[/C][/ROW]
[ROW][C]31[/C][C]109.24[/C][C]109.367883408569[/C][C]-0.127883408569423[/C][/ROW]
[ROW][C]32[/C][C]108.92[/C][C]109.240259747676[/C][C]-0.320259747676023[/C][/ROW]
[ROW][C]33[/C][C]109.53[/C][C]109.591953835444[/C][C]-0.0619538354442193[/C][/ROW]
[ROW][C]34[/C][C]107.06[/C][C]109.895734370706[/C][C]-2.83573437070558[/C][/ROW]
[ROW][C]35[/C][C]109.11[/C][C]108.999890274091[/C][C]0.110109725908963[/C][/ROW]
[ROW][C]36[/C][C]109.26[/C][C]108.830160031161[/C][C]0.429839968839133[/C][/ROW]
[ROW][C]37[/C][C]109.99[/C][C]108.937597051955[/C][C]1.05240294804535[/C][/ROW]
[ROW][C]38[/C][C]110.17[/C][C]108.825037488016[/C][C]1.34496251198369[/C][/ROW]
[ROW][C]39[/C][C]110.28[/C][C]109.03447303148[/C][C]1.24552696851958[/C][/ROW]
[ROW][C]40[/C][C]109.13[/C][C]109.511697229788[/C][C]-0.38169722978795[/C][/ROW]
[ROW][C]41[/C][C]110.15[/C][C]108.780404116921[/C][C]1.36959588307883[/C][/ROW]
[ROW][C]42[/C][C]109.39[/C][C]108.86228076585[/C][C]0.527719234150375[/C][/ROW]
[ROW][C]43[/C][C]108.45[/C][C]108.448657903132[/C][C]0.00134209686834286[/C][/ROW]
[ROW][C]44[/C][C]108.23[/C][C]107.564792194644[/C][C]0.665207805356186[/C][/ROW]
[ROW][C]45[/C][C]107.44[/C][C]107.272435326409[/C][C]0.167564673590667[/C][/ROW]
[ROW][C]46[/C][C]104.86[/C][C]107.137279617038[/C][C]-2.27727961703844[/C][/ROW]
[ROW][C]47[/C][C]106.23[/C][C]106.3806083559[/C][C]-0.150608355899617[/C][/ROW]
[ROW][C]48[/C][C]105.85[/C][C]105.890486601179[/C][C]-0.0404866011789387[/C][/ROW]
[ROW][C]49[/C][C]104.95[/C][C]104.970624987113[/C][C]-0.0206249871132063[/C][/ROW]
[ROW][C]50[/C][C]104.46[/C][C]104.244021178687[/C][C]0.21597882131329[/C][/ROW]
[/TABLE]
Source: https://freestatistics.org/blog/index.php?pk=146068&T=4

Globally Unique Identifier (entire table): ba.freestatistics.org/blog/index.php?pk=146068&T=4

As an alternative you can also use a QR Code:  

The GUIDs for individual cells are displayed in the table below:

Multiple Linear Regression - Actuals, Interpolation, and Residuals
Time or IndexActualsInterpolationForecastResidualsPrediction Error
1116.24115.2779777931690.962022206831092
2116.03115.3812114391050.6487885608954
3115.94115.4093675650560.530632434943825
4114.19115.429687936541-1.23968793654136
5115.74115.2180333351680.521966664832281
6115.4115.063427930390.336572069609652
7115.2114.8834443773410.316555622659053
8114.82114.2749601133720.545039886628172
9114.33114.2909556276030.0390443723966369
10111.84113.961120740575-2.12112074057458
11113.16113.0379304528890.122069547110556
12112.52112.946181215178-0.426181215178381
13112.39112.541208066968-0.151208066967719
14112.24112.375984904884-0.135984904884497
15112.1111.7224298324460.3775701675542
16109.85111.588634753896-1.73863475389572
17111.89111.2899242444110.600075755588755
18111.88111.2173817373160.662618262684419
19111.48110.951885130570.528114869430492
20110.98110.6623102651740.317689734825508
21110.42110.3760033322010.0439966677988616
22107.9110.113531693086-2.21353169308565
23109.46108.9164420740980.543557925901819
24109.23108.9114450385090.318554961490908
25109.02108.7778321835520.242167816447625
26109.04108.5648169513580.475183048642145
27109.49108.609276322690.880723677310208
28107.23108.899353391817-1.66935339181694
29109108.9421484263390.0578515736608395
30109.12109.408815608539-0.288815608538604
31109.24109.367883408569-0.127883408569423
32108.92109.240259747676-0.320259747676023
33109.53109.591953835444-0.0619538354442193
34107.06109.895734370706-2.83573437070558
35109.11108.9998902740910.110109725908963
36109.26108.8301600311610.429839968839133
37109.99108.9375970519551.05240294804535
38110.17108.8250374880161.34496251198369
39110.28109.034473031481.24552696851958
40109.13109.511697229788-0.38169722978795
41110.15108.7804041169211.36959588307883
42109.39108.862280765850.527719234150375
43108.45108.4486579031320.00134209686834286
44108.23107.5647921946440.665207805356186
45107.44107.2724353264090.167564673590667
46104.86107.137279617038-2.27727961703844
47106.23106.3806083559-0.150608355899617
48105.85105.890486601179-0.0404866011789387
49104.95104.970624987113-0.0206249871132063
50104.46104.2440211786870.21597882131329


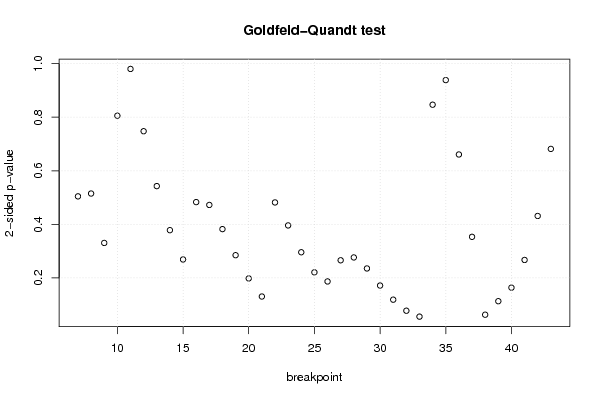
Goldfeld-Quandt test for Heteroskedasticity
p-valuesAlternative Hypothesis
breakpoint indexgreater2-sidedless
70.2522793653435960.5045587306871930.747720634656404
80.2575359165252110.5150718330504220.742464083474789
90.1652500798394470.3305001596788950.834749920160553
100.5971370913644190.8057258172711620.402862908635581
110.4901773720493110.9803547440986220.509822627950689
120.3738767067384140.7477534134768280.626123293261586
130.271413149367320.542826298734640.72858685063268
140.1891333256665270.3782666513330540.810866674333473
150.1344044789127090.2688089578254180.865595521087291
160.2415724003011010.4831448006022020.758427599698899
170.2362342664863150.472468532972630.763765733513685
180.1911006820156320.3822013640312640.808899317984368
190.1423989236555970.2847978473111930.857601076344403
200.09901708183587780.1980341636717560.900982918164122
210.06526724002864230.1305344800572850.934732759971358
220.2409175498549890.4818350997099770.759082450145012
230.1980264632255380.3960529264510760.801973536774462
240.1479003302698640.2958006605397270.852099669730136
250.1103892347078550.220778469415710.889610765292145
260.09338472328891850.1867694465778370.906615276711082
270.1329013766724460.2658027533448920.867098623327554
280.1382103514717730.2764207029435450.861789648528227
290.1176385211334070.2352770422668140.882361478866593
300.08573861132764260.1714772226552850.914261388672357
310.05934854618817270.1186970923763450.940651453811827
320.03870964044682520.07741928089365040.961290359553175
330.0276489684662280.05529793693245590.972351031533772
340.4234015292398630.8468030584797250.576598470760137
350.530616307903160.9387673841936810.469383692096841
360.6695430445014920.6609139109970160.330456955498508
370.8233231709568190.3533536580863620.176676829043181
380.9687443216701480.06251135665970470.0312556783298523
390.9434924751708350.113015049658330.0565075248291652
400.9182074505961290.1635850988077430.0817925494038714
410.866486709875820.2670265802483610.13351329012418
420.7843727000538940.4312545998922130.215627299946106
430.6591253232193970.6817493535612070.340874676780603

\begin{tabular}{lllllllll}
\hline
Goldfeld-Quandt test for Heteroskedasticity \tabularnewline
p-values & Alternative Hypothesis \tabularnewline
breakpoint index & greater & 2-sided & less \tabularnewline
7 & 0.252279365343596 & 0.504558730687193 & 0.747720634656404 \tabularnewline
8 & 0.257535916525211 & 0.515071833050422 & 0.742464083474789 \tabularnewline
9 & 0.165250079839447 & 0.330500159678895 & 0.834749920160553 \tabularnewline
10 & 0.597137091364419 & 0.805725817271162 & 0.402862908635581 \tabularnewline
11 & 0.490177372049311 & 0.980354744098622 & 0.509822627950689 \tabularnewline
12 & 0.373876706738414 & 0.747753413476828 & 0.626123293261586 \tabularnewline
13 & 0.27141314936732 & 0.54282629873464 & 0.72858685063268 \tabularnewline
14 & 0.189133325666527 & 0.378266651333054 & 0.810866674333473 \tabularnewline
15 & 0.134404478912709 & 0.268808957825418 & 0.865595521087291 \tabularnewline
16 & 0.241572400301101 & 0.483144800602202 & 0.758427599698899 \tabularnewline
17 & 0.236234266486315 & 0.47246853297263 & 0.763765733513685 \tabularnewline
18 & 0.191100682015632 & 0.382201364031264 & 0.808899317984368 \tabularnewline
19 & 0.142398923655597 & 0.284797847311193 & 0.857601076344403 \tabularnewline
20 & 0.0990170818358778 & 0.198034163671756 & 0.900982918164122 \tabularnewline
21 & 0.0652672400286423 & 0.130534480057285 & 0.934732759971358 \tabularnewline
22 & 0.240917549854989 & 0.481835099709977 & 0.759082450145012 \tabularnewline
23 & 0.198026463225538 & 0.396052926451076 & 0.801973536774462 \tabularnewline
24 & 0.147900330269864 & 0.295800660539727 & 0.852099669730136 \tabularnewline
25 & 0.110389234707855 & 0.22077846941571 & 0.889610765292145 \tabularnewline
26 & 0.0933847232889185 & 0.186769446577837 & 0.906615276711082 \tabularnewline
27 & 0.132901376672446 & 0.265802753344892 & 0.867098623327554 \tabularnewline
28 & 0.138210351471773 & 0.276420702943545 & 0.861789648528227 \tabularnewline
29 & 0.117638521133407 & 0.235277042266814 & 0.882361478866593 \tabularnewline
30 & 0.0857386113276426 & 0.171477222655285 & 0.914261388672357 \tabularnewline
31 & 0.0593485461881727 & 0.118697092376345 & 0.940651453811827 \tabularnewline
32 & 0.0387096404468252 & 0.0774192808936504 & 0.961290359553175 \tabularnewline
33 & 0.027648968466228 & 0.0552979369324559 & 0.972351031533772 \tabularnewline
34 & 0.423401529239863 & 0.846803058479725 & 0.576598470760137 \tabularnewline
35 & 0.53061630790316 & 0.938767384193681 & 0.469383692096841 \tabularnewline
36 & 0.669543044501492 & 0.660913910997016 & 0.330456955498508 \tabularnewline
37 & 0.823323170956819 & 0.353353658086362 & 0.176676829043181 \tabularnewline
38 & 0.968744321670148 & 0.0625113566597047 & 0.0312556783298523 \tabularnewline
39 & 0.943492475170835 & 0.11301504965833 & 0.0565075248291652 \tabularnewline
40 & 0.918207450596129 & 0.163585098807743 & 0.0817925494038714 \tabularnewline
41 & 0.86648670987582 & 0.267026580248361 & 0.13351329012418 \tabularnewline
42 & 0.784372700053894 & 0.431254599892213 & 0.215627299946106 \tabularnewline
43 & 0.659125323219397 & 0.681749353561207 & 0.340874676780603 \tabularnewline
\hline
\end{tabular}
%Source: https://freestatistics.org/blog/index.php?pk=146068&T=5

[TABLE]
[ROW][C]Goldfeld-Quandt test for Heteroskedasticity[/C][/ROW]
[ROW][C]p-values[/C][C]Alternative Hypothesis[/C][/ROW]
[ROW][C]breakpoint index[/C][C]greater[/C][C]2-sided[/C][C]less[/C][/ROW]
[ROW][C]7[/C][C]0.252279365343596[/C][C]0.504558730687193[/C][C]0.747720634656404[/C][/ROW]
[ROW][C]8[/C][C]0.257535916525211[/C][C]0.515071833050422[/C][C]0.742464083474789[/C][/ROW]
[ROW][C]9[/C][C]0.165250079839447[/C][C]0.330500159678895[/C][C]0.834749920160553[/C][/ROW]
[ROW][C]10[/C][C]0.597137091364419[/C][C]0.805725817271162[/C][C]0.402862908635581[/C][/ROW]
[ROW][C]11[/C][C]0.490177372049311[/C][C]0.980354744098622[/C][C]0.509822627950689[/C][/ROW]
[ROW][C]12[/C][C]0.373876706738414[/C][C]0.747753413476828[/C][C]0.626123293261586[/C][/ROW]
[ROW][C]13[/C][C]0.27141314936732[/C][C]0.54282629873464[/C][C]0.72858685063268[/C][/ROW]
[ROW][C]14[/C][C]0.189133325666527[/C][C]0.378266651333054[/C][C]0.810866674333473[/C][/ROW]
[ROW][C]15[/C][C]0.134404478912709[/C][C]0.268808957825418[/C][C]0.865595521087291[/C][/ROW]
[ROW][C]16[/C][C]0.241572400301101[/C][C]0.483144800602202[/C][C]0.758427599698899[/C][/ROW]
[ROW][C]17[/C][C]0.236234266486315[/C][C]0.47246853297263[/C][C]0.763765733513685[/C][/ROW]
[ROW][C]18[/C][C]0.191100682015632[/C][C]0.382201364031264[/C][C]0.808899317984368[/C][/ROW]
[ROW][C]19[/C][C]0.142398923655597[/C][C]0.284797847311193[/C][C]0.857601076344403[/C][/ROW]
[ROW][C]20[/C][C]0.0990170818358778[/C][C]0.198034163671756[/C][C]0.900982918164122[/C][/ROW]
[ROW][C]21[/C][C]0.0652672400286423[/C][C]0.130534480057285[/C][C]0.934732759971358[/C][/ROW]
[ROW][C]22[/C][C]0.240917549854989[/C][C]0.481835099709977[/C][C]0.759082450145012[/C][/ROW]
[ROW][C]23[/C][C]0.198026463225538[/C][C]0.396052926451076[/C][C]0.801973536774462[/C][/ROW]
[ROW][C]24[/C][C]0.147900330269864[/C][C]0.295800660539727[/C][C]0.852099669730136[/C][/ROW]
[ROW][C]25[/C][C]0.110389234707855[/C][C]0.22077846941571[/C][C]0.889610765292145[/C][/ROW]
[ROW][C]26[/C][C]0.0933847232889185[/C][C]0.186769446577837[/C][C]0.906615276711082[/C][/ROW]
[ROW][C]27[/C][C]0.132901376672446[/C][C]0.265802753344892[/C][C]0.867098623327554[/C][/ROW]
[ROW][C]28[/C][C]0.138210351471773[/C][C]0.276420702943545[/C][C]0.861789648528227[/C][/ROW]
[ROW][C]29[/C][C]0.117638521133407[/C][C]0.235277042266814[/C][C]0.882361478866593[/C][/ROW]
[ROW][C]30[/C][C]0.0857386113276426[/C][C]0.171477222655285[/C][C]0.914261388672357[/C][/ROW]
[ROW][C]31[/C][C]0.0593485461881727[/C][C]0.118697092376345[/C][C]0.940651453811827[/C][/ROW]
[ROW][C]32[/C][C]0.0387096404468252[/C][C]0.0774192808936504[/C][C]0.961290359553175[/C][/ROW]
[ROW][C]33[/C][C]0.027648968466228[/C][C]0.0552979369324559[/C][C]0.972351031533772[/C][/ROW]
[ROW][C]34[/C][C]0.423401529239863[/C][C]0.846803058479725[/C][C]0.576598470760137[/C][/ROW]
[ROW][C]35[/C][C]0.53061630790316[/C][C]0.938767384193681[/C][C]0.469383692096841[/C][/ROW]
[ROW][C]36[/C][C]0.669543044501492[/C][C]0.660913910997016[/C][C]0.330456955498508[/C][/ROW]
[ROW][C]37[/C][C]0.823323170956819[/C][C]0.353353658086362[/C][C]0.176676829043181[/C][/ROW]
[ROW][C]38[/C][C]0.968744321670148[/C][C]0.0625113566597047[/C][C]0.0312556783298523[/C][/ROW]
[ROW][C]39[/C][C]0.943492475170835[/C][C]0.11301504965833[/C][C]0.0565075248291652[/C][/ROW]
[ROW][C]40[/C][C]0.918207450596129[/C][C]0.163585098807743[/C][C]0.0817925494038714[/C][/ROW]
[ROW][C]41[/C][C]0.86648670987582[/C][C]0.267026580248361[/C][C]0.13351329012418[/C][/ROW]
[ROW][C]42[/C][C]0.784372700053894[/C][C]0.431254599892213[/C][C]0.215627299946106[/C][/ROW]
[ROW][C]43[/C][C]0.659125323219397[/C][C]0.681749353561207[/C][C]0.340874676780603[/C][/ROW]
[/TABLE]
Source: https://freestatistics.org/blog/index.php?pk=146068&T=5

Globally Unique Identifier (entire table): ba.freestatistics.org/blog/index.php?pk=146068&T=5

As an alternative you can also use a QR Code:  

The GUIDs for individual cells are displayed in the table below:

Goldfeld-Quandt test for Heteroskedasticity
p-valuesAlternative Hypothesis
breakpoint indexgreater2-sidedless
70.2522793653435960.5045587306871930.747720634656404
80.2575359165252110.5150718330504220.742464083474789
90.1652500798394470.3305001596788950.834749920160553
100.5971370913644190.8057258172711620.402862908635581
110.4901773720493110.9803547440986220.509822627950689
120.3738767067384140.7477534134768280.626123293261586
130.271413149367320.542826298734640.72858685063268
140.1891333256665270.3782666513330540.810866674333473
150.1344044789127090.2688089578254180.865595521087291
160.2415724003011010.4831448006022020.758427599698899
170.2362342664863150.472468532972630.763765733513685
180.1911006820156320.3822013640312640.808899317984368
190.1423989236555970.2847978473111930.857601076344403
200.09901708183587780.1980341636717560.900982918164122
210.06526724002864230.1305344800572850.934732759971358
220.2409175498549890.4818350997099770.759082450145012
230.1980264632255380.3960529264510760.801973536774462
240.1479003302698640.2958006605397270.852099669730136
250.1103892347078550.220778469415710.889610765292145
260.09338472328891850.1867694465778370.906615276711082
270.1329013766724460.2658027533448920.867098623327554
280.1382103514717730.2764207029435450.861789648528227
290.1176385211334070.2352770422668140.882361478866593
300.08573861132764260.1714772226552850.914261388672357
310.05934854618817270.1186970923763450.940651453811827
320.03870964044682520.07741928089365040.961290359553175
330.0276489684662280.05529793693245590.972351031533772
340.4234015292398630.8468030584797250.576598470760137
350.530616307903160.9387673841936810.469383692096841
360.6695430445014920.6609139109970160.330456955498508
370.8233231709568190.3533536580863620.176676829043181
380.9687443216701480.06251135665970470.0312556783298523
390.9434924751708350.113015049658330.0565075248291652
400.9182074505961290.1635850988077430.0817925494038714
410.866486709875820.2670265802483610.13351329012418
420.7843727000538940.4312545998922130.215627299946106
430.6591253232193970.6817493535612070.340874676780603


Meta Analysis of Goldfeld-Quandt test for Heteroskedasticity
Description# significant tests% significant testsOK/NOK
1% type I error level00OK
5% type I error level00OK
10% type I error level30.0810810810810811OK

\begin{tabular}{lllllllll}
\hline
Meta Analysis of Goldfeld-Quandt test for Heteroskedasticity \tabularnewline
Description & # significant tests & % significant tests & OK/NOK \tabularnewline
1% type I error level & 0 & 0 & OK \tabularnewline
5% type I error level & 0 & 0 & OK \tabularnewline
10% type I error level & 3 & 0.0810810810810811 & OK \tabularnewline
\hline
\end{tabular}
%Source: https://freestatistics.org/blog/index.php?pk=146068&T=6

[TABLE]
[ROW][C]Meta Analysis of Goldfeld-Quandt test for Heteroskedasticity[/C][/ROW]
[ROW][C]Description[/C][C]# significant tests[/C][C]% significant tests[/C][C]OK/NOK[/C][/ROW]
[ROW][C]1% type I error level[/C][C]0[/C][C]0[/C][C]OK[/C][/ROW]
[ROW][C]5% type I error level[/C][C]0[/C][C]0[/C][C]OK[/C][/ROW]
[ROW][C]10% type I error level[/C][C]3[/C][C]0.0810810810810811[/C][C]OK[/C][/ROW]
[/TABLE]
Source: https://freestatistics.org/blog/index.php?pk=146068&T=6

Globally Unique Identifier (entire table): ba.freestatistics.org/blog/index.php?pk=146068&T=6

As an alternative you can also use a QR Code:  

The GUIDs for individual cells are displayed in the table below:

Meta Analysis of Goldfeld-Quandt test for Heteroskedasticity
Description# significant tests% significant testsOK/NOK
1% type I error level00OK
5% type I error level00OK
10% type I error level30.0810810810810811OK


Parameters (Session):
par1 = 1 ; par2 = Do not include Seasonal Dummies ; par3 = Linear Trend ;
Parameters (R input):
par1 = 1 ; par2 = Do not include Seasonal Dummies ; par3 = Linear Trend ;
R code (references can be found in the software module):
library(lattice)
library(lmtest)
n25 <- 25 #minimum number of obs. for Goldfeld-Quandt test
par1 <- as.numeric(par1)
x <- t(y)
k <- length(x[1,])
n <- length(x[,1])
x1 <- cbind(x[,par1], x[,1:k!=par1])
mycolnames <- c(colnames(x)[par1], colnames(x)[1:k!=par1])
colnames(x1) <- mycolnames #colnames(x)[par1]
x <- x1
if (par3 == 'First Differences'){
x2 <- array(0, dim=c(n-1,k), dimnames=list(1:(n-1), paste('(1-B)',colnames(x),sep='')))
for (i in 1:n-1) {
for (j in 1:k) {
x2[i,j] <- x[i+1,j] - x[i,j]
}
}
x <- x2
}
if (par2 == 'Include Monthly Dummies'){
x2 <- array(0, dim=c(n,11), dimnames=list(1:n, paste('M', seq(1:11), sep ='')))
for (i in 1:11){
x2[seq(i,n,12),i] <- 1
}
x <- cbind(x, x2)
}
if (par2 == 'Include Quarterly Dummies'){
x2 <- array(0, dim=c(n,3), dimnames=list(1:n, paste('Q', seq(1:3), sep ='')))
for (i in 1:3){
x2[seq(i,n,4),i] <- 1
}
x <- cbind(x, x2)
}
k <- length(x[1,])
if (par3 == 'Linear Trend'){
x <- cbind(x, c(1:n))
colnames(x)[k+1] <- 't'
}
x
k <- length(x[1,])
df <- as.data.frame(x)
(mylm <- lm(df))
(mysum <- summary(mylm))
if (n > n25) {
kp3 <- k + 3
nmkm3 <- n - k - 3
gqarr <- array(NA, dim=c(nmkm3-kp3+1,3))
numgqtests <- 0
numsignificant1 <- 0
numsignificant5 <- 0
numsignificant10 <- 0
for (mypoint in kp3:nmkm3) {
j <- 0
numgqtests <- numgqtests + 1
for (myalt in c('greater', 'two.sided', 'less')) {
j <- j + 1
gqarr[mypoint-kp3+1,j] <- gqtest(mylm, point=mypoint, alternative=myalt)$p.value
}
if (gqarr[mypoint-kp3+1,2] < 0.01) numsignificant1 <- numsignificant1 + 1
if (gqarr[mypoint-kp3+1,2] < 0.05) numsignificant5 <- numsignificant5 + 1
if (gqarr[mypoint-kp3+1,2] < 0.10) numsignificant10 <- numsignificant10 + 1
}
gqarr
}
bitmap(file='test0.png')
plot(x[,1], type='l', main='Actuals and Interpolation', ylab='value of Actuals and Interpolation (dots)', xlab='time or index')
points(x[,1]-mysum$resid)
grid()
dev.off()
bitmap(file='test1.png')
plot(mysum$resid, type='b', pch=19, main='Residuals', ylab='value of Residuals', xlab='time or index')
grid()
dev.off()
bitmap(file='test2.png')
hist(mysum$resid, main='Residual Histogram', xlab='values of Residuals')
grid()
dev.off()
bitmap(file='test3.png')
densityplot(~mysum$resid,col='black',main='Residual Density Plot', xlab='values of Residuals')
dev.off()
bitmap(file='test4.png')
qqnorm(mysum$resid, main='Residual Normal Q-Q Plot')
qqline(mysum$resid)
grid()
dev.off()
(myerror <- as.ts(mysum$resid))
bitmap(file='test5.png')
dum <- cbind(lag(myerror,k=1),myerror)
dum
dum1 <- dum[2:length(myerror),]
dum1
z <- as.data.frame(dum1)
z
plot(z,main=paste('Residual Lag plot, lowess, and regression line'), ylab='values of Residuals', xlab='lagged values of Residuals')
lines(lowess(z))
abline(lm(z))
grid()
dev.off()
bitmap(file='test6.png')
acf(mysum$resid, lag.max=length(mysum$resid)/2, main='Residual Autocorrelation Function')
grid()
dev.off()
bitmap(file='test7.png')
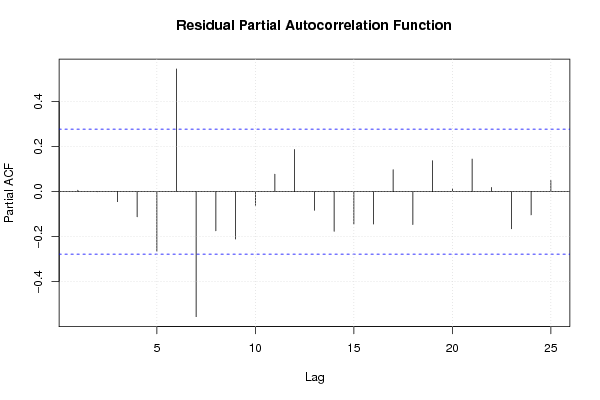
pacf(mysum$resid, lag.max=length(mysum$resid)/2, main='Residual Partial Autocorrelation Function')
grid()
dev.off()
bitmap(file='test8.png')
opar <- par(mfrow = c(2,2), oma = c(0, 0, 1.1, 0))
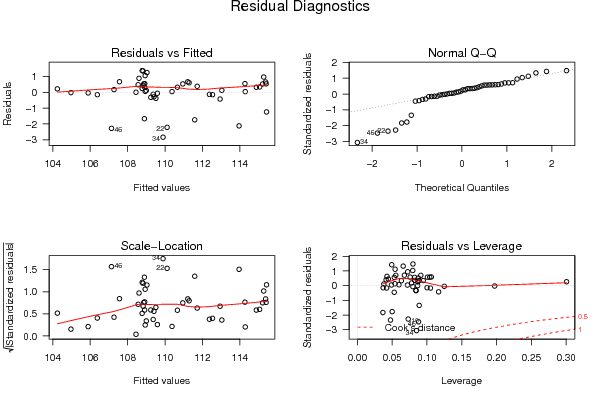
plot(mylm, las = 1, sub='Residual Diagnostics')
par(opar)
dev.off()
if (n > n25) {
bitmap(file='test9.png')
plot(kp3:nmkm3,gqarr[,2], main='Goldfeld-Quandt test',ylab='2-sided p-value',xlab='breakpoint')
grid()
dev.off()
}
load(file='createtable')
a<-table.start()
a<-table.row.start(a)
a<-table.element(a, 'Multiple Linear Regression - Estimated Regression Equation', 1, TRUE)
a<-table.row.end(a)
myeq <- colnames(x)[1]
myeq <- paste(myeq, '[t] = ', sep='')
for (i in 1:k){
if (mysum$coefficients[i,1] > 0) myeq <- paste(myeq, '+', '')
myeq <- paste(myeq, mysum$coefficients[i,1], sep=' ')
if (rownames(mysum$coefficients)[i] != '(Intercept)') {
myeq <- paste(myeq, rownames(mysum$coefficients)[i], sep='')
if (rownames(mysum$coefficients)[i] != 't') myeq <- paste(myeq, '[t]', sep='')
}
}
myeq <- paste(myeq, ' + e[t]')
a<-table.row.start(a)
a<-table.element(a, myeq)
a<-table.row.end(a)
a<-table.end(a)
table.save(a,file='mytable1.tab')
a<-table.start()
a<-table.row.start(a)
a<-table.element(a,hyperlink('ols1.htm','Multiple Linear Regression - Ordinary Least Squares',''), 6, TRUE)
a<-table.row.end(a)
a<-table.row.start(a)
a<-table.element(a,'Variable',header=TRUE)
a<-table.element(a,'Parameter',header=TRUE)
a<-table.element(a,'S.D.',header=TRUE)
a<-table.element(a,'T-STAT
H0: parameter = 0',header=TRUE)
a<-table.element(a,'2-tail p-value',header=TRUE)
a<-table.element(a,'1-tail p-value',header=TRUE)
a<-table.row.end(a)
for (i in 1:k){
a<-table.row.start(a)
a<-table.element(a,rownames(mysum$coefficients)[i],header=TRUE)
a<-table.element(a,mysum$coefficients[i,1])
a<-table.element(a, round(mysum$coefficients[i,2],6))
a<-table.element(a, round(mysum$coefficients[i,3],4))
a<-table.element(a, round(mysum$coefficients[i,4],6))
a<-table.element(a, round(mysum$coefficients[i,4]/2,6))
a<-table.row.end(a)
}
a<-table.end(a)
table.save(a,file='mytable2.tab')
a<-table.start()
a<-table.row.start(a)
a<-table.element(a, 'Multiple Linear Regression - Regression Statistics', 2, TRUE)
a<-table.row.end(a)
a<-table.row.start(a)
a<-table.element(a, 'Multiple R',1,TRUE)
a<-table.element(a, sqrt(mysum$r.squared))
a<-table.row.end(a)
a<-table.row.start(a)
a<-table.element(a, 'R-squared',1,TRUE)
a<-table.element(a, mysum$r.squared)
a<-table.row.end(a)
a<-table.row.start(a)
a<-table.element(a, 'Adjusted R-squared',1,TRUE)
a<-table.element(a, mysum$adj.r.squared)
a<-table.row.end(a)
a<-table.row.start(a)
a<-table.element(a, 'F-TEST (value)',1,TRUE)
a<-table.element(a, mysum$fstatistic[1])
a<-table.row.end(a)
a<-table.row.start(a)
a<-table.element(a, 'F-TEST (DF numerator)',1,TRUE)
a<-table.element(a, mysum$fstatistic[2])
a<-table.row.end(a)
a<-table.row.start(a)
a<-table.element(a, 'F-TEST (DF denominator)',1,TRUE)
a<-table.element(a, mysum$fstatistic[3])
a<-table.row.end(a)
a<-table.row.start(a)
a<-table.element(a, 'p-value',1,TRUE)
a<-table.element(a, 1-pf(mysum$fstatistic[1],mysum$fstatistic[2],mysum$fstatistic[3]))
a<-table.row.end(a)
a<-table.row.start(a)
a<-table.element(a, 'Multiple Linear Regression - Residual Statistics', 2, TRUE)
a<-table.row.end(a)
a<-table.row.start(a)
a<-table.element(a, 'Residual Standard Deviation',1,TRUE)
a<-table.element(a, mysum$sigma)
a<-table.row.end(a)
a<-table.row.start(a)
a<-table.element(a, 'Sum Squared Residuals',1,TRUE)
a<-table.element(a, sum(myerror*myerror))
a<-table.row.end(a)
a<-table.end(a)
table.save(a,file='mytable3.tab')
a<-table.start()
a<-table.row.start(a)
a<-table.element(a, 'Multiple Linear Regression - Actuals, Interpolation, and Residuals', 4, TRUE)
a<-table.row.end(a)
a<-table.row.start(a)
a<-table.element(a, 'Time or Index', 1, TRUE)
a<-table.element(a, 'Actuals', 1, TRUE)
a<-table.element(a, 'Interpolation
Forecast', 1, TRUE)
a<-table.element(a, 'Residuals
Prediction Error', 1, TRUE)
a<-table.row.end(a)
for (i in 1:n) {
a<-table.row.start(a)
a<-table.element(a,i, 1, TRUE)
a<-table.element(a,x[i])
a<-table.element(a,x[i]-mysum$resid[i])
a<-table.element(a,mysum$resid[i])
a<-table.row.end(a)
}
a<-table.end(a)
table.save(a,file='mytable4.tab')
if (n > n25) {
a<-table.start()
a<-table.row.start(a)
a<-table.element(a,'Goldfeld-Quandt test for Heteroskedasticity',4,TRUE)
a<-table.row.end(a)
a<-table.row.start(a)
a<-table.element(a,'p-values',header=TRUE)
a<-table.element(a,'Alternative Hypothesis',3,header=TRUE)
a<-table.row.end(a)
a<-table.row.start(a)
a<-table.element(a,'breakpoint index',header=TRUE)
a<-table.element(a,'greater',header=TRUE)
a<-table.element(a,'2-sided',header=TRUE)
a<-table.element(a,'less',header=TRUE)
a<-table.row.end(a)
for (mypoint in kp3:nmkm3) {
a<-table.row.start(a)
a<-table.element(a,mypoint,header=TRUE)
a<-table.element(a,gqarr[mypoint-kp3+1,1])
a<-table.element(a,gqarr[mypoint-kp3+1,2])
a<-table.element(a,gqarr[mypoint-kp3+1,3])
a<-table.row.end(a)
}
a<-table.end(a)
table.save(a,file='mytable5.tab')
a<-table.start()
a<-table.row.start(a)
a<-table.element(a,'Meta Analysis of Goldfeld-Quandt test for Heteroskedasticity',4,TRUE)
a<-table.row.end(a)
a<-table.row.start(a)
a<-table.element(a,'Description',header=TRUE)
a<-table.element(a,'# significant tests',header=TRUE)
a<-table.element(a,'% significant tests',header=TRUE)
a<-table.element(a,'OK/NOK',header=TRUE)
a<-table.row.end(a)
a<-table.row.start(a)
a<-table.element(a,'1% type I error level',header=TRUE)
a<-table.element(a,numsignificant1)
a<-table.element(a,numsignificant1/numgqtests)
if (numsignificant1/numgqtests < 0.01) dum <- 'OK' else dum <- 'NOK'
a<-table.element(a,dum)
a<-table.row.end(a)
a<-table.row.start(a)
a<-table.element(a,'5% type I error level',header=TRUE)
a<-table.element(a,numsignificant5)
a<-table.element(a,numsignificant5/numgqtests)
if (numsignificant5/numgqtests < 0.05) dum <- 'OK' else dum <- 'NOK'
a<-table.element(a,dum)
a<-table.row.end(a)
a<-table.row.start(a)
a<-table.element(a,'10% type I error level',header=TRUE)
a<-table.element(a,numsignificant10)
a<-table.element(a,numsignificant10/numgqtests)
if (numsignificant10/numgqtests < 0.1) dum <- 'OK' else dum <- 'NOK'
a<-table.element(a,dum)
a<-table.row.end(a)
a<-table.end(a)
table.save(a,file='mytable6.tab')
}