Free Statistics

of Irreproducible Research!

Author's title

Author*Unverified author*
R Software Modulerwasp_smp.wasp
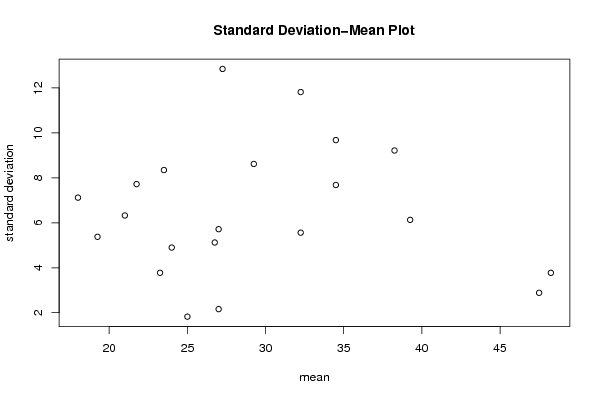
Title produced by softwareStandard Deviation-Mean Plot
Date of computationWed, 30 Nov 2011 07:43:27 -0500
Cite this page as followsStatistical Computations at FreeStatistics.org, Office for Research Development and Education, URL https://freestatistics.org/blog/index.php?v=date/2011/Nov/30/t1322657053x9gsw1bxpkf6r3s.htm/, Retrieved Mon, 29 Apr 2024 16:50:25 +0000
Statistical Computations at FreeStatistics.org, Office for Research Development and Education, URL https://freestatistics.org/blog/index.php?pk=148911, Retrieved Mon, 29 Apr 2024 16:50:25 +0000
QR Codes:

Original text written by user:
IsPrivate?No (this computation is public)
User-defined keywordsKDGP2W83
Estimated Impact86
Family? (F = Feedback message, R = changed R code, M = changed R Module, P = changed Parameters, D = changed Data)
-       [Standard Deviation-Mean Plot] [Standard deviatio...] [2011-11-30 12:43:27] [18e7d68ff235439d3990cca8ff3322f3] [Current]
Feedback Forum

Post a new message
Dataseries X:
43
30
42
23
19
19
36
20
27
24
23
26
31
51
39
32
30
46
31
31
40
29
43
17
53
47
49
44
48
51
47
44
33
47
41
36
46
24
17
22
30
24
18
24
24
28
19
22
26
14
16
21
15
23
29
17
24
18
22
8
26
22
34
25
20
35
38
24
14
25
31
17
32
27
30
19
36
27
28
38
26
25
30
27


Summary of computational transaction
Raw Inputview raw input (R code)
Raw Outputview raw output of R engine
Computing time1 seconds
R Server'Gwilym Jenkins' @ jenkins.wessa.net

\begin{tabular}{lllllllll}
\hline
Summary of computational transaction \tabularnewline
Raw Input & view raw input (R code)  \tabularnewline
Raw Output & view raw output of R engine  \tabularnewline
Computing time & 1 seconds \tabularnewline
R Server & 'Gwilym Jenkins' @ jenkins.wessa.net \tabularnewline
\hline
\end{tabular}
%Source: https://freestatistics.org/blog/index.php?pk=148911&T=0

[TABLE]
[ROW][C]Summary of computational transaction[/C][/ROW]
[ROW][C]Raw Input[/C][C]view raw input (R code) [/C][/ROW]
[ROW][C]Raw Output[/C][C]view raw output of R engine [/C][/ROW]
[ROW][C]Computing time[/C][C]1 seconds[/C][/ROW]
[ROW][C]R Server[/C][C]'Gwilym Jenkins' @ jenkins.wessa.net[/C][/ROW]
[/TABLE]
Source: https://freestatistics.org/blog/index.php?pk=148911&T=0

Globally Unique Identifier (entire table): ba.freestatistics.org/blog/index.php?pk=148911&T=0

As an alternative you can also use a QR Code:  

The GUIDs for individual cells are displayed in the table below:

Summary of computational transaction
Raw Inputview raw input (R code)
Raw Outputview raw output of R engine
Computing time1 seconds
R Server'Gwilym Jenkins' @ jenkins.wessa.net


Standard Deviation-Mean Plot
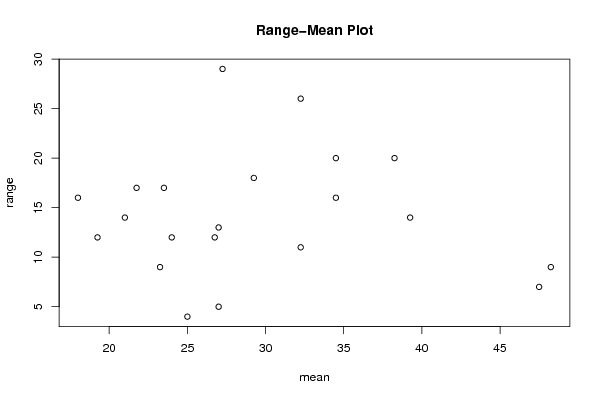
SectionMeanStandard DeviationRange
134.59.6781540939719820
223.58.3466560170326117
3251.825741858350554
438.259.2150239645193920
534.57.6811457478686116
632.2511.814539065631526
748.253.774917217635379
847.52.886751345948137
939.256.1305247192498414
1027.2512.841988423397229
11244.8989794855663612
1223.253.774917217635379
1319.255.3774219349672312
14216.3245553203367614
15187.1180521680208716
1626.755.123475382979812
1729.258.6168439698070418
1821.757.7190241179396117
19275.7154760664940813
2032.255.5602757725374311
21272.160246899469295

\begin{tabular}{lllllllll}
\hline
Standard Deviation-Mean Plot \tabularnewline
Section & Mean & Standard Deviation & Range \tabularnewline
1 & 34.5 & 9.67815409397198 & 20 \tabularnewline
2 & 23.5 & 8.34665601703261 & 17 \tabularnewline
3 & 25 & 1.82574185835055 & 4 \tabularnewline
4 & 38.25 & 9.21502396451939 & 20 \tabularnewline
5 & 34.5 & 7.68114574786861 & 16 \tabularnewline
6 & 32.25 & 11.8145390656315 & 26 \tabularnewline
7 & 48.25 & 3.77491721763537 & 9 \tabularnewline
8 & 47.5 & 2.88675134594813 & 7 \tabularnewline
9 & 39.25 & 6.13052471924984 & 14 \tabularnewline
10 & 27.25 & 12.8419884233972 & 29 \tabularnewline
11 & 24 & 4.89897948556636 & 12 \tabularnewline
12 & 23.25 & 3.77491721763537 & 9 \tabularnewline
13 & 19.25 & 5.37742193496723 & 12 \tabularnewline
14 & 21 & 6.32455532033676 & 14 \tabularnewline
15 & 18 & 7.11805216802087 & 16 \tabularnewline
16 & 26.75 & 5.1234753829798 & 12 \tabularnewline
17 & 29.25 & 8.61684396980704 & 18 \tabularnewline
18 & 21.75 & 7.71902411793961 & 17 \tabularnewline
19 & 27 & 5.71547606649408 & 13 \tabularnewline
20 & 32.25 & 5.56027577253743 & 11 \tabularnewline
21 & 27 & 2.16024689946929 & 5 \tabularnewline
\hline
\end{tabular}
%Source: https://freestatistics.org/blog/index.php?pk=148911&T=1

[TABLE]
[ROW][C]Standard Deviation-Mean Plot[/C][/ROW]
[ROW][C]Section[/C][C]Mean[/C][C]Standard Deviation[/C][C]Range[/C][/ROW]
[ROW][C]1[/C][C]34.5[/C][C]9.67815409397198[/C][C]20[/C][/ROW]
[ROW][C]2[/C][C]23.5[/C][C]8.34665601703261[/C][C]17[/C][/ROW]
[ROW][C]3[/C][C]25[/C][C]1.82574185835055[/C][C]4[/C][/ROW]
[ROW][C]4[/C][C]38.25[/C][C]9.21502396451939[/C][C]20[/C][/ROW]
[ROW][C]5[/C][C]34.5[/C][C]7.68114574786861[/C][C]16[/C][/ROW]
[ROW][C]6[/C][C]32.25[/C][C]11.8145390656315[/C][C]26[/C][/ROW]
[ROW][C]7[/C][C]48.25[/C][C]3.77491721763537[/C][C]9[/C][/ROW]
[ROW][C]8[/C][C]47.5[/C][C]2.88675134594813[/C][C]7[/C][/ROW]
[ROW][C]9[/C][C]39.25[/C][C]6.13052471924984[/C][C]14[/C][/ROW]
[ROW][C]10[/C][C]27.25[/C][C]12.8419884233972[/C][C]29[/C][/ROW]
[ROW][C]11[/C][C]24[/C][C]4.89897948556636[/C][C]12[/C][/ROW]
[ROW][C]12[/C][C]23.25[/C][C]3.77491721763537[/C][C]9[/C][/ROW]
[ROW][C]13[/C][C]19.25[/C][C]5.37742193496723[/C][C]12[/C][/ROW]
[ROW][C]14[/C][C]21[/C][C]6.32455532033676[/C][C]14[/C][/ROW]
[ROW][C]15[/C][C]18[/C][C]7.11805216802087[/C][C]16[/C][/ROW]
[ROW][C]16[/C][C]26.75[/C][C]5.1234753829798[/C][C]12[/C][/ROW]
[ROW][C]17[/C][C]29.25[/C][C]8.61684396980704[/C][C]18[/C][/ROW]
[ROW][C]18[/C][C]21.75[/C][C]7.71902411793961[/C][C]17[/C][/ROW]
[ROW][C]19[/C][C]27[/C][C]5.71547606649408[/C][C]13[/C][/ROW]
[ROW][C]20[/C][C]32.25[/C][C]5.56027577253743[/C][C]11[/C][/ROW]
[ROW][C]21[/C][C]27[/C][C]2.16024689946929[/C][C]5[/C][/ROW]
[/TABLE]
Source: https://freestatistics.org/blog/index.php?pk=148911&T=1

Globally Unique Identifier (entire table): ba.freestatistics.org/blog/index.php?pk=148911&T=1

As an alternative you can also use a QR Code:  

The GUIDs for individual cells are displayed in the table below:

Standard Deviation-Mean Plot
SectionMeanStandard DeviationRange
134.59.6781540939719820
223.58.3466560170326117
3251.825741858350554
438.259.2150239645193920
534.57.6811457478686116
632.2511.814539065631526
748.253.774917217635379
847.52.886751345948137
939.256.1305247192498414
1027.2512.841988423397229
11244.8989794855663612
1223.253.774917217635379
1319.255.3774219349672312
14216.3245553203367614
15187.1180521680208716
1626.755.123475382979812
1729.258.6168439698070418
1821.757.7190241179396117
19275.7154760664940813
2032.255.5602757725374311
21272.160246899469295


Regression: S.E.(k) = alpha + beta * Mean(k)
alpha7.08331441490287
beta-0.0196287082268678
S.D.0.0796084087758674
T-STAT-0.246565765208688
p-value0.807888614318818

\begin{tabular}{lllllllll}
\hline
Regression: S.E.(k) = alpha + beta * Mean(k) \tabularnewline
alpha & 7.08331441490287 \tabularnewline
beta & -0.0196287082268678 \tabularnewline
S.D. & 0.0796084087758674 \tabularnewline
T-STAT & -0.246565765208688 \tabularnewline
p-value & 0.807888614318818 \tabularnewline
\hline
\end{tabular}
%Source: https://freestatistics.org/blog/index.php?pk=148911&T=2

[TABLE]
[ROW][C]Regression: S.E.(k) = alpha + beta * Mean(k)[/C][/ROW]
[ROW][C]alpha[/C][C]7.08331441490287[/C][/ROW]
[ROW][C]beta[/C][C]-0.0196287082268678[/C][/ROW]
[ROW][C]S.D.[/C][C]0.0796084087758674[/C][/ROW]
[ROW][C]T-STAT[/C][C]-0.246565765208688[/C][/ROW]
[ROW][C]p-value[/C][C]0.807888614318818[/C][/ROW]
[/TABLE]
Source: https://freestatistics.org/blog/index.php?pk=148911&T=2

Globally Unique Identifier (entire table): ba.freestatistics.org/blog/index.php?pk=148911&T=2

As an alternative you can also use a QR Code:  

The GUIDs for individual cells are displayed in the table below:

Regression: S.E.(k) = alpha + beta * Mean(k)
alpha7.08331441490287
beta-0.0196287082268678
S.D.0.0796084087758674
T-STAT-0.246565765208688
p-value0.807888614318818


Regression: ln S.E.(k) = alpha + beta * ln Mean(k)
alpha2.04503595615056
beta-0.0853574309764783
S.D.0.432235679296362
T-STAT-0.197478910383872
p-value0.845550105236564
Lambda1.08535743097648

\begin{tabular}{lllllllll}
\hline
Regression: ln S.E.(k) = alpha + beta * ln Mean(k) \tabularnewline
alpha & 2.04503595615056 \tabularnewline
beta & -0.0853574309764783 \tabularnewline
S.D. & 0.432235679296362 \tabularnewline
T-STAT & -0.197478910383872 \tabularnewline
p-value & 0.845550105236564 \tabularnewline
Lambda & 1.08535743097648 \tabularnewline
\hline
\end{tabular}
%Source: https://freestatistics.org/blog/index.php?pk=148911&T=3

[TABLE]
[ROW][C]Regression: ln S.E.(k) = alpha + beta * ln Mean(k)[/C][/ROW]
[ROW][C]alpha[/C][C]2.04503595615056[/C][/ROW]
[ROW][C]beta[/C][C]-0.0853574309764783[/C][/ROW]
[ROW][C]S.D.[/C][C]0.432235679296362[/C][/ROW]
[ROW][C]T-STAT[/C][C]-0.197478910383872[/C][/ROW]
[ROW][C]p-value[/C][C]0.845550105236564[/C][/ROW]
[ROW][C]Lambda[/C][C]1.08535743097648[/C][/ROW]
[/TABLE]
Source: https://freestatistics.org/blog/index.php?pk=148911&T=3

Globally Unique Identifier (entire table): ba.freestatistics.org/blog/index.php?pk=148911&T=3

As an alternative you can also use a QR Code:  

The GUIDs for individual cells are displayed in the table below:

Regression: ln S.E.(k) = alpha + beta * ln Mean(k)
alpha2.04503595615056
beta-0.0853574309764783
S.D.0.432235679296362
T-STAT-0.197478910383872
p-value0.845550105236564
Lambda1.08535743097648


Parameters (Session):
par1 = 4 ;
Parameters (R input):
par1 = 4 ;
R code (references can be found in the software module):
par1 <- as.numeric(par1)
(n <- length(x))
(np <- floor(n / par1))
arr <- array(NA,dim=c(par1,np))
j <- 0
k <- 1
for (i in 1:(np*par1))
{
j = j + 1
arr[j,k] <- x[i]
if (j == par1) {
j = 0
k=k+1
}
}
arr
arr.mean <- array(NA,dim=np)
arr.sd <- array(NA,dim=np)
arr.range <- array(NA,dim=np)
for (j in 1:np)
{
arr.mean[j] <- mean(arr[,j],na.rm=TRUE)
arr.sd[j] <- sd(arr[,j],na.rm=TRUE)
arr.range[j] <- max(arr[,j],na.rm=TRUE) - min(arr[,j],na.rm=TRUE)
}
arr.mean
arr.sd
arr.range
(lm1 <- lm(arr.sd~arr.mean))
(lnlm1 <- lm(log(arr.sd)~log(arr.mean)))
(lm2 <- lm(arr.range~arr.mean))
bitmap(file='test1.png')
plot(arr.mean,arr.sd,main='Standard Deviation-Mean Plot',xlab='mean',ylab='standard deviation')
dev.off()
bitmap(file='test2.png')
plot(arr.mean,arr.range,main='Range-Mean Plot',xlab='mean',ylab='range')
dev.off()
load(file='createtable')
a<-table.start()
a<-table.row.start(a)
a<-table.element(a,'Standard Deviation-Mean Plot',4,TRUE)
a<-table.row.end(a)
a<-table.row.start(a)
a<-table.element(a,'Section',header=TRUE)
a<-table.element(a,'Mean',header=TRUE)
a<-table.element(a,'Standard Deviation',header=TRUE)
a<-table.element(a,'Range',header=TRUE)
a<-table.row.end(a)
for (j in 1:np) {
a<-table.row.start(a)
a<-table.element(a,j,header=TRUE)
a<-table.element(a,arr.mean[j])
a<-table.element(a,arr.sd[j] )
a<-table.element(a,arr.range[j] )
a<-table.row.end(a)
}
a<-table.end(a)
table.save(a,file='mytable.tab')
a<-table.start()
a<-table.row.start(a)
a<-table.element(a,'Regression: S.E.(k) = alpha + beta * Mean(k)',2,TRUE)
a<-table.row.end(a)
a<-table.row.start(a)
a<-table.element(a,'alpha',header=TRUE)
a<-table.element(a,lm1$coefficients[[1]])
a<-table.row.end(a)
a<-table.row.start(a)
a<-table.element(a,'beta',header=TRUE)
a<-table.element(a,lm1$coefficients[[2]])
a<-table.row.end(a)
a<-table.row.start(a)
a<-table.element(a,'S.D.',header=TRUE)
a<-table.element(a,summary(lm1)$coefficients[2,2])
a<-table.row.end(a)
a<-table.row.start(a)
a<-table.element(a,'T-STAT',header=TRUE)
a<-table.element(a,summary(lm1)$coefficients[2,3])
a<-table.row.end(a)
a<-table.row.start(a)
a<-table.element(a,'p-value',header=TRUE)
a<-table.element(a,summary(lm1)$coefficients[2,4])
a<-table.row.end(a)
a<-table.end(a)
table.save(a,file='mytable1.tab')
a<-table.start()
a<-table.row.start(a)
a<-table.element(a,'Regression: ln S.E.(k) = alpha + beta * ln Mean(k)',2,TRUE)
a<-table.row.end(a)
a<-table.row.start(a)
a<-table.element(a,'alpha',header=TRUE)
a<-table.element(a,lnlm1$coefficients[[1]])
a<-table.row.end(a)
a<-table.row.start(a)
a<-table.element(a,'beta',header=TRUE)
a<-table.element(a,lnlm1$coefficients[[2]])
a<-table.row.end(a)
a<-table.row.start(a)
a<-table.element(a,'S.D.',header=TRUE)
a<-table.element(a,summary(lnlm1)$coefficients[2,2])
a<-table.row.end(a)
a<-table.row.start(a)
a<-table.element(a,'T-STAT',header=TRUE)
a<-table.element(a,summary(lnlm1)$coefficients[2,3])
a<-table.row.end(a)
a<-table.row.start(a)
a<-table.element(a,'p-value',header=TRUE)
a<-table.element(a,summary(lnlm1)$coefficients[2,4])
a<-table.row.end(a)
a<-table.row.start(a)
a<-table.element(a,'Lambda',header=TRUE)
a<-table.element(a,1-lnlm1$coefficients[[2]])
a<-table.row.end(a)
a<-table.end(a)
table.save(a,file='mytable2.tab')