Free Statistics

of Irreproducible Research!

Author's title

Author*Unverified author*
R Software Modulerwasp_autocorrelation.wasp
Title produced by software(Partial) Autocorrelation Function
Date of computationSun, 01 Apr 2012 11:40:55 -0400
Cite this page as followsStatistical Computations at FreeStatistics.org, Office for Research Development and Education, URL https://freestatistics.org/blog/index.php?v=date/2012/Apr/01/t13332949536iup0kiul87az1f.htm/, Retrieved Wed, 01 May 2024 04:09:13 +0000
Statistical Computations at FreeStatistics.org, Office for Research Development and Education, URL https://freestatistics.org/blog/index.php?pk=164250, Retrieved Wed, 01 May 2024 04:09:13 +0000
QR Codes:

Original text written by user:
IsPrivate?No (this computation is public)
User-defined keywordsKDGP2W12
Estimated Impact202
Family? (F = Feedback message, R = changed R code, M = changed R Module, P = changed Parameters, D = changed Data)
-       [(Partial) Autocorrelation Function] [VerdesseldonckIan...] [2012-04-01 15:40:55] [f846b3a26bb0d084da7285efcbdb2f3f] [Current]
Feedback Forum

Post a new message
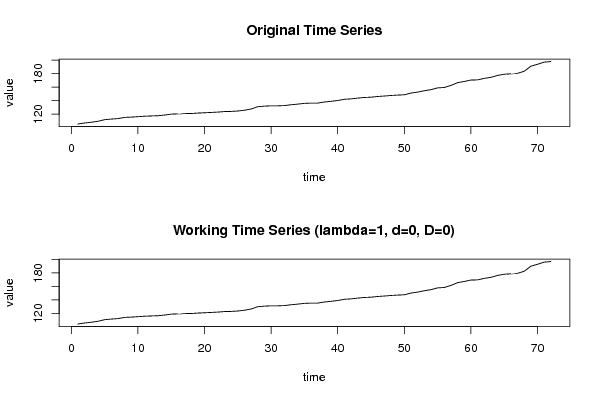
Dataseries X:
105,32
106,93
107,99
109,41
111,79
112,7
113,41
115,14
115,6
116,21
116,9
117,31
117,62
118,66
120
120,41
120,8
120,93
121,54
122,04
122,5
123,01
123,79
123,99
124,58
125,77
127,6
130,97
131,79
132,29
132,29
132,65
133,88
134,79
135,9
136,33
136,33
137,91
138,92
140,12
141,92
142,57
143,69
144,61
145,02
146,07
146,77
147,55
148,14
148,62
151,16
152,56
154,55
156,17
158,8
159,39
162,44
166,48
168,3
170,32
170,64
172,85
174,38
177,2
178,96
179,62
180,27
183,38
190,81
193,72
196,86
197,73


Summary of computational transaction
Raw Inputview raw input (R code)
Raw Outputview raw output of R engine
Computing time1 seconds
R Server'Gertrude Mary Cox' @ cox.wessa.net

\begin{tabular}{lllllllll}
\hline
Summary of computational transaction \tabularnewline
Raw Input & view raw input (R code)  \tabularnewline
Raw Output & view raw output of R engine  \tabularnewline
Computing time & 1 seconds \tabularnewline
R Server & 'Gertrude Mary Cox' @ cox.wessa.net \tabularnewline
\hline
\end{tabular}
%Source: https://freestatistics.org/blog/index.php?pk=164250&T=0

[TABLE]
[ROW][C]Summary of computational transaction[/C][/ROW]
[ROW][C]Raw Input[/C][C]view raw input (R code) [/C][/ROW]
[ROW][C]Raw Output[/C][C]view raw output of R engine [/C][/ROW]
[ROW][C]Computing time[/C][C]1 seconds[/C][/ROW]
[ROW][C]R Server[/C][C]'Gertrude Mary Cox' @ cox.wessa.net[/C][/ROW]
[/TABLE]
Source: https://freestatistics.org/blog/index.php?pk=164250&T=0

Globally Unique Identifier (entire table): ba.freestatistics.org/blog/index.php?pk=164250&T=0

As an alternative you can also use a QR Code:  

The GUIDs for individual cells are displayed in the table below:

Summary of computational transaction
Raw Inputview raw input (R code)
Raw Outputview raw output of R engine
Computing time1 seconds
R Server'Gertrude Mary Cox' @ cox.wessa.net


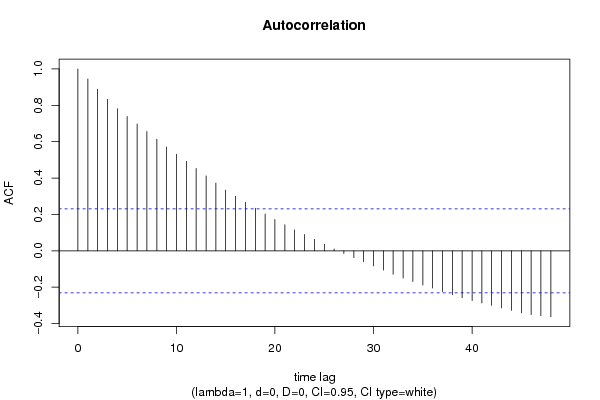
Autocorrelation Function
Time lag kACF(k)T-STATP-value
10.9447618.01660
20.8883127.53760
30.8337227.07440
40.7814886.63110
50.7385596.26690
60.6977075.92020
70.6555795.56280
80.6130965.20231e-06
90.5712294.8473e-06
100.5313934.5091.2e-05
110.4918654.17364.1e-05
120.4528643.84270.00013
130.4120063.4960.000406
140.3723243.15930.001156
150.3339192.83340.002985
160.2993032.53970.006627
170.2670852.26630.01322
180.2338031.98390.025541
190.2025331.71850.044997
200.1721391.46060.074232
210.1431491.21470.114233
220.115020.9760.166172
230.089490.75940.225061
240.0631060.53550.296988
250.0363930.30880.37918
260.0101030.08570.46596
27-0.015184-0.12880.448922
28-0.037604-0.31910.375295
29-0.060225-0.5110.305449
30-0.082725-0.70190.242489
31-0.105442-0.89470.186963
32-0.128517-1.09050.139564
33-0.149372-1.26750.104536
34-0.168968-1.43370.077988
35-0.187443-1.59050.058051
36-0.204684-1.73680.043349
37-0.223357-1.89520.031037
38-0.241267-2.04720.022144
39-0.257843-2.18790.015963
40-0.273139-2.31770.011657
41-0.286319-2.42950.008808
42-0.299888-2.54460.006542
43-0.313792-2.66260.004779
44-0.327581-2.77960.003469
45-0.34096-2.89310.002521
46-0.349822-2.96830.002032
47-0.356533-3.02530.001721
48-0.361869-3.07060.001507

\begin{tabular}{lllllllll}
\hline
Autocorrelation Function \tabularnewline
Time lag k & ACF(k) & T-STAT & P-value \tabularnewline
1 & 0.944761 & 8.0166 & 0 \tabularnewline
2 & 0.888312 & 7.5376 & 0 \tabularnewline
3 & 0.833722 & 7.0744 & 0 \tabularnewline
4 & 0.781488 & 6.6311 & 0 \tabularnewline
5 & 0.738559 & 6.2669 & 0 \tabularnewline
6 & 0.697707 & 5.9202 & 0 \tabularnewline
7 & 0.655579 & 5.5628 & 0 \tabularnewline
8 & 0.613096 & 5.2023 & 1e-06 \tabularnewline
9 & 0.571229 & 4.847 & 3e-06 \tabularnewline
10 & 0.531393 & 4.509 & 1.2e-05 \tabularnewline
11 & 0.491865 & 4.1736 & 4.1e-05 \tabularnewline
12 & 0.452864 & 3.8427 & 0.00013 \tabularnewline
13 & 0.412006 & 3.496 & 0.000406 \tabularnewline
14 & 0.372324 & 3.1593 & 0.001156 \tabularnewline
15 & 0.333919 & 2.8334 & 0.002985 \tabularnewline
16 & 0.299303 & 2.5397 & 0.006627 \tabularnewline
17 & 0.267085 & 2.2663 & 0.01322 \tabularnewline
18 & 0.233803 & 1.9839 & 0.025541 \tabularnewline
19 & 0.202533 & 1.7185 & 0.044997 \tabularnewline
20 & 0.172139 & 1.4606 & 0.074232 \tabularnewline
21 & 0.143149 & 1.2147 & 0.114233 \tabularnewline
22 & 0.11502 & 0.976 & 0.166172 \tabularnewline
23 & 0.08949 & 0.7594 & 0.225061 \tabularnewline
24 & 0.063106 & 0.5355 & 0.296988 \tabularnewline
25 & 0.036393 & 0.3088 & 0.37918 \tabularnewline
26 & 0.010103 & 0.0857 & 0.46596 \tabularnewline
27 & -0.015184 & -0.1288 & 0.448922 \tabularnewline
28 & -0.037604 & -0.3191 & 0.375295 \tabularnewline
29 & -0.060225 & -0.511 & 0.305449 \tabularnewline
30 & -0.082725 & -0.7019 & 0.242489 \tabularnewline
31 & -0.105442 & -0.8947 & 0.186963 \tabularnewline
32 & -0.128517 & -1.0905 & 0.139564 \tabularnewline
33 & -0.149372 & -1.2675 & 0.104536 \tabularnewline
34 & -0.168968 & -1.4337 & 0.077988 \tabularnewline
35 & -0.187443 & -1.5905 & 0.058051 \tabularnewline
36 & -0.204684 & -1.7368 & 0.043349 \tabularnewline
37 & -0.223357 & -1.8952 & 0.031037 \tabularnewline
38 & -0.241267 & -2.0472 & 0.022144 \tabularnewline
39 & -0.257843 & -2.1879 & 0.015963 \tabularnewline
40 & -0.273139 & -2.3177 & 0.011657 \tabularnewline
41 & -0.286319 & -2.4295 & 0.008808 \tabularnewline
42 & -0.299888 & -2.5446 & 0.006542 \tabularnewline
43 & -0.313792 & -2.6626 & 0.004779 \tabularnewline
44 & -0.327581 & -2.7796 & 0.003469 \tabularnewline
45 & -0.34096 & -2.8931 & 0.002521 \tabularnewline
46 & -0.349822 & -2.9683 & 0.002032 \tabularnewline
47 & -0.356533 & -3.0253 & 0.001721 \tabularnewline
48 & -0.361869 & -3.0706 & 0.001507 \tabularnewline
\hline
\end{tabular}
%Source: https://freestatistics.org/blog/index.php?pk=164250&T=1

[TABLE]
[ROW][C]Autocorrelation Function[/C][/ROW]
[ROW][C]Time lag k[/C][C]ACF(k)[/C][C]T-STAT[/C][C]P-value[/C][/ROW]
[ROW][C]1[/C][C]0.944761[/C][C]8.0166[/C][C]0[/C][/ROW]
[ROW][C]2[/C][C]0.888312[/C][C]7.5376[/C][C]0[/C][/ROW]
[ROW][C]3[/C][C]0.833722[/C][C]7.0744[/C][C]0[/C][/ROW]
[ROW][C]4[/C][C]0.781488[/C][C]6.6311[/C][C]0[/C][/ROW]
[ROW][C]5[/C][C]0.738559[/C][C]6.2669[/C][C]0[/C][/ROW]
[ROW][C]6[/C][C]0.697707[/C][C]5.9202[/C][C]0[/C][/ROW]
[ROW][C]7[/C][C]0.655579[/C][C]5.5628[/C][C]0[/C][/ROW]
[ROW][C]8[/C][C]0.613096[/C][C]5.2023[/C][C]1e-06[/C][/ROW]
[ROW][C]9[/C][C]0.571229[/C][C]4.847[/C][C]3e-06[/C][/ROW]
[ROW][C]10[/C][C]0.531393[/C][C]4.509[/C][C]1.2e-05[/C][/ROW]
[ROW][C]11[/C][C]0.491865[/C][C]4.1736[/C][C]4.1e-05[/C][/ROW]
[ROW][C]12[/C][C]0.452864[/C][C]3.8427[/C][C]0.00013[/C][/ROW]
[ROW][C]13[/C][C]0.412006[/C][C]3.496[/C][C]0.000406[/C][/ROW]
[ROW][C]14[/C][C]0.372324[/C][C]3.1593[/C][C]0.001156[/C][/ROW]
[ROW][C]15[/C][C]0.333919[/C][C]2.8334[/C][C]0.002985[/C][/ROW]
[ROW][C]16[/C][C]0.299303[/C][C]2.5397[/C][C]0.006627[/C][/ROW]
[ROW][C]17[/C][C]0.267085[/C][C]2.2663[/C][C]0.01322[/C][/ROW]
[ROW][C]18[/C][C]0.233803[/C][C]1.9839[/C][C]0.025541[/C][/ROW]
[ROW][C]19[/C][C]0.202533[/C][C]1.7185[/C][C]0.044997[/C][/ROW]
[ROW][C]20[/C][C]0.172139[/C][C]1.4606[/C][C]0.074232[/C][/ROW]
[ROW][C]21[/C][C]0.143149[/C][C]1.2147[/C][C]0.114233[/C][/ROW]
[ROW][C]22[/C][C]0.11502[/C][C]0.976[/C][C]0.166172[/C][/ROW]
[ROW][C]23[/C][C]0.08949[/C][C]0.7594[/C][C]0.225061[/C][/ROW]
[ROW][C]24[/C][C]0.063106[/C][C]0.5355[/C][C]0.296988[/C][/ROW]
[ROW][C]25[/C][C]0.036393[/C][C]0.3088[/C][C]0.37918[/C][/ROW]
[ROW][C]26[/C][C]0.010103[/C][C]0.0857[/C][C]0.46596[/C][/ROW]
[ROW][C]27[/C][C]-0.015184[/C][C]-0.1288[/C][C]0.448922[/C][/ROW]
[ROW][C]28[/C][C]-0.037604[/C][C]-0.3191[/C][C]0.375295[/C][/ROW]
[ROW][C]29[/C][C]-0.060225[/C][C]-0.511[/C][C]0.305449[/C][/ROW]
[ROW][C]30[/C][C]-0.082725[/C][C]-0.7019[/C][C]0.242489[/C][/ROW]
[ROW][C]31[/C][C]-0.105442[/C][C]-0.8947[/C][C]0.186963[/C][/ROW]
[ROW][C]32[/C][C]-0.128517[/C][C]-1.0905[/C][C]0.139564[/C][/ROW]
[ROW][C]33[/C][C]-0.149372[/C][C]-1.2675[/C][C]0.104536[/C][/ROW]
[ROW][C]34[/C][C]-0.168968[/C][C]-1.4337[/C][C]0.077988[/C][/ROW]
[ROW][C]35[/C][C]-0.187443[/C][C]-1.5905[/C][C]0.058051[/C][/ROW]
[ROW][C]36[/C][C]-0.204684[/C][C]-1.7368[/C][C]0.043349[/C][/ROW]
[ROW][C]37[/C][C]-0.223357[/C][C]-1.8952[/C][C]0.031037[/C][/ROW]
[ROW][C]38[/C][C]-0.241267[/C][C]-2.0472[/C][C]0.022144[/C][/ROW]
[ROW][C]39[/C][C]-0.257843[/C][C]-2.1879[/C][C]0.015963[/C][/ROW]
[ROW][C]40[/C][C]-0.273139[/C][C]-2.3177[/C][C]0.011657[/C][/ROW]
[ROW][C]41[/C][C]-0.286319[/C][C]-2.4295[/C][C]0.008808[/C][/ROW]
[ROW][C]42[/C][C]-0.299888[/C][C]-2.5446[/C][C]0.006542[/C][/ROW]
[ROW][C]43[/C][C]-0.313792[/C][C]-2.6626[/C][C]0.004779[/C][/ROW]
[ROW][C]44[/C][C]-0.327581[/C][C]-2.7796[/C][C]0.003469[/C][/ROW]
[ROW][C]45[/C][C]-0.34096[/C][C]-2.8931[/C][C]0.002521[/C][/ROW]
[ROW][C]46[/C][C]-0.349822[/C][C]-2.9683[/C][C]0.002032[/C][/ROW]
[ROW][C]47[/C][C]-0.356533[/C][C]-3.0253[/C][C]0.001721[/C][/ROW]
[ROW][C]48[/C][C]-0.361869[/C][C]-3.0706[/C][C]0.001507[/C][/ROW]
[/TABLE]
Source: https://freestatistics.org/blog/index.php?pk=164250&T=1

Globally Unique Identifier (entire table): ba.freestatistics.org/blog/index.php?pk=164250&T=1

As an alternative you can also use a QR Code:  

The GUIDs for individual cells are displayed in the table below:

Autocorrelation Function
Time lag kACF(k)T-STATP-value
10.9447618.01660
20.8883127.53760
30.8337227.07440
40.7814886.63110
50.7385596.26690
60.6977075.92020
70.6555795.56280
80.6130965.20231e-06
90.5712294.8473e-06
100.5313934.5091.2e-05
110.4918654.17364.1e-05
120.4528643.84270.00013
130.4120063.4960.000406
140.3723243.15930.001156
150.3339192.83340.002985
160.2993032.53970.006627
170.2670852.26630.01322
180.2338031.98390.025541
190.2025331.71850.044997
200.1721391.46060.074232
210.1431491.21470.114233
220.115020.9760.166172
230.089490.75940.225061
240.0631060.53550.296988
250.0363930.30880.37918
260.0101030.08570.46596
27-0.015184-0.12880.448922
28-0.037604-0.31910.375295
29-0.060225-0.5110.305449
30-0.082725-0.70190.242489
31-0.105442-0.89470.186963
32-0.128517-1.09050.139564
33-0.149372-1.26750.104536
34-0.168968-1.43370.077988
35-0.187443-1.59050.058051
36-0.204684-1.73680.043349
37-0.223357-1.89520.031037
38-0.241267-2.04720.022144
39-0.257843-2.18790.015963
40-0.273139-2.31770.011657
41-0.286319-2.42950.008808
42-0.299888-2.54460.006542
43-0.313792-2.66260.004779
44-0.327581-2.77960.003469
45-0.34096-2.89310.002521
46-0.349822-2.96830.002032
47-0.356533-3.02530.001721
48-0.361869-3.07060.001507


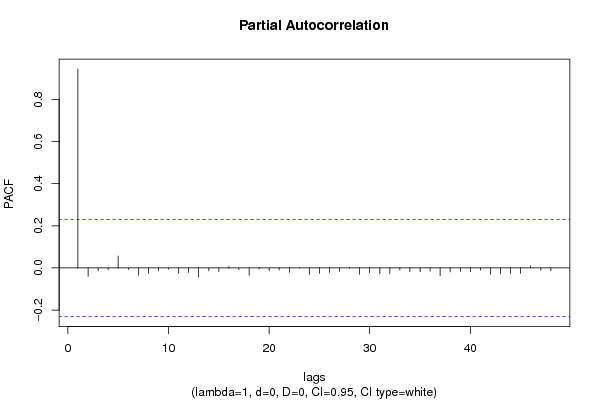
Partial Autocorrelation Function
Time lag kPACF(k)T-STATP-value
10.9447618.01660
2-0.03967-0.33660.368696
3-0.012448-0.10560.458087
4-0.008176-0.06940.472441
50.0572040.48540.314436
6-0.007014-0.05950.476352
7-0.033935-0.28790.387107
8-0.025148-0.21340.415814
9-0.013393-0.11360.454919
10-0.005314-0.04510.482079
11-0.02502-0.21230.416235
12-0.021685-0.1840.427264
13-0.042496-0.36060.35973
14-0.013814-0.11720.453509
15-0.016806-0.14260.4435
160.0064580.05480.478226
17-0.007695-0.06530.47406
18-0.034443-0.29230.385464
19-0.004328-0.03670.485405
20-0.013313-0.1130.455187
21-0.009969-0.08460.466412
22-0.020464-0.17360.431317
230.0006730.00570.497728
24-0.031027-0.26330.396546
25-0.025138-0.21330.415848
26-0.021828-0.18520.426792
27-0.015374-0.13050.448285
28-0.001895-0.01610.493606
29-0.029896-0.25370.400236
30-0.023096-0.1960.422592
31-0.027039-0.22940.409591
32-0.02629-0.22310.412055
33-0.009399-0.07980.468328
34-0.017145-0.14550.442368
35-0.017661-0.14990.440648
36-0.015084-0.1280.449256
37-0.036948-0.31350.377398
38-0.018614-0.15790.437473
39-0.015817-0.13420.446805
40-0.018218-0.15460.438789
41-0.009418-0.07990.468263
42-0.030545-0.25920.398116
43-0.027771-0.23560.407189
44-0.026534-0.22520.41125
45-0.025349-0.21510.41515
460.0106670.09050.464066
47-0.010152-0.08610.465795
48-0.012683-0.10760.457298

\begin{tabular}{lllllllll}
\hline
Partial Autocorrelation Function \tabularnewline
Time lag k & PACF(k) & T-STAT & P-value \tabularnewline
1 & 0.944761 & 8.0166 & 0 \tabularnewline
2 & -0.03967 & -0.3366 & 0.368696 \tabularnewline
3 & -0.012448 & -0.1056 & 0.458087 \tabularnewline
4 & -0.008176 & -0.0694 & 0.472441 \tabularnewline
5 & 0.057204 & 0.4854 & 0.314436 \tabularnewline
6 & -0.007014 & -0.0595 & 0.476352 \tabularnewline
7 & -0.033935 & -0.2879 & 0.387107 \tabularnewline
8 & -0.025148 & -0.2134 & 0.415814 \tabularnewline
9 & -0.013393 & -0.1136 & 0.454919 \tabularnewline
10 & -0.005314 & -0.0451 & 0.482079 \tabularnewline
11 & -0.02502 & -0.2123 & 0.416235 \tabularnewline
12 & -0.021685 & -0.184 & 0.427264 \tabularnewline
13 & -0.042496 & -0.3606 & 0.35973 \tabularnewline
14 & -0.013814 & -0.1172 & 0.453509 \tabularnewline
15 & -0.016806 & -0.1426 & 0.4435 \tabularnewline
16 & 0.006458 & 0.0548 & 0.478226 \tabularnewline
17 & -0.007695 & -0.0653 & 0.47406 \tabularnewline
18 & -0.034443 & -0.2923 & 0.385464 \tabularnewline
19 & -0.004328 & -0.0367 & 0.485405 \tabularnewline
20 & -0.013313 & -0.113 & 0.455187 \tabularnewline
21 & -0.009969 & -0.0846 & 0.466412 \tabularnewline
22 & -0.020464 & -0.1736 & 0.431317 \tabularnewline
23 & 0.000673 & 0.0057 & 0.497728 \tabularnewline
24 & -0.031027 & -0.2633 & 0.396546 \tabularnewline
25 & -0.025138 & -0.2133 & 0.415848 \tabularnewline
26 & -0.021828 & -0.1852 & 0.426792 \tabularnewline
27 & -0.015374 & -0.1305 & 0.448285 \tabularnewline
28 & -0.001895 & -0.0161 & 0.493606 \tabularnewline
29 & -0.029896 & -0.2537 & 0.400236 \tabularnewline
30 & -0.023096 & -0.196 & 0.422592 \tabularnewline
31 & -0.027039 & -0.2294 & 0.409591 \tabularnewline
32 & -0.02629 & -0.2231 & 0.412055 \tabularnewline
33 & -0.009399 & -0.0798 & 0.468328 \tabularnewline
34 & -0.017145 & -0.1455 & 0.442368 \tabularnewline
35 & -0.017661 & -0.1499 & 0.440648 \tabularnewline
36 & -0.015084 & -0.128 & 0.449256 \tabularnewline
37 & -0.036948 & -0.3135 & 0.377398 \tabularnewline
38 & -0.018614 & -0.1579 & 0.437473 \tabularnewline
39 & -0.015817 & -0.1342 & 0.446805 \tabularnewline
40 & -0.018218 & -0.1546 & 0.438789 \tabularnewline
41 & -0.009418 & -0.0799 & 0.468263 \tabularnewline
42 & -0.030545 & -0.2592 & 0.398116 \tabularnewline
43 & -0.027771 & -0.2356 & 0.407189 \tabularnewline
44 & -0.026534 & -0.2252 & 0.41125 \tabularnewline
45 & -0.025349 & -0.2151 & 0.41515 \tabularnewline
46 & 0.010667 & 0.0905 & 0.464066 \tabularnewline
47 & -0.010152 & -0.0861 & 0.465795 \tabularnewline
48 & -0.012683 & -0.1076 & 0.457298 \tabularnewline
\hline
\end{tabular}
%Source: https://freestatistics.org/blog/index.php?pk=164250&T=2

[TABLE]
[ROW][C]Partial Autocorrelation Function[/C][/ROW]
[ROW][C]Time lag k[/C][C]PACF(k)[/C][C]T-STAT[/C][C]P-value[/C][/ROW]
[ROW][C]1[/C][C]0.944761[/C][C]8.0166[/C][C]0[/C][/ROW]
[ROW][C]2[/C][C]-0.03967[/C][C]-0.3366[/C][C]0.368696[/C][/ROW]
[ROW][C]3[/C][C]-0.012448[/C][C]-0.1056[/C][C]0.458087[/C][/ROW]
[ROW][C]4[/C][C]-0.008176[/C][C]-0.0694[/C][C]0.472441[/C][/ROW]
[ROW][C]5[/C][C]0.057204[/C][C]0.4854[/C][C]0.314436[/C][/ROW]
[ROW][C]6[/C][C]-0.007014[/C][C]-0.0595[/C][C]0.476352[/C][/ROW]
[ROW][C]7[/C][C]-0.033935[/C][C]-0.2879[/C][C]0.387107[/C][/ROW]
[ROW][C]8[/C][C]-0.025148[/C][C]-0.2134[/C][C]0.415814[/C][/ROW]
[ROW][C]9[/C][C]-0.013393[/C][C]-0.1136[/C][C]0.454919[/C][/ROW]
[ROW][C]10[/C][C]-0.005314[/C][C]-0.0451[/C][C]0.482079[/C][/ROW]
[ROW][C]11[/C][C]-0.02502[/C][C]-0.2123[/C][C]0.416235[/C][/ROW]
[ROW][C]12[/C][C]-0.021685[/C][C]-0.184[/C][C]0.427264[/C][/ROW]
[ROW][C]13[/C][C]-0.042496[/C][C]-0.3606[/C][C]0.35973[/C][/ROW]
[ROW][C]14[/C][C]-0.013814[/C][C]-0.1172[/C][C]0.453509[/C][/ROW]
[ROW][C]15[/C][C]-0.016806[/C][C]-0.1426[/C][C]0.4435[/C][/ROW]
[ROW][C]16[/C][C]0.006458[/C][C]0.0548[/C][C]0.478226[/C][/ROW]
[ROW][C]17[/C][C]-0.007695[/C][C]-0.0653[/C][C]0.47406[/C][/ROW]
[ROW][C]18[/C][C]-0.034443[/C][C]-0.2923[/C][C]0.385464[/C][/ROW]
[ROW][C]19[/C][C]-0.004328[/C][C]-0.0367[/C][C]0.485405[/C][/ROW]
[ROW][C]20[/C][C]-0.013313[/C][C]-0.113[/C][C]0.455187[/C][/ROW]
[ROW][C]21[/C][C]-0.009969[/C][C]-0.0846[/C][C]0.466412[/C][/ROW]
[ROW][C]22[/C][C]-0.020464[/C][C]-0.1736[/C][C]0.431317[/C][/ROW]
[ROW][C]23[/C][C]0.000673[/C][C]0.0057[/C][C]0.497728[/C][/ROW]
[ROW][C]24[/C][C]-0.031027[/C][C]-0.2633[/C][C]0.396546[/C][/ROW]
[ROW][C]25[/C][C]-0.025138[/C][C]-0.2133[/C][C]0.415848[/C][/ROW]
[ROW][C]26[/C][C]-0.021828[/C][C]-0.1852[/C][C]0.426792[/C][/ROW]
[ROW][C]27[/C][C]-0.015374[/C][C]-0.1305[/C][C]0.448285[/C][/ROW]
[ROW][C]28[/C][C]-0.001895[/C][C]-0.0161[/C][C]0.493606[/C][/ROW]
[ROW][C]29[/C][C]-0.029896[/C][C]-0.2537[/C][C]0.400236[/C][/ROW]
[ROW][C]30[/C][C]-0.023096[/C][C]-0.196[/C][C]0.422592[/C][/ROW]
[ROW][C]31[/C][C]-0.027039[/C][C]-0.2294[/C][C]0.409591[/C][/ROW]
[ROW][C]32[/C][C]-0.02629[/C][C]-0.2231[/C][C]0.412055[/C][/ROW]
[ROW][C]33[/C][C]-0.009399[/C][C]-0.0798[/C][C]0.468328[/C][/ROW]
[ROW][C]34[/C][C]-0.017145[/C][C]-0.1455[/C][C]0.442368[/C][/ROW]
[ROW][C]35[/C][C]-0.017661[/C][C]-0.1499[/C][C]0.440648[/C][/ROW]
[ROW][C]36[/C][C]-0.015084[/C][C]-0.128[/C][C]0.449256[/C][/ROW]
[ROW][C]37[/C][C]-0.036948[/C][C]-0.3135[/C][C]0.377398[/C][/ROW]
[ROW][C]38[/C][C]-0.018614[/C][C]-0.1579[/C][C]0.437473[/C][/ROW]
[ROW][C]39[/C][C]-0.015817[/C][C]-0.1342[/C][C]0.446805[/C][/ROW]
[ROW][C]40[/C][C]-0.018218[/C][C]-0.1546[/C][C]0.438789[/C][/ROW]
[ROW][C]41[/C][C]-0.009418[/C][C]-0.0799[/C][C]0.468263[/C][/ROW]
[ROW][C]42[/C][C]-0.030545[/C][C]-0.2592[/C][C]0.398116[/C][/ROW]
[ROW][C]43[/C][C]-0.027771[/C][C]-0.2356[/C][C]0.407189[/C][/ROW]
[ROW][C]44[/C][C]-0.026534[/C][C]-0.2252[/C][C]0.41125[/C][/ROW]
[ROW][C]45[/C][C]-0.025349[/C][C]-0.2151[/C][C]0.41515[/C][/ROW]
[ROW][C]46[/C][C]0.010667[/C][C]0.0905[/C][C]0.464066[/C][/ROW]
[ROW][C]47[/C][C]-0.010152[/C][C]-0.0861[/C][C]0.465795[/C][/ROW]
[ROW][C]48[/C][C]-0.012683[/C][C]-0.1076[/C][C]0.457298[/C][/ROW]
[/TABLE]
Source: https://freestatistics.org/blog/index.php?pk=164250&T=2

Globally Unique Identifier (entire table): ba.freestatistics.org/blog/index.php?pk=164250&T=2

As an alternative you can also use a QR Code:  

The GUIDs for individual cells are displayed in the table below:

Partial Autocorrelation Function
Time lag kPACF(k)T-STATP-value
10.9447618.01660
2-0.03967-0.33660.368696
3-0.012448-0.10560.458087
4-0.008176-0.06940.472441
50.0572040.48540.314436
6-0.007014-0.05950.476352
7-0.033935-0.28790.387107
8-0.025148-0.21340.415814
9-0.013393-0.11360.454919
10-0.005314-0.04510.482079
11-0.02502-0.21230.416235
12-0.021685-0.1840.427264
13-0.042496-0.36060.35973
14-0.013814-0.11720.453509
15-0.016806-0.14260.4435
160.0064580.05480.478226
17-0.007695-0.06530.47406
18-0.034443-0.29230.385464
19-0.004328-0.03670.485405
20-0.013313-0.1130.455187
21-0.009969-0.08460.466412
22-0.020464-0.17360.431317
230.0006730.00570.497728
24-0.031027-0.26330.396546
25-0.025138-0.21330.415848
26-0.021828-0.18520.426792
27-0.015374-0.13050.448285
28-0.001895-0.01610.493606
29-0.029896-0.25370.400236
30-0.023096-0.1960.422592
31-0.027039-0.22940.409591
32-0.02629-0.22310.412055
33-0.009399-0.07980.468328
34-0.017145-0.14550.442368
35-0.017661-0.14990.440648
36-0.015084-0.1280.449256
37-0.036948-0.31350.377398
38-0.018614-0.15790.437473
39-0.015817-0.13420.446805
40-0.018218-0.15460.438789
41-0.009418-0.07990.468263
42-0.030545-0.25920.398116
43-0.027771-0.23560.407189
44-0.026534-0.22520.41125
45-0.025349-0.21510.41515
460.0106670.09050.464066
47-0.010152-0.08610.465795
48-0.012683-0.10760.457298


Parameters (Session):
par1 = 48 ; par2 = 1 ; par3 = 0 ; par4 = 0 ; par5 = 12 ; par6 = White Noise ; par7 = 0.95 ;
Parameters (R input):
par1 = 48 ; par2 = 1 ; par3 = 0 ; par4 = 0 ; par5 = 12 ; par6 = White Noise ; par7 = 0.95 ; par8 = ;
R code (references can be found in the software module):
if (par1 == 'Default') {
par1 = 10*log10(length(x))
} else {
par1 <- as.numeric(par1)
}
par2 <- as.numeric(par2)
par3 <- as.numeric(par3)
par4 <- as.numeric(par4)
par5 <- as.numeric(par5)
if (par6 == 'White Noise') par6 <- 'white' else par6 <- 'ma'
par7 <- as.numeric(par7)
if (par8 != '') par8 <- as.numeric(par8)
ox <- x
if (par8 == '') {
if (par2 == 0) {
x <- log(x)
} else {
x <- (x ^ par2 - 1) / par2
}
} else {
x <- log(x,base=par8)
}
if (par3 > 0) x <- diff(x,lag=1,difference=par3)
if (par4 > 0) x <- diff(x,lag=par5,difference=par4)
bitmap(file='picts.png')
op <- par(mfrow=c(2,1))
plot(ox,type='l',main='Original Time Series',xlab='time',ylab='value')
if (par8=='') {
mytitle <- paste('Working Time Series (lambda=',par2,', d=',par3,', D=',par4,')',sep='')
mysub <- paste('(lambda=',par2,', d=',par3,', D=',par4,', CI=', par7, ', CI type=',par6,')',sep='')
} else {
mytitle <- paste('Working Time Series (base=',par8,', d=',par3,', D=',par4,')',sep='')
mysub <- paste('(base=',par8,', d=',par3,', D=',par4,', CI=', par7, ', CI type=',par6,')',sep='')
}
plot(x,type='l', main=mytitle,xlab='time',ylab='value')
par(op)
dev.off()
bitmap(file='pic1.png')
racf <- acf(x, par1, main='Autocorrelation', xlab='time lag', ylab='ACF', ci.type=par6, ci=par7, sub=mysub)
dev.off()
bitmap(file='pic2.png')
rpacf <- pacf(x,par1,main='Partial Autocorrelation',xlab='lags',ylab='PACF',sub=mysub)
dev.off()
(myacf <- c(racf$acf))
(mypacf <- c(rpacf$acf))
lengthx <- length(x)
sqrtn <- sqrt(lengthx)
load(file='createtable')
a<-table.start()
a<-table.row.start(a)
a<-table.element(a,'Autocorrelation Function',4,TRUE)
a<-table.row.end(a)
a<-table.row.start(a)
a<-table.element(a,'Time lag k',header=TRUE)
a<-table.element(a,hyperlink('basics.htm','ACF(k)','click here for more information about the Autocorrelation Function'),header=TRUE)
a<-table.element(a,'T-STAT',header=TRUE)
a<-table.element(a,'P-value',header=TRUE)
a<-table.row.end(a)
for (i in 2:(par1+1)) {
a<-table.row.start(a)
a<-table.element(a,i-1,header=TRUE)
a<-table.element(a,round(myacf[i],6))
mytstat <- myacf[i]*sqrtn
a<-table.element(a,round(mytstat,4))
a<-table.element(a,round(1-pt(abs(mytstat),lengthx),6))
a<-table.row.end(a)
}
a<-table.end(a)
table.save(a,file='mytable.tab')
a<-table.start()
a<-table.row.start(a)
a<-table.element(a,'Partial Autocorrelation Function',4,TRUE)
a<-table.row.end(a)
a<-table.row.start(a)
a<-table.element(a,'Time lag k',header=TRUE)
a<-table.element(a,hyperlink('basics.htm','PACF(k)','click here for more information about the Partial Autocorrelation Function'),header=TRUE)
a<-table.element(a,'T-STAT',header=TRUE)
a<-table.element(a,'P-value',header=TRUE)
a<-table.row.end(a)
for (i in 1:par1) {
a<-table.row.start(a)
a<-table.element(a,i,header=TRUE)
a<-table.element(a,round(mypacf[i],6))
mytstat <- mypacf[i]*sqrtn
a<-table.element(a,round(mytstat,4))
a<-table.element(a,round(1-pt(abs(mytstat),lengthx),6))
a<-table.row.end(a)
}
a<-table.end(a)
table.save(a,file='mytable1.tab')