Free Statistics

of Irreproducible Research!

Author's title

Author*Unverified author*
R Software Modulerwasp_autocorrelation.wasp
Title produced by software(Partial) Autocorrelation Function
Date of computationWed, 04 Apr 2012 11:11:22 -0400
Cite this page as followsStatistical Computations at FreeStatistics.org, Office for Research Development and Education, URL https://freestatistics.org/blog/index.php?v=date/2012/Apr/04/t13335523106bz329kl6i933h4.htm/, Retrieved Mon, 29 Apr 2024 00:00:00 +0000
Statistical Computations at FreeStatistics.org, Office for Research Development and Education, URL https://freestatistics.org/blog/index.php?pk=164304, Retrieved Mon, 29 Apr 2024 00:00:00 +0000
QR Codes:

Original text written by user:
IsPrivate?No (this computation is public)
User-defined keywords
Estimated Impact150
Family? (F = Feedback message, R = changed R code, M = changed R Module, P = changed Parameters, D = changed Data)
-       [(Partial) Autocorrelation Function] [oefening6 bis eig...] [2012-04-04 15:11:22] [649f27debd29df6d3b5186bbc318d779] [Current]
Feedback Forum

Post a new message
Dataseries X:
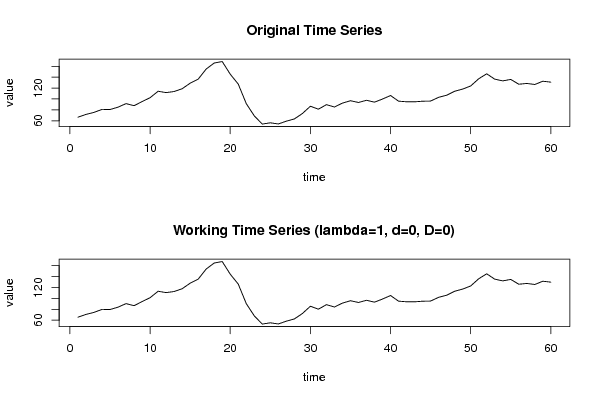
66,6
71,7
75,4
80,9
80,7
85
91,5
87,7
95,3
102,4
114,2
111,7
113,7
118,8
129
136,4
155
166
168,7
145,5
127,3
91,5
69
54
56,3
54,2
59,3
63,4
73,3
86,7
81,3
89,6
85,3
92,4
96,8
93,6
97,6
94,2
99,9
106,4
96
94,9
94,8
95,9
96,2
103,1
106,9
114,2
118,2
123,9
137,1
146,2
136,4
133,2
135,9
127,1
128,5
126,6
132,6
130,9


Summary of computational transaction
Raw Inputview raw input (R code)
Raw Outputview raw output of R engine
Computing time1 seconds
R Server'Gwilym Jenkins' @ jenkins.wessa.net

\begin{tabular}{lllllllll}
\hline
Summary of computational transaction \tabularnewline
Raw Input & view raw input (R code)  \tabularnewline
Raw Output & view raw output of R engine  \tabularnewline
Computing time & 1 seconds \tabularnewline
R Server & 'Gwilym Jenkins' @ jenkins.wessa.net \tabularnewline
\hline
\end{tabular}
%Source: https://freestatistics.org/blog/index.php?pk=164304&T=0

[TABLE]
[ROW][C]Summary of computational transaction[/C][/ROW]
[ROW][C]Raw Input[/C][C]view raw input (R code) [/C][/ROW]
[ROW][C]Raw Output[/C][C]view raw output of R engine [/C][/ROW]
[ROW][C]Computing time[/C][C]1 seconds[/C][/ROW]
[ROW][C]R Server[/C][C]'Gwilym Jenkins' @ jenkins.wessa.net[/C][/ROW]
[/TABLE]
Source: https://freestatistics.org/blog/index.php?pk=164304&T=0

Globally Unique Identifier (entire table): ba.freestatistics.org/blog/index.php?pk=164304&T=0

As an alternative you can also use a QR Code:  

The GUIDs for individual cells are displayed in the table below:

Summary of computational transaction
Raw Inputview raw input (R code)
Raw Outputview raw output of R engine
Computing time1 seconds
R Server'Gwilym Jenkins' @ jenkins.wessa.net


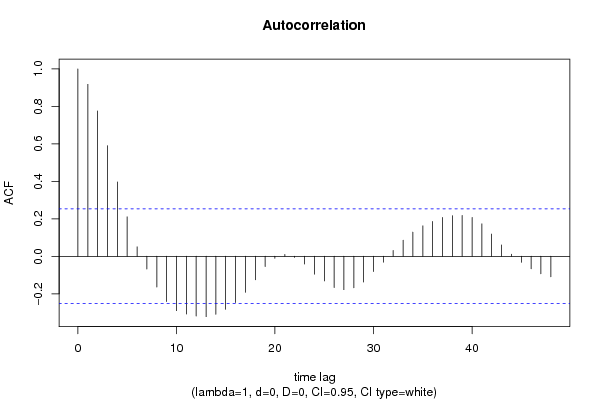
Autocorrelation Function
Time lag kACF(k)T-STATP-value
10.917697.10840
20.7753376.00570
30.5902854.57231.2e-05
40.3963793.07030.001605
50.2105121.63060.054105
60.0504420.39070.348692
7-0.067766-0.52490.30079
8-0.163949-1.26990.104504
9-0.241395-1.86980.033194
10-0.289769-2.24450.014249
11-0.308309-2.38820.010049
12-0.318958-2.47060.008173
13-0.321979-2.4940.007701
14-0.309278-2.39570.009863
15-0.282398-2.18740.016309
16-0.246756-1.91140.030369
17-0.191985-1.48710.071111
18-0.124885-0.96740.168625
19-0.054758-0.42420.336486
20-0.010177-0.07880.468714
210.0096560.07480.470314
22-0.00574-0.04450.482341
23-0.041219-0.31930.375313
24-0.094963-0.73560.232427
25-0.131257-1.01670.156687
26-0.166243-1.28770.101395
27-0.177885-1.37790.086678
28-0.167927-1.30080.099157
29-0.137323-1.06370.145864
30-0.081263-0.62950.265719
31-0.030907-0.23940.405804
320.0309610.23980.405641
330.0857210.6640.254621
340.1290150.99930.16082
350.1626881.26020.106242
360.1856671.43820.077791
370.2072281.60520.056853
380.2164931.67690.049378
390.2175171.68490.048604
400.2074951.60720.056625
410.1733161.34250.092246
420.1184510.91750.181273
430.0608950.47170.319428
440.0109990.08520.466195
45-0.031252-0.24210.404774
46-0.066011-0.51130.305502
47-0.092726-0.71830.237694
48-0.109095-0.8450.20072

\begin{tabular}{lllllllll}
\hline
Autocorrelation Function \tabularnewline
Time lag k & ACF(k) & T-STAT & P-value \tabularnewline
1 & 0.91769 & 7.1084 & 0 \tabularnewline
2 & 0.775337 & 6.0057 & 0 \tabularnewline
3 & 0.590285 & 4.5723 & 1.2e-05 \tabularnewline
4 & 0.396379 & 3.0703 & 0.001605 \tabularnewline
5 & 0.210512 & 1.6306 & 0.054105 \tabularnewline
6 & 0.050442 & 0.3907 & 0.348692 \tabularnewline
7 & -0.067766 & -0.5249 & 0.30079 \tabularnewline
8 & -0.163949 & -1.2699 & 0.104504 \tabularnewline
9 & -0.241395 & -1.8698 & 0.033194 \tabularnewline
10 & -0.289769 & -2.2445 & 0.014249 \tabularnewline
11 & -0.308309 & -2.3882 & 0.010049 \tabularnewline
12 & -0.318958 & -2.4706 & 0.008173 \tabularnewline
13 & -0.321979 & -2.494 & 0.007701 \tabularnewline
14 & -0.309278 & -2.3957 & 0.009863 \tabularnewline
15 & -0.282398 & -2.1874 & 0.016309 \tabularnewline
16 & -0.246756 & -1.9114 & 0.030369 \tabularnewline
17 & -0.191985 & -1.4871 & 0.071111 \tabularnewline
18 & -0.124885 & -0.9674 & 0.168625 \tabularnewline
19 & -0.054758 & -0.4242 & 0.336486 \tabularnewline
20 & -0.010177 & -0.0788 & 0.468714 \tabularnewline
21 & 0.009656 & 0.0748 & 0.470314 \tabularnewline
22 & -0.00574 & -0.0445 & 0.482341 \tabularnewline
23 & -0.041219 & -0.3193 & 0.375313 \tabularnewline
24 & -0.094963 & -0.7356 & 0.232427 \tabularnewline
25 & -0.131257 & -1.0167 & 0.156687 \tabularnewline
26 & -0.166243 & -1.2877 & 0.101395 \tabularnewline
27 & -0.177885 & -1.3779 & 0.086678 \tabularnewline
28 & -0.167927 & -1.3008 & 0.099157 \tabularnewline
29 & -0.137323 & -1.0637 & 0.145864 \tabularnewline
30 & -0.081263 & -0.6295 & 0.265719 \tabularnewline
31 & -0.030907 & -0.2394 & 0.405804 \tabularnewline
32 & 0.030961 & 0.2398 & 0.405641 \tabularnewline
33 & 0.085721 & 0.664 & 0.254621 \tabularnewline
34 & 0.129015 & 0.9993 & 0.16082 \tabularnewline
35 & 0.162688 & 1.2602 & 0.106242 \tabularnewline
36 & 0.185667 & 1.4382 & 0.077791 \tabularnewline
37 & 0.207228 & 1.6052 & 0.056853 \tabularnewline
38 & 0.216493 & 1.6769 & 0.049378 \tabularnewline
39 & 0.217517 & 1.6849 & 0.048604 \tabularnewline
40 & 0.207495 & 1.6072 & 0.056625 \tabularnewline
41 & 0.173316 & 1.3425 & 0.092246 \tabularnewline
42 & 0.118451 & 0.9175 & 0.181273 \tabularnewline
43 & 0.060895 & 0.4717 & 0.319428 \tabularnewline
44 & 0.010999 & 0.0852 & 0.466195 \tabularnewline
45 & -0.031252 & -0.2421 & 0.404774 \tabularnewline
46 & -0.066011 & -0.5113 & 0.305502 \tabularnewline
47 & -0.092726 & -0.7183 & 0.237694 \tabularnewline
48 & -0.109095 & -0.845 & 0.20072 \tabularnewline
\hline
\end{tabular}
%Source: https://freestatistics.org/blog/index.php?pk=164304&T=1

[TABLE]
[ROW][C]Autocorrelation Function[/C][/ROW]
[ROW][C]Time lag k[/C][C]ACF(k)[/C][C]T-STAT[/C][C]P-value[/C][/ROW]
[ROW][C]1[/C][C]0.91769[/C][C]7.1084[/C][C]0[/C][/ROW]
[ROW][C]2[/C][C]0.775337[/C][C]6.0057[/C][C]0[/C][/ROW]
[ROW][C]3[/C][C]0.590285[/C][C]4.5723[/C][C]1.2e-05[/C][/ROW]
[ROW][C]4[/C][C]0.396379[/C][C]3.0703[/C][C]0.001605[/C][/ROW]
[ROW][C]5[/C][C]0.210512[/C][C]1.6306[/C][C]0.054105[/C][/ROW]
[ROW][C]6[/C][C]0.050442[/C][C]0.3907[/C][C]0.348692[/C][/ROW]
[ROW][C]7[/C][C]-0.067766[/C][C]-0.5249[/C][C]0.30079[/C][/ROW]
[ROW][C]8[/C][C]-0.163949[/C][C]-1.2699[/C][C]0.104504[/C][/ROW]
[ROW][C]9[/C][C]-0.241395[/C][C]-1.8698[/C][C]0.033194[/C][/ROW]
[ROW][C]10[/C][C]-0.289769[/C][C]-2.2445[/C][C]0.014249[/C][/ROW]
[ROW][C]11[/C][C]-0.308309[/C][C]-2.3882[/C][C]0.010049[/C][/ROW]
[ROW][C]12[/C][C]-0.318958[/C][C]-2.4706[/C][C]0.008173[/C][/ROW]
[ROW][C]13[/C][C]-0.321979[/C][C]-2.494[/C][C]0.007701[/C][/ROW]
[ROW][C]14[/C][C]-0.309278[/C][C]-2.3957[/C][C]0.009863[/C][/ROW]
[ROW][C]15[/C][C]-0.282398[/C][C]-2.1874[/C][C]0.016309[/C][/ROW]
[ROW][C]16[/C][C]-0.246756[/C][C]-1.9114[/C][C]0.030369[/C][/ROW]
[ROW][C]17[/C][C]-0.191985[/C][C]-1.4871[/C][C]0.071111[/C][/ROW]
[ROW][C]18[/C][C]-0.124885[/C][C]-0.9674[/C][C]0.168625[/C][/ROW]
[ROW][C]19[/C][C]-0.054758[/C][C]-0.4242[/C][C]0.336486[/C][/ROW]
[ROW][C]20[/C][C]-0.010177[/C][C]-0.0788[/C][C]0.468714[/C][/ROW]
[ROW][C]21[/C][C]0.009656[/C][C]0.0748[/C][C]0.470314[/C][/ROW]
[ROW][C]22[/C][C]-0.00574[/C][C]-0.0445[/C][C]0.482341[/C][/ROW]
[ROW][C]23[/C][C]-0.041219[/C][C]-0.3193[/C][C]0.375313[/C][/ROW]
[ROW][C]24[/C][C]-0.094963[/C][C]-0.7356[/C][C]0.232427[/C][/ROW]
[ROW][C]25[/C][C]-0.131257[/C][C]-1.0167[/C][C]0.156687[/C][/ROW]
[ROW][C]26[/C][C]-0.166243[/C][C]-1.2877[/C][C]0.101395[/C][/ROW]
[ROW][C]27[/C][C]-0.177885[/C][C]-1.3779[/C][C]0.086678[/C][/ROW]
[ROW][C]28[/C][C]-0.167927[/C][C]-1.3008[/C][C]0.099157[/C][/ROW]
[ROW][C]29[/C][C]-0.137323[/C][C]-1.0637[/C][C]0.145864[/C][/ROW]
[ROW][C]30[/C][C]-0.081263[/C][C]-0.6295[/C][C]0.265719[/C][/ROW]
[ROW][C]31[/C][C]-0.030907[/C][C]-0.2394[/C][C]0.405804[/C][/ROW]
[ROW][C]32[/C][C]0.030961[/C][C]0.2398[/C][C]0.405641[/C][/ROW]
[ROW][C]33[/C][C]0.085721[/C][C]0.664[/C][C]0.254621[/C][/ROW]
[ROW][C]34[/C][C]0.129015[/C][C]0.9993[/C][C]0.16082[/C][/ROW]
[ROW][C]35[/C][C]0.162688[/C][C]1.2602[/C][C]0.106242[/C][/ROW]
[ROW][C]36[/C][C]0.185667[/C][C]1.4382[/C][C]0.077791[/C][/ROW]
[ROW][C]37[/C][C]0.207228[/C][C]1.6052[/C][C]0.056853[/C][/ROW]
[ROW][C]38[/C][C]0.216493[/C][C]1.6769[/C][C]0.049378[/C][/ROW]
[ROW][C]39[/C][C]0.217517[/C][C]1.6849[/C][C]0.048604[/C][/ROW]
[ROW][C]40[/C][C]0.207495[/C][C]1.6072[/C][C]0.056625[/C][/ROW]
[ROW][C]41[/C][C]0.173316[/C][C]1.3425[/C][C]0.092246[/C][/ROW]
[ROW][C]42[/C][C]0.118451[/C][C]0.9175[/C][C]0.181273[/C][/ROW]
[ROW][C]43[/C][C]0.060895[/C][C]0.4717[/C][C]0.319428[/C][/ROW]
[ROW][C]44[/C][C]0.010999[/C][C]0.0852[/C][C]0.466195[/C][/ROW]
[ROW][C]45[/C][C]-0.031252[/C][C]-0.2421[/C][C]0.404774[/C][/ROW]
[ROW][C]46[/C][C]-0.066011[/C][C]-0.5113[/C][C]0.305502[/C][/ROW]
[ROW][C]47[/C][C]-0.092726[/C][C]-0.7183[/C][C]0.237694[/C][/ROW]
[ROW][C]48[/C][C]-0.109095[/C][C]-0.845[/C][C]0.20072[/C][/ROW]
[/TABLE]
Source: https://freestatistics.org/blog/index.php?pk=164304&T=1

Globally Unique Identifier (entire table): ba.freestatistics.org/blog/index.php?pk=164304&T=1

As an alternative you can also use a QR Code:  

The GUIDs for individual cells are displayed in the table below:

Autocorrelation Function
Time lag kACF(k)T-STATP-value
10.917697.10840
20.7753376.00570
30.5902854.57231.2e-05
40.3963793.07030.001605
50.2105121.63060.054105
60.0504420.39070.348692
7-0.067766-0.52490.30079
8-0.163949-1.26990.104504
9-0.241395-1.86980.033194
10-0.289769-2.24450.014249
11-0.308309-2.38820.010049
12-0.318958-2.47060.008173
13-0.321979-2.4940.007701
14-0.309278-2.39570.009863
15-0.282398-2.18740.016309
16-0.246756-1.91140.030369
17-0.191985-1.48710.071111
18-0.124885-0.96740.168625
19-0.054758-0.42420.336486
20-0.010177-0.07880.468714
210.0096560.07480.470314
22-0.00574-0.04450.482341
23-0.041219-0.31930.375313
24-0.094963-0.73560.232427
25-0.131257-1.01670.156687
26-0.166243-1.28770.101395
27-0.177885-1.37790.086678
28-0.167927-1.30080.099157
29-0.137323-1.06370.145864
30-0.081263-0.62950.265719
31-0.030907-0.23940.405804
320.0309610.23980.405641
330.0857210.6640.254621
340.1290150.99930.16082
350.1626881.26020.106242
360.1856671.43820.077791
370.2072281.60520.056853
380.2164931.67690.049378
390.2175171.68490.048604
400.2074951.60720.056625
410.1733161.34250.092246
420.1184510.91750.181273
430.0608950.47170.319428
440.0109990.08520.466195
45-0.031252-0.24210.404774
46-0.066011-0.51130.305502
47-0.092726-0.71830.237694
48-0.109095-0.8450.20072


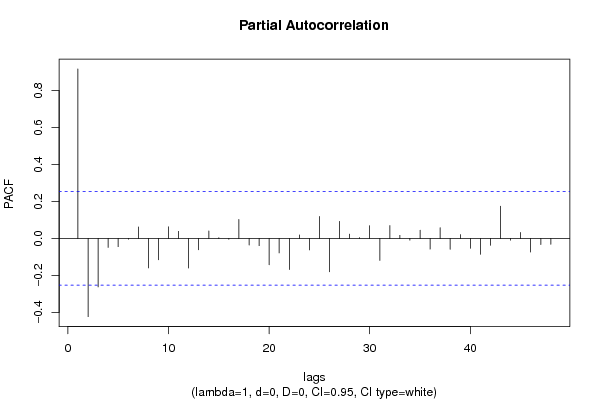
Partial Autocorrelation Function
Time lag kPACF(k)T-STATP-value
10.917697.10840
2-0.423315-3.2790.000868
3-0.262106-2.03030.023385
4-0.048317-0.37430.354766
5-0.044348-0.34350.366205
6-0.003847-0.02980.488162
70.062060.48070.316233
8-0.159308-1.2340.111008
9-0.115532-0.89490.187207
100.0627370.4860.314384
110.0385630.29870.383098
12-0.160256-1.24130.109656
13-0.061454-0.4760.317895
140.040740.31560.37671
150.0035610.02760.489044
16-0.004119-0.03190.487327
170.102390.79310.215419
18-0.035326-0.27360.392652
19-0.038937-0.30160.381997
20-0.141985-1.09980.137904
21-0.078032-0.60440.273917
22-0.168177-1.30270.098829
230.0188260.14580.442273
24-0.061747-0.47830.317092
250.1189260.92120.180318
26-0.180195-1.39580.083962
270.0923330.71520.238628
280.0233170.18060.42864
290.0047790.0370.485296
300.0689570.53410.297609
31-0.118752-0.91980.180668
320.0696950.53990.295647
330.0166410.12890.448932
34-0.008911-0.0690.472599
350.0442140.34250.366592
36-0.057589-0.44610.328571
370.0584830.4530.326088
38-0.058352-0.4520.326451
390.0210110.16280.43563
40-0.052746-0.40860.342156
41-0.085446-0.66190.255296
42-0.03694-0.28610.387881
430.1742771.34990.091052
44-0.009241-0.07160.471586
450.0322460.24980.401807
46-0.073242-0.56730.286303
47-0.032634-0.25280.40065
48-0.031862-0.24680.402953

\begin{tabular}{lllllllll}
\hline
Partial Autocorrelation Function \tabularnewline
Time lag k & PACF(k) & T-STAT & P-value \tabularnewline
1 & 0.91769 & 7.1084 & 0 \tabularnewline
2 & -0.423315 & -3.279 & 0.000868 \tabularnewline
3 & -0.262106 & -2.0303 & 0.023385 \tabularnewline
4 & -0.048317 & -0.3743 & 0.354766 \tabularnewline
5 & -0.044348 & -0.3435 & 0.366205 \tabularnewline
6 & -0.003847 & -0.0298 & 0.488162 \tabularnewline
7 & 0.06206 & 0.4807 & 0.316233 \tabularnewline
8 & -0.159308 & -1.234 & 0.111008 \tabularnewline
9 & -0.115532 & -0.8949 & 0.187207 \tabularnewline
10 & 0.062737 & 0.486 & 0.314384 \tabularnewline
11 & 0.038563 & 0.2987 & 0.383098 \tabularnewline
12 & -0.160256 & -1.2413 & 0.109656 \tabularnewline
13 & -0.061454 & -0.476 & 0.317895 \tabularnewline
14 & 0.04074 & 0.3156 & 0.37671 \tabularnewline
15 & 0.003561 & 0.0276 & 0.489044 \tabularnewline
16 & -0.004119 & -0.0319 & 0.487327 \tabularnewline
17 & 0.10239 & 0.7931 & 0.215419 \tabularnewline
18 & -0.035326 & -0.2736 & 0.392652 \tabularnewline
19 & -0.038937 & -0.3016 & 0.381997 \tabularnewline
20 & -0.141985 & -1.0998 & 0.137904 \tabularnewline
21 & -0.078032 & -0.6044 & 0.273917 \tabularnewline
22 & -0.168177 & -1.3027 & 0.098829 \tabularnewline
23 & 0.018826 & 0.1458 & 0.442273 \tabularnewline
24 & -0.061747 & -0.4783 & 0.317092 \tabularnewline
25 & 0.118926 & 0.9212 & 0.180318 \tabularnewline
26 & -0.180195 & -1.3958 & 0.083962 \tabularnewline
27 & 0.092333 & 0.7152 & 0.238628 \tabularnewline
28 & 0.023317 & 0.1806 & 0.42864 \tabularnewline
29 & 0.004779 & 0.037 & 0.485296 \tabularnewline
30 & 0.068957 & 0.5341 & 0.297609 \tabularnewline
31 & -0.118752 & -0.9198 & 0.180668 \tabularnewline
32 & 0.069695 & 0.5399 & 0.295647 \tabularnewline
33 & 0.016641 & 0.1289 & 0.448932 \tabularnewline
34 & -0.008911 & -0.069 & 0.472599 \tabularnewline
35 & 0.044214 & 0.3425 & 0.366592 \tabularnewline
36 & -0.057589 & -0.4461 & 0.328571 \tabularnewline
37 & 0.058483 & 0.453 & 0.326088 \tabularnewline
38 & -0.058352 & -0.452 & 0.326451 \tabularnewline
39 & 0.021011 & 0.1628 & 0.43563 \tabularnewline
40 & -0.052746 & -0.4086 & 0.342156 \tabularnewline
41 & -0.085446 & -0.6619 & 0.255296 \tabularnewline
42 & -0.03694 & -0.2861 & 0.387881 \tabularnewline
43 & 0.174277 & 1.3499 & 0.091052 \tabularnewline
44 & -0.009241 & -0.0716 & 0.471586 \tabularnewline
45 & 0.032246 & 0.2498 & 0.401807 \tabularnewline
46 & -0.073242 & -0.5673 & 0.286303 \tabularnewline
47 & -0.032634 & -0.2528 & 0.40065 \tabularnewline
48 & -0.031862 & -0.2468 & 0.402953 \tabularnewline
\hline
\end{tabular}
%Source: https://freestatistics.org/blog/index.php?pk=164304&T=2

[TABLE]
[ROW][C]Partial Autocorrelation Function[/C][/ROW]
[ROW][C]Time lag k[/C][C]PACF(k)[/C][C]T-STAT[/C][C]P-value[/C][/ROW]
[ROW][C]1[/C][C]0.91769[/C][C]7.1084[/C][C]0[/C][/ROW]
[ROW][C]2[/C][C]-0.423315[/C][C]-3.279[/C][C]0.000868[/C][/ROW]
[ROW][C]3[/C][C]-0.262106[/C][C]-2.0303[/C][C]0.023385[/C][/ROW]
[ROW][C]4[/C][C]-0.048317[/C][C]-0.3743[/C][C]0.354766[/C][/ROW]
[ROW][C]5[/C][C]-0.044348[/C][C]-0.3435[/C][C]0.366205[/C][/ROW]
[ROW][C]6[/C][C]-0.003847[/C][C]-0.0298[/C][C]0.488162[/C][/ROW]
[ROW][C]7[/C][C]0.06206[/C][C]0.4807[/C][C]0.316233[/C][/ROW]
[ROW][C]8[/C][C]-0.159308[/C][C]-1.234[/C][C]0.111008[/C][/ROW]
[ROW][C]9[/C][C]-0.115532[/C][C]-0.8949[/C][C]0.187207[/C][/ROW]
[ROW][C]10[/C][C]0.062737[/C][C]0.486[/C][C]0.314384[/C][/ROW]
[ROW][C]11[/C][C]0.038563[/C][C]0.2987[/C][C]0.383098[/C][/ROW]
[ROW][C]12[/C][C]-0.160256[/C][C]-1.2413[/C][C]0.109656[/C][/ROW]
[ROW][C]13[/C][C]-0.061454[/C][C]-0.476[/C][C]0.317895[/C][/ROW]
[ROW][C]14[/C][C]0.04074[/C][C]0.3156[/C][C]0.37671[/C][/ROW]
[ROW][C]15[/C][C]0.003561[/C][C]0.0276[/C][C]0.489044[/C][/ROW]
[ROW][C]16[/C][C]-0.004119[/C][C]-0.0319[/C][C]0.487327[/C][/ROW]
[ROW][C]17[/C][C]0.10239[/C][C]0.7931[/C][C]0.215419[/C][/ROW]
[ROW][C]18[/C][C]-0.035326[/C][C]-0.2736[/C][C]0.392652[/C][/ROW]
[ROW][C]19[/C][C]-0.038937[/C][C]-0.3016[/C][C]0.381997[/C][/ROW]
[ROW][C]20[/C][C]-0.141985[/C][C]-1.0998[/C][C]0.137904[/C][/ROW]
[ROW][C]21[/C][C]-0.078032[/C][C]-0.6044[/C][C]0.273917[/C][/ROW]
[ROW][C]22[/C][C]-0.168177[/C][C]-1.3027[/C][C]0.098829[/C][/ROW]
[ROW][C]23[/C][C]0.018826[/C][C]0.1458[/C][C]0.442273[/C][/ROW]
[ROW][C]24[/C][C]-0.061747[/C][C]-0.4783[/C][C]0.317092[/C][/ROW]
[ROW][C]25[/C][C]0.118926[/C][C]0.9212[/C][C]0.180318[/C][/ROW]
[ROW][C]26[/C][C]-0.180195[/C][C]-1.3958[/C][C]0.083962[/C][/ROW]
[ROW][C]27[/C][C]0.092333[/C][C]0.7152[/C][C]0.238628[/C][/ROW]
[ROW][C]28[/C][C]0.023317[/C][C]0.1806[/C][C]0.42864[/C][/ROW]
[ROW][C]29[/C][C]0.004779[/C][C]0.037[/C][C]0.485296[/C][/ROW]
[ROW][C]30[/C][C]0.068957[/C][C]0.5341[/C][C]0.297609[/C][/ROW]
[ROW][C]31[/C][C]-0.118752[/C][C]-0.9198[/C][C]0.180668[/C][/ROW]
[ROW][C]32[/C][C]0.069695[/C][C]0.5399[/C][C]0.295647[/C][/ROW]
[ROW][C]33[/C][C]0.016641[/C][C]0.1289[/C][C]0.448932[/C][/ROW]
[ROW][C]34[/C][C]-0.008911[/C][C]-0.069[/C][C]0.472599[/C][/ROW]
[ROW][C]35[/C][C]0.044214[/C][C]0.3425[/C][C]0.366592[/C][/ROW]
[ROW][C]36[/C][C]-0.057589[/C][C]-0.4461[/C][C]0.328571[/C][/ROW]
[ROW][C]37[/C][C]0.058483[/C][C]0.453[/C][C]0.326088[/C][/ROW]
[ROW][C]38[/C][C]-0.058352[/C][C]-0.452[/C][C]0.326451[/C][/ROW]
[ROW][C]39[/C][C]0.021011[/C][C]0.1628[/C][C]0.43563[/C][/ROW]
[ROW][C]40[/C][C]-0.052746[/C][C]-0.4086[/C][C]0.342156[/C][/ROW]
[ROW][C]41[/C][C]-0.085446[/C][C]-0.6619[/C][C]0.255296[/C][/ROW]
[ROW][C]42[/C][C]-0.03694[/C][C]-0.2861[/C][C]0.387881[/C][/ROW]
[ROW][C]43[/C][C]0.174277[/C][C]1.3499[/C][C]0.091052[/C][/ROW]
[ROW][C]44[/C][C]-0.009241[/C][C]-0.0716[/C][C]0.471586[/C][/ROW]
[ROW][C]45[/C][C]0.032246[/C][C]0.2498[/C][C]0.401807[/C][/ROW]
[ROW][C]46[/C][C]-0.073242[/C][C]-0.5673[/C][C]0.286303[/C][/ROW]
[ROW][C]47[/C][C]-0.032634[/C][C]-0.2528[/C][C]0.40065[/C][/ROW]
[ROW][C]48[/C][C]-0.031862[/C][C]-0.2468[/C][C]0.402953[/C][/ROW]
[/TABLE]
Source: https://freestatistics.org/blog/index.php?pk=164304&T=2

Globally Unique Identifier (entire table): ba.freestatistics.org/blog/index.php?pk=164304&T=2

As an alternative you can also use a QR Code:  

The GUIDs for individual cells are displayed in the table below:

Partial Autocorrelation Function
Time lag kPACF(k)T-STATP-value
10.917697.10840
2-0.423315-3.2790.000868
3-0.262106-2.03030.023385
4-0.048317-0.37430.354766
5-0.044348-0.34350.366205
6-0.003847-0.02980.488162
70.062060.48070.316233
8-0.159308-1.2340.111008
9-0.115532-0.89490.187207
100.0627370.4860.314384
110.0385630.29870.383098
12-0.160256-1.24130.109656
13-0.061454-0.4760.317895
140.040740.31560.37671
150.0035610.02760.489044
16-0.004119-0.03190.487327
170.102390.79310.215419
18-0.035326-0.27360.392652
19-0.038937-0.30160.381997
20-0.141985-1.09980.137904
21-0.078032-0.60440.273917
22-0.168177-1.30270.098829
230.0188260.14580.442273
24-0.061747-0.47830.317092
250.1189260.92120.180318
26-0.180195-1.39580.083962
270.0923330.71520.238628
280.0233170.18060.42864
290.0047790.0370.485296
300.0689570.53410.297609
31-0.118752-0.91980.180668
320.0696950.53990.295647
330.0166410.12890.448932
34-0.008911-0.0690.472599
350.0442140.34250.366592
36-0.057589-0.44610.328571
370.0584830.4530.326088
38-0.058352-0.4520.326451
390.0210110.16280.43563
40-0.052746-0.40860.342156
41-0.085446-0.66190.255296
42-0.03694-0.28610.387881
430.1742771.34990.091052
44-0.009241-0.07160.471586
450.0322460.24980.401807
46-0.073242-0.56730.286303
47-0.032634-0.25280.40065
48-0.031862-0.24680.402953


Parameters (Session):
par1 = 48 ; par2 = 1 ; par3 = 0 ; par4 = 0 ; par5 = 12 ; par6 = White Noise ; par7 = 0.95 ;
Parameters (R input):
par1 = 48 ; par2 = 1 ; par3 = 0 ; par4 = 0 ; par5 = 12 ; par6 = White Noise ; par7 = 0.95 ; par8 = ;
R code (references can be found in the software module):
if (par1 == 'Default') {
par1 = 10*log10(length(x))
} else {
par1 <- as.numeric(par1)
}
par2 <- as.numeric(par2)
par3 <- as.numeric(par3)
par4 <- as.numeric(par4)
par5 <- as.numeric(par5)
if (par6 == 'White Noise') par6 <- 'white' else par6 <- 'ma'
par7 <- as.numeric(par7)
if (par8 != '') par8 <- as.numeric(par8)
ox <- x
if (par8 == '') {
if (par2 == 0) {
x <- log(x)
} else {
x <- (x ^ par2 - 1) / par2
}
} else {
x <- log(x,base=par8)
}
if (par3 > 0) x <- diff(x,lag=1,difference=par3)
if (par4 > 0) x <- diff(x,lag=par5,difference=par4)
bitmap(file='picts.png')
op <- par(mfrow=c(2,1))
plot(ox,type='l',main='Original Time Series',xlab='time',ylab='value')
if (par8=='') {
mytitle <- paste('Working Time Series (lambda=',par2,', d=',par3,', D=',par4,')',sep='')
mysub <- paste('(lambda=',par2,', d=',par3,', D=',par4,', CI=', par7, ', CI type=',par6,')',sep='')
} else {
mytitle <- paste('Working Time Series (base=',par8,', d=',par3,', D=',par4,')',sep='')
mysub <- paste('(base=',par8,', d=',par3,', D=',par4,', CI=', par7, ', CI type=',par6,')',sep='')
}
plot(x,type='l', main=mytitle,xlab='time',ylab='value')
par(op)
dev.off()
bitmap(file='pic1.png')
racf <- acf(x, par1, main='Autocorrelation', xlab='time lag', ylab='ACF', ci.type=par6, ci=par7, sub=mysub)
dev.off()
bitmap(file='pic2.png')
rpacf <- pacf(x,par1,main='Partial Autocorrelation',xlab='lags',ylab='PACF',sub=mysub)
dev.off()
(myacf <- c(racf$acf))
(mypacf <- c(rpacf$acf))
lengthx <- length(x)
sqrtn <- sqrt(lengthx)
load(file='createtable')
a<-table.start()
a<-table.row.start(a)
a<-table.element(a,'Autocorrelation Function',4,TRUE)
a<-table.row.end(a)
a<-table.row.start(a)
a<-table.element(a,'Time lag k',header=TRUE)
a<-table.element(a,hyperlink('basics.htm','ACF(k)','click here for more information about the Autocorrelation Function'),header=TRUE)
a<-table.element(a,'T-STAT',header=TRUE)
a<-table.element(a,'P-value',header=TRUE)
a<-table.row.end(a)
for (i in 2:(par1+1)) {
a<-table.row.start(a)
a<-table.element(a,i-1,header=TRUE)
a<-table.element(a,round(myacf[i],6))
mytstat <- myacf[i]*sqrtn
a<-table.element(a,round(mytstat,4))
a<-table.element(a,round(1-pt(abs(mytstat),lengthx),6))
a<-table.row.end(a)
}
a<-table.end(a)
table.save(a,file='mytable.tab')
a<-table.start()
a<-table.row.start(a)
a<-table.element(a,'Partial Autocorrelation Function',4,TRUE)
a<-table.row.end(a)
a<-table.row.start(a)
a<-table.element(a,'Time lag k',header=TRUE)
a<-table.element(a,hyperlink('basics.htm','PACF(k)','click here for more information about the Partial Autocorrelation Function'),header=TRUE)
a<-table.element(a,'T-STAT',header=TRUE)
a<-table.element(a,'P-value',header=TRUE)
a<-table.row.end(a)
for (i in 1:par1) {
a<-table.row.start(a)
a<-table.element(a,i,header=TRUE)
a<-table.element(a,round(mypacf[i],6))
mytstat <- mypacf[i]*sqrtn
a<-table.element(a,round(mytstat,4))
a<-table.element(a,round(1-pt(abs(mytstat),lengthx),6))
a<-table.row.end(a)
}
a<-table.end(a)
table.save(a,file='mytable1.tab')