Free Statistics

of Irreproducible Research!

Author's title

Author*Unverified author*
R Software Modulerwasp_autocorrelation.wasp
Title produced by software(Partial) Autocorrelation Function
Date of computationTue, 10 Apr 2012 05:46:48 -0400
Cite this page as followsStatistical Computations at FreeStatistics.org, Office for Research Development and Education, URL https://freestatistics.org/blog/index.php?v=date/2012/Apr/10/t1334051327bqxrdeqd3tn9fix.htm/, Retrieved Sun, 28 Apr 2024 03:35:01 +0000
Statistical Computations at FreeStatistics.org, Office for Research Development and Education, URL https://freestatistics.org/blog/index.php?pk=164340, Retrieved Sun, 28 Apr 2024 03:35:01 +0000
QR Codes:

Original text written by user:
IsPrivate?No (this computation is public)
User-defined keywordsKDGP2W12
Estimated Impact193
Family? (F = Feedback message, R = changed R code, M = changed R Module, P = changed Parameters, D = changed Data)
-       [(Partial) Autocorrelation Function] [Autocorrelatie: I...] [2012-04-10 09:46:48] [ef02148344264346fe23a57cc665e979] [Current]
Feedback Forum

Post a new message
Dataseries X:
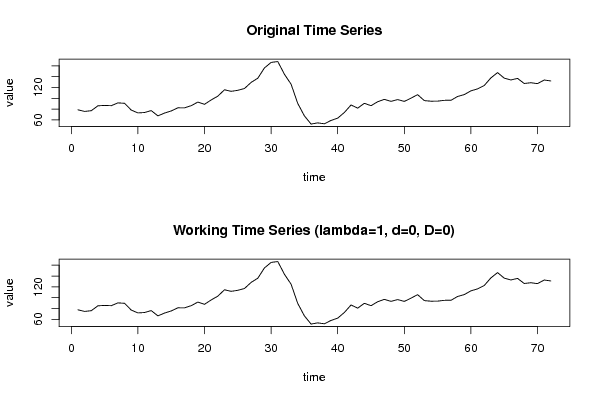
78,7
75,7
77,1
86,1
86,8
86,3
91,5
90,7
78,2
73
73,7
77,3
67,5
72,7
76,6
82,4
82,3
86,3
93
88,8
96,9
103,9
115,7
112,8
114,7
118
129,3
137
156
166,2
167,8
144,3
126
90,4
67,5
52,4
54,6
52,9
59,1
63,3
73,8
87,6
81,8
90,7
86,3
93,6
98
94,3
97,6
94,2
100,2
106,7
95,7
94,6
94,7
96,2
96,3
103,3
106,8
113,7
117,4
123,6
137,6
147,4
137,2
133,8
136,7
127,3
128,7
127
133,7
132


Summary of computational transaction
Raw Inputview raw input (R code)
Raw Outputview raw output of R engine
Computing time2 seconds
R Server'Gertrude Mary Cox' @ cox.wessa.net

\begin{tabular}{lllllllll}
\hline
Summary of computational transaction \tabularnewline
Raw Input & view raw input (R code)  \tabularnewline
Raw Output & view raw output of R engine  \tabularnewline
Computing time & 2 seconds \tabularnewline
R Server & 'Gertrude Mary Cox' @ cox.wessa.net \tabularnewline
\hline
\end{tabular}
%Source: https://freestatistics.org/blog/index.php?pk=164340&T=0

[TABLE]
[ROW][C]Summary of computational transaction[/C][/ROW]
[ROW][C]Raw Input[/C][C]view raw input (R code) [/C][/ROW]
[ROW][C]Raw Output[/C][C]view raw output of R engine [/C][/ROW]
[ROW][C]Computing time[/C][C]2 seconds[/C][/ROW]
[ROW][C]R Server[/C][C]'Gertrude Mary Cox' @ cox.wessa.net[/C][/ROW]
[/TABLE]
Source: https://freestatistics.org/blog/index.php?pk=164340&T=0

Globally Unique Identifier (entire table): ba.freestatistics.org/blog/index.php?pk=164340&T=0

As an alternative you can also use a QR Code:  

The GUIDs for individual cells are displayed in the table below:

Summary of computational transaction
Raw Inputview raw input (R code)
Raw Outputview raw output of R engine
Computing time2 seconds
R Server'Gertrude Mary Cox' @ cox.wessa.net


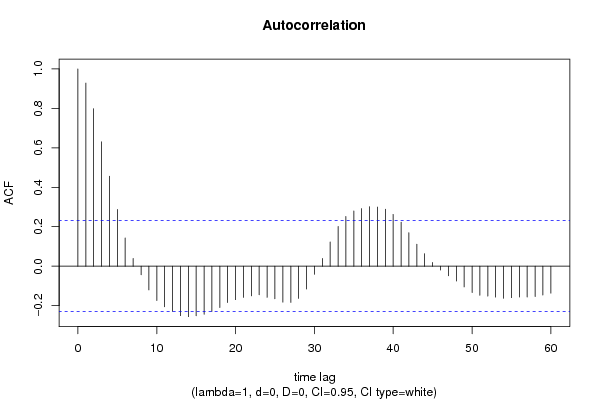
Autocorrelation Function
Time lag kACF(k)T-STATP-value
10.9281487.87560
20.7978296.76980
30.6304725.34970
40.4559493.86890.000119
50.2873832.43850.008608
60.1429631.21310.114531
70.0390120.3310.370792
8-0.043231-0.36680.357412
9-0.120353-1.02120.155282
10-0.174029-1.47670.07206
11-0.205655-1.7450.042623
12-0.229204-1.94490.027849
13-0.250577-2.12620.018457
14-0.255876-2.17120.016607
15-0.251409-2.13330.018155
16-0.243646-2.06740.021146
17-0.229418-1.94670.027738
18-0.209158-1.77480.040082
19-0.184151-1.56260.061269
20-0.169694-1.43990.077114
21-0.158181-1.34220.091872
22-0.150415-1.27630.102974
23-0.14485-1.22910.11152
24-0.158012-1.34080.092104
25-0.165218-1.40190.082617
26-0.182374-1.54750.063064
27-0.183405-1.55620.062017
28-0.163427-1.38670.084902
29-0.115396-0.97920.165389
30-0.040596-0.34450.365748
310.0388930.330.371171
320.123021.04390.15002
330.2011911.70720.046051
340.2516672.13550.018063
350.2797022.37330.010149
360.2919432.47720.007795
370.3014082.55750.006324
380.299652.54260.006577
390.2883892.44710.008422
400.262542.22770.014512
410.2224641.88770.03155
420.169181.43550.077732
430.1111110.94280.174467
440.0632750.53690.296495
450.0191310.16230.43575
46-0.019202-0.16290.435515
47-0.048145-0.40850.342051
48-0.074958-0.6360.263385
49-0.104959-0.89060.188052
50-0.133489-1.13270.130551
51-0.147799-1.25410.106928
52-0.151654-1.28680.101138
53-0.156737-1.330.093866
54-0.162791-1.38130.085724
55-0.159614-1.35440.089926
56-0.155989-1.32360.09491
57-0.156608-1.32890.094045
58-0.153813-1.30510.097999
59-0.145749-1.23670.110104
60-0.136733-1.16020.124896

\begin{tabular}{lllllllll}
\hline
Autocorrelation Function \tabularnewline
Time lag k & ACF(k) & T-STAT & P-value \tabularnewline
1 & 0.928148 & 7.8756 & 0 \tabularnewline
2 & 0.797829 & 6.7698 & 0 \tabularnewline
3 & 0.630472 & 5.3497 & 0 \tabularnewline
4 & 0.455949 & 3.8689 & 0.000119 \tabularnewline
5 & 0.287383 & 2.4385 & 0.008608 \tabularnewline
6 & 0.142963 & 1.2131 & 0.114531 \tabularnewline
7 & 0.039012 & 0.331 & 0.370792 \tabularnewline
8 & -0.043231 & -0.3668 & 0.357412 \tabularnewline
9 & -0.120353 & -1.0212 & 0.155282 \tabularnewline
10 & -0.174029 & -1.4767 & 0.07206 \tabularnewline
11 & -0.205655 & -1.745 & 0.042623 \tabularnewline
12 & -0.229204 & -1.9449 & 0.027849 \tabularnewline
13 & -0.250577 & -2.1262 & 0.018457 \tabularnewline
14 & -0.255876 & -2.1712 & 0.016607 \tabularnewline
15 & -0.251409 & -2.1333 & 0.018155 \tabularnewline
16 & -0.243646 & -2.0674 & 0.021146 \tabularnewline
17 & -0.229418 & -1.9467 & 0.027738 \tabularnewline
18 & -0.209158 & -1.7748 & 0.040082 \tabularnewline
19 & -0.184151 & -1.5626 & 0.061269 \tabularnewline
20 & -0.169694 & -1.4399 & 0.077114 \tabularnewline
21 & -0.158181 & -1.3422 & 0.091872 \tabularnewline
22 & -0.150415 & -1.2763 & 0.102974 \tabularnewline
23 & -0.14485 & -1.2291 & 0.11152 \tabularnewline
24 & -0.158012 & -1.3408 & 0.092104 \tabularnewline
25 & -0.165218 & -1.4019 & 0.082617 \tabularnewline
26 & -0.182374 & -1.5475 & 0.063064 \tabularnewline
27 & -0.183405 & -1.5562 & 0.062017 \tabularnewline
28 & -0.163427 & -1.3867 & 0.084902 \tabularnewline
29 & -0.115396 & -0.9792 & 0.165389 \tabularnewline
30 & -0.040596 & -0.3445 & 0.365748 \tabularnewline
31 & 0.038893 & 0.33 & 0.371171 \tabularnewline
32 & 0.12302 & 1.0439 & 0.15002 \tabularnewline
33 & 0.201191 & 1.7072 & 0.046051 \tabularnewline
34 & 0.251667 & 2.1355 & 0.018063 \tabularnewline
35 & 0.279702 & 2.3733 & 0.010149 \tabularnewline
36 & 0.291943 & 2.4772 & 0.007795 \tabularnewline
37 & 0.301408 & 2.5575 & 0.006324 \tabularnewline
38 & 0.29965 & 2.5426 & 0.006577 \tabularnewline
39 & 0.288389 & 2.4471 & 0.008422 \tabularnewline
40 & 0.26254 & 2.2277 & 0.014512 \tabularnewline
41 & 0.222464 & 1.8877 & 0.03155 \tabularnewline
42 & 0.16918 & 1.4355 & 0.077732 \tabularnewline
43 & 0.111111 & 0.9428 & 0.174467 \tabularnewline
44 & 0.063275 & 0.5369 & 0.296495 \tabularnewline
45 & 0.019131 & 0.1623 & 0.43575 \tabularnewline
46 & -0.019202 & -0.1629 & 0.435515 \tabularnewline
47 & -0.048145 & -0.4085 & 0.342051 \tabularnewline
48 & -0.074958 & -0.636 & 0.263385 \tabularnewline
49 & -0.104959 & -0.8906 & 0.188052 \tabularnewline
50 & -0.133489 & -1.1327 & 0.130551 \tabularnewline
51 & -0.147799 & -1.2541 & 0.106928 \tabularnewline
52 & -0.151654 & -1.2868 & 0.101138 \tabularnewline
53 & -0.156737 & -1.33 & 0.093866 \tabularnewline
54 & -0.162791 & -1.3813 & 0.085724 \tabularnewline
55 & -0.159614 & -1.3544 & 0.089926 \tabularnewline
56 & -0.155989 & -1.3236 & 0.09491 \tabularnewline
57 & -0.156608 & -1.3289 & 0.094045 \tabularnewline
58 & -0.153813 & -1.3051 & 0.097999 \tabularnewline
59 & -0.145749 & -1.2367 & 0.110104 \tabularnewline
60 & -0.136733 & -1.1602 & 0.124896 \tabularnewline
\hline
\end{tabular}
%Source: https://freestatistics.org/blog/index.php?pk=164340&T=1

[TABLE]
[ROW][C]Autocorrelation Function[/C][/ROW]
[ROW][C]Time lag k[/C][C]ACF(k)[/C][C]T-STAT[/C][C]P-value[/C][/ROW]
[ROW][C]1[/C][C]0.928148[/C][C]7.8756[/C][C]0[/C][/ROW]
[ROW][C]2[/C][C]0.797829[/C][C]6.7698[/C][C]0[/C][/ROW]
[ROW][C]3[/C][C]0.630472[/C][C]5.3497[/C][C]0[/C][/ROW]
[ROW][C]4[/C][C]0.455949[/C][C]3.8689[/C][C]0.000119[/C][/ROW]
[ROW][C]5[/C][C]0.287383[/C][C]2.4385[/C][C]0.008608[/C][/ROW]
[ROW][C]6[/C][C]0.142963[/C][C]1.2131[/C][C]0.114531[/C][/ROW]
[ROW][C]7[/C][C]0.039012[/C][C]0.331[/C][C]0.370792[/C][/ROW]
[ROW][C]8[/C][C]-0.043231[/C][C]-0.3668[/C][C]0.357412[/C][/ROW]
[ROW][C]9[/C][C]-0.120353[/C][C]-1.0212[/C][C]0.155282[/C][/ROW]
[ROW][C]10[/C][C]-0.174029[/C][C]-1.4767[/C][C]0.07206[/C][/ROW]
[ROW][C]11[/C][C]-0.205655[/C][C]-1.745[/C][C]0.042623[/C][/ROW]
[ROW][C]12[/C][C]-0.229204[/C][C]-1.9449[/C][C]0.027849[/C][/ROW]
[ROW][C]13[/C][C]-0.250577[/C][C]-2.1262[/C][C]0.018457[/C][/ROW]
[ROW][C]14[/C][C]-0.255876[/C][C]-2.1712[/C][C]0.016607[/C][/ROW]
[ROW][C]15[/C][C]-0.251409[/C][C]-2.1333[/C][C]0.018155[/C][/ROW]
[ROW][C]16[/C][C]-0.243646[/C][C]-2.0674[/C][C]0.021146[/C][/ROW]
[ROW][C]17[/C][C]-0.229418[/C][C]-1.9467[/C][C]0.027738[/C][/ROW]
[ROW][C]18[/C][C]-0.209158[/C][C]-1.7748[/C][C]0.040082[/C][/ROW]
[ROW][C]19[/C][C]-0.184151[/C][C]-1.5626[/C][C]0.061269[/C][/ROW]
[ROW][C]20[/C][C]-0.169694[/C][C]-1.4399[/C][C]0.077114[/C][/ROW]
[ROW][C]21[/C][C]-0.158181[/C][C]-1.3422[/C][C]0.091872[/C][/ROW]
[ROW][C]22[/C][C]-0.150415[/C][C]-1.2763[/C][C]0.102974[/C][/ROW]
[ROW][C]23[/C][C]-0.14485[/C][C]-1.2291[/C][C]0.11152[/C][/ROW]
[ROW][C]24[/C][C]-0.158012[/C][C]-1.3408[/C][C]0.092104[/C][/ROW]
[ROW][C]25[/C][C]-0.165218[/C][C]-1.4019[/C][C]0.082617[/C][/ROW]
[ROW][C]26[/C][C]-0.182374[/C][C]-1.5475[/C][C]0.063064[/C][/ROW]
[ROW][C]27[/C][C]-0.183405[/C][C]-1.5562[/C][C]0.062017[/C][/ROW]
[ROW][C]28[/C][C]-0.163427[/C][C]-1.3867[/C][C]0.084902[/C][/ROW]
[ROW][C]29[/C][C]-0.115396[/C][C]-0.9792[/C][C]0.165389[/C][/ROW]
[ROW][C]30[/C][C]-0.040596[/C][C]-0.3445[/C][C]0.365748[/C][/ROW]
[ROW][C]31[/C][C]0.038893[/C][C]0.33[/C][C]0.371171[/C][/ROW]
[ROW][C]32[/C][C]0.12302[/C][C]1.0439[/C][C]0.15002[/C][/ROW]
[ROW][C]33[/C][C]0.201191[/C][C]1.7072[/C][C]0.046051[/C][/ROW]
[ROW][C]34[/C][C]0.251667[/C][C]2.1355[/C][C]0.018063[/C][/ROW]
[ROW][C]35[/C][C]0.279702[/C][C]2.3733[/C][C]0.010149[/C][/ROW]
[ROW][C]36[/C][C]0.291943[/C][C]2.4772[/C][C]0.007795[/C][/ROW]
[ROW][C]37[/C][C]0.301408[/C][C]2.5575[/C][C]0.006324[/C][/ROW]
[ROW][C]38[/C][C]0.29965[/C][C]2.5426[/C][C]0.006577[/C][/ROW]
[ROW][C]39[/C][C]0.288389[/C][C]2.4471[/C][C]0.008422[/C][/ROW]
[ROW][C]40[/C][C]0.26254[/C][C]2.2277[/C][C]0.014512[/C][/ROW]
[ROW][C]41[/C][C]0.222464[/C][C]1.8877[/C][C]0.03155[/C][/ROW]
[ROW][C]42[/C][C]0.16918[/C][C]1.4355[/C][C]0.077732[/C][/ROW]
[ROW][C]43[/C][C]0.111111[/C][C]0.9428[/C][C]0.174467[/C][/ROW]
[ROW][C]44[/C][C]0.063275[/C][C]0.5369[/C][C]0.296495[/C][/ROW]
[ROW][C]45[/C][C]0.019131[/C][C]0.1623[/C][C]0.43575[/C][/ROW]
[ROW][C]46[/C][C]-0.019202[/C][C]-0.1629[/C][C]0.435515[/C][/ROW]
[ROW][C]47[/C][C]-0.048145[/C][C]-0.4085[/C][C]0.342051[/C][/ROW]
[ROW][C]48[/C][C]-0.074958[/C][C]-0.636[/C][C]0.263385[/C][/ROW]
[ROW][C]49[/C][C]-0.104959[/C][C]-0.8906[/C][C]0.188052[/C][/ROW]
[ROW][C]50[/C][C]-0.133489[/C][C]-1.1327[/C][C]0.130551[/C][/ROW]
[ROW][C]51[/C][C]-0.147799[/C][C]-1.2541[/C][C]0.106928[/C][/ROW]
[ROW][C]52[/C][C]-0.151654[/C][C]-1.2868[/C][C]0.101138[/C][/ROW]
[ROW][C]53[/C][C]-0.156737[/C][C]-1.33[/C][C]0.093866[/C][/ROW]
[ROW][C]54[/C][C]-0.162791[/C][C]-1.3813[/C][C]0.085724[/C][/ROW]
[ROW][C]55[/C][C]-0.159614[/C][C]-1.3544[/C][C]0.089926[/C][/ROW]
[ROW][C]56[/C][C]-0.155989[/C][C]-1.3236[/C][C]0.09491[/C][/ROW]
[ROW][C]57[/C][C]-0.156608[/C][C]-1.3289[/C][C]0.094045[/C][/ROW]
[ROW][C]58[/C][C]-0.153813[/C][C]-1.3051[/C][C]0.097999[/C][/ROW]
[ROW][C]59[/C][C]-0.145749[/C][C]-1.2367[/C][C]0.110104[/C][/ROW]
[ROW][C]60[/C][C]-0.136733[/C][C]-1.1602[/C][C]0.124896[/C][/ROW]
[/TABLE]
Source: https://freestatistics.org/blog/index.php?pk=164340&T=1

Globally Unique Identifier (entire table): ba.freestatistics.org/blog/index.php?pk=164340&T=1

As an alternative you can also use a QR Code:  

The GUIDs for individual cells are displayed in the table below:

Autocorrelation Function
Time lag kACF(k)T-STATP-value
10.9281487.87560
20.7978296.76980
30.6304725.34970
40.4559493.86890.000119
50.2873832.43850.008608
60.1429631.21310.114531
70.0390120.3310.370792
8-0.043231-0.36680.357412
9-0.120353-1.02120.155282
10-0.174029-1.47670.07206
11-0.205655-1.7450.042623
12-0.229204-1.94490.027849
13-0.250577-2.12620.018457
14-0.255876-2.17120.016607
15-0.251409-2.13330.018155
16-0.243646-2.06740.021146
17-0.229418-1.94670.027738
18-0.209158-1.77480.040082
19-0.184151-1.56260.061269
20-0.169694-1.43990.077114
21-0.158181-1.34220.091872
22-0.150415-1.27630.102974
23-0.14485-1.22910.11152
24-0.158012-1.34080.092104
25-0.165218-1.40190.082617
26-0.182374-1.54750.063064
27-0.183405-1.55620.062017
28-0.163427-1.38670.084902
29-0.115396-0.97920.165389
30-0.040596-0.34450.365748
310.0388930.330.371171
320.123021.04390.15002
330.2011911.70720.046051
340.2516672.13550.018063
350.2797022.37330.010149
360.2919432.47720.007795
370.3014082.55750.006324
380.299652.54260.006577
390.2883892.44710.008422
400.262542.22770.014512
410.2224641.88770.03155
420.169181.43550.077732
430.1111110.94280.174467
440.0632750.53690.296495
450.0191310.16230.43575
46-0.019202-0.16290.435515
47-0.048145-0.40850.342051
48-0.074958-0.6360.263385
49-0.104959-0.89060.188052
50-0.133489-1.13270.130551
51-0.147799-1.25410.106928
52-0.151654-1.28680.101138
53-0.156737-1.330.093866
54-0.162791-1.38130.085724
55-0.159614-1.35440.089926
56-0.155989-1.32360.09491
57-0.156608-1.32890.094045
58-0.153813-1.30510.097999
59-0.145749-1.23670.110104
60-0.136733-1.16020.124896


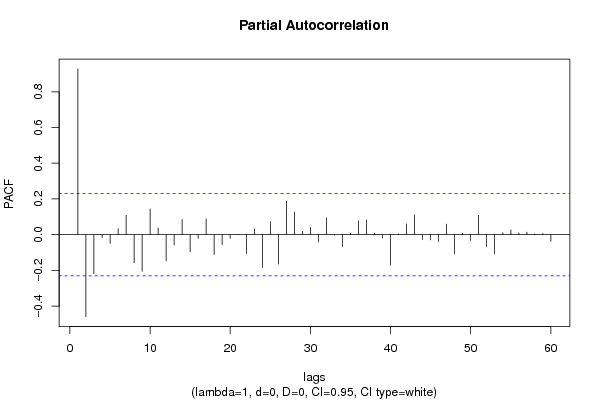
Partial Autocorrelation Function
Time lag kPACF(k)T-STATP-value
10.9281487.87560
2-0.459275-3.89710.000108
3-0.218182-1.85130.034111
4-0.015731-0.13350.447093
5-0.049066-0.41630.339202
60.0327910.27820.390812
70.1081960.91810.180822
8-0.156819-1.33070.093751
9-0.204564-1.73580.04344
100.1437461.21970.113274
110.0368540.31270.3777
12-0.146957-1.2470.108225
13-0.058093-0.49290.311779
140.0840890.71350.238916
15-0.095428-0.80970.21038
16-0.019667-0.16690.433968
170.0883370.74960.227981
18-0.111606-0.9470.173401
19-0.055271-0.4690.320248
20-0.019585-0.16620.434239
210.0002780.00240.499063
22-0.10578-0.89760.186203
230.0321940.27320.39275
24-0.184322-1.5640.061098
250.072450.61480.270327
26-0.164242-1.39360.083857
270.1873021.58930.058186
280.1262691.07140.143778
290.0176450.14970.4407
300.0400140.33950.3676
31-0.041413-0.35140.363155
320.0939070.79680.214085
33-0.002783-0.02360.490612
34-0.066045-0.56040.28847
350.008170.06930.472462
360.0782080.66360.254527
370.0817490.69370.245063
380.0084890.0720.471388
39-0.018614-0.15790.437473
40-0.170943-1.45050.075631
410.0037790.03210.487254
420.059980.5090.306172
430.1115690.94670.173481
44-0.027027-0.22930.40963
45-0.028123-0.23860.406034
46-0.038261-0.32470.373193
470.0578810.49110.312412
48-0.106813-0.90630.183891
490.0069640.05910.476523
50-0.031724-0.26920.394277
510.1082970.91890.180601
52-0.066783-0.56670.286349
53-0.107072-0.90850.183313
540.0109030.09250.463273
550.0268090.22750.410346
560.0092440.07840.468849
570.0138160.11720.4535
580.0039540.03350.486665
590.0059580.05060.479911
60-0.036771-0.3120.377966

\begin{tabular}{lllllllll}
\hline
Partial Autocorrelation Function \tabularnewline
Time lag k & PACF(k) & T-STAT & P-value \tabularnewline
1 & 0.928148 & 7.8756 & 0 \tabularnewline
2 & -0.459275 & -3.8971 & 0.000108 \tabularnewline
3 & -0.218182 & -1.8513 & 0.034111 \tabularnewline
4 & -0.015731 & -0.1335 & 0.447093 \tabularnewline
5 & -0.049066 & -0.4163 & 0.339202 \tabularnewline
6 & 0.032791 & 0.2782 & 0.390812 \tabularnewline
7 & 0.108196 & 0.9181 & 0.180822 \tabularnewline
8 & -0.156819 & -1.3307 & 0.093751 \tabularnewline
9 & -0.204564 & -1.7358 & 0.04344 \tabularnewline
10 & 0.143746 & 1.2197 & 0.113274 \tabularnewline
11 & 0.036854 & 0.3127 & 0.3777 \tabularnewline
12 & -0.146957 & -1.247 & 0.108225 \tabularnewline
13 & -0.058093 & -0.4929 & 0.311779 \tabularnewline
14 & 0.084089 & 0.7135 & 0.238916 \tabularnewline
15 & -0.095428 & -0.8097 & 0.21038 \tabularnewline
16 & -0.019667 & -0.1669 & 0.433968 \tabularnewline
17 & 0.088337 & 0.7496 & 0.227981 \tabularnewline
18 & -0.111606 & -0.947 & 0.173401 \tabularnewline
19 & -0.055271 & -0.469 & 0.320248 \tabularnewline
20 & -0.019585 & -0.1662 & 0.434239 \tabularnewline
21 & 0.000278 & 0.0024 & 0.499063 \tabularnewline
22 & -0.10578 & -0.8976 & 0.186203 \tabularnewline
23 & 0.032194 & 0.2732 & 0.39275 \tabularnewline
24 & -0.184322 & -1.564 & 0.061098 \tabularnewline
25 & 0.07245 & 0.6148 & 0.270327 \tabularnewline
26 & -0.164242 & -1.3936 & 0.083857 \tabularnewline
27 & 0.187302 & 1.5893 & 0.058186 \tabularnewline
28 & 0.126269 & 1.0714 & 0.143778 \tabularnewline
29 & 0.017645 & 0.1497 & 0.4407 \tabularnewline
30 & 0.040014 & 0.3395 & 0.3676 \tabularnewline
31 & -0.041413 & -0.3514 & 0.363155 \tabularnewline
32 & 0.093907 & 0.7968 & 0.214085 \tabularnewline
33 & -0.002783 & -0.0236 & 0.490612 \tabularnewline
34 & -0.066045 & -0.5604 & 0.28847 \tabularnewline
35 & 0.00817 & 0.0693 & 0.472462 \tabularnewline
36 & 0.078208 & 0.6636 & 0.254527 \tabularnewline
37 & 0.081749 & 0.6937 & 0.245063 \tabularnewline
38 & 0.008489 & 0.072 & 0.471388 \tabularnewline
39 & -0.018614 & -0.1579 & 0.437473 \tabularnewline
40 & -0.170943 & -1.4505 & 0.075631 \tabularnewline
41 & 0.003779 & 0.0321 & 0.487254 \tabularnewline
42 & 0.05998 & 0.509 & 0.306172 \tabularnewline
43 & 0.111569 & 0.9467 & 0.173481 \tabularnewline
44 & -0.027027 & -0.2293 & 0.40963 \tabularnewline
45 & -0.028123 & -0.2386 & 0.406034 \tabularnewline
46 & -0.038261 & -0.3247 & 0.373193 \tabularnewline
47 & 0.057881 & 0.4911 & 0.312412 \tabularnewline
48 & -0.106813 & -0.9063 & 0.183891 \tabularnewline
49 & 0.006964 & 0.0591 & 0.476523 \tabularnewline
50 & -0.031724 & -0.2692 & 0.394277 \tabularnewline
51 & 0.108297 & 0.9189 & 0.180601 \tabularnewline
52 & -0.066783 & -0.5667 & 0.286349 \tabularnewline
53 & -0.107072 & -0.9085 & 0.183313 \tabularnewline
54 & 0.010903 & 0.0925 & 0.463273 \tabularnewline
55 & 0.026809 & 0.2275 & 0.410346 \tabularnewline
56 & 0.009244 & 0.0784 & 0.468849 \tabularnewline
57 & 0.013816 & 0.1172 & 0.4535 \tabularnewline
58 & 0.003954 & 0.0335 & 0.486665 \tabularnewline
59 & 0.005958 & 0.0506 & 0.479911 \tabularnewline
60 & -0.036771 & -0.312 & 0.377966 \tabularnewline
\hline
\end{tabular}
%Source: https://freestatistics.org/blog/index.php?pk=164340&T=2

[TABLE]
[ROW][C]Partial Autocorrelation Function[/C][/ROW]
[ROW][C]Time lag k[/C][C]PACF(k)[/C][C]T-STAT[/C][C]P-value[/C][/ROW]
[ROW][C]1[/C][C]0.928148[/C][C]7.8756[/C][C]0[/C][/ROW]
[ROW][C]2[/C][C]-0.459275[/C][C]-3.8971[/C][C]0.000108[/C][/ROW]
[ROW][C]3[/C][C]-0.218182[/C][C]-1.8513[/C][C]0.034111[/C][/ROW]
[ROW][C]4[/C][C]-0.015731[/C][C]-0.1335[/C][C]0.447093[/C][/ROW]
[ROW][C]5[/C][C]-0.049066[/C][C]-0.4163[/C][C]0.339202[/C][/ROW]
[ROW][C]6[/C][C]0.032791[/C][C]0.2782[/C][C]0.390812[/C][/ROW]
[ROW][C]7[/C][C]0.108196[/C][C]0.9181[/C][C]0.180822[/C][/ROW]
[ROW][C]8[/C][C]-0.156819[/C][C]-1.3307[/C][C]0.093751[/C][/ROW]
[ROW][C]9[/C][C]-0.204564[/C][C]-1.7358[/C][C]0.04344[/C][/ROW]
[ROW][C]10[/C][C]0.143746[/C][C]1.2197[/C][C]0.113274[/C][/ROW]
[ROW][C]11[/C][C]0.036854[/C][C]0.3127[/C][C]0.3777[/C][/ROW]
[ROW][C]12[/C][C]-0.146957[/C][C]-1.247[/C][C]0.108225[/C][/ROW]
[ROW][C]13[/C][C]-0.058093[/C][C]-0.4929[/C][C]0.311779[/C][/ROW]
[ROW][C]14[/C][C]0.084089[/C][C]0.7135[/C][C]0.238916[/C][/ROW]
[ROW][C]15[/C][C]-0.095428[/C][C]-0.8097[/C][C]0.21038[/C][/ROW]
[ROW][C]16[/C][C]-0.019667[/C][C]-0.1669[/C][C]0.433968[/C][/ROW]
[ROW][C]17[/C][C]0.088337[/C][C]0.7496[/C][C]0.227981[/C][/ROW]
[ROW][C]18[/C][C]-0.111606[/C][C]-0.947[/C][C]0.173401[/C][/ROW]
[ROW][C]19[/C][C]-0.055271[/C][C]-0.469[/C][C]0.320248[/C][/ROW]
[ROW][C]20[/C][C]-0.019585[/C][C]-0.1662[/C][C]0.434239[/C][/ROW]
[ROW][C]21[/C][C]0.000278[/C][C]0.0024[/C][C]0.499063[/C][/ROW]
[ROW][C]22[/C][C]-0.10578[/C][C]-0.8976[/C][C]0.186203[/C][/ROW]
[ROW][C]23[/C][C]0.032194[/C][C]0.2732[/C][C]0.39275[/C][/ROW]
[ROW][C]24[/C][C]-0.184322[/C][C]-1.564[/C][C]0.061098[/C][/ROW]
[ROW][C]25[/C][C]0.07245[/C][C]0.6148[/C][C]0.270327[/C][/ROW]
[ROW][C]26[/C][C]-0.164242[/C][C]-1.3936[/C][C]0.083857[/C][/ROW]
[ROW][C]27[/C][C]0.187302[/C][C]1.5893[/C][C]0.058186[/C][/ROW]
[ROW][C]28[/C][C]0.126269[/C][C]1.0714[/C][C]0.143778[/C][/ROW]
[ROW][C]29[/C][C]0.017645[/C][C]0.1497[/C][C]0.4407[/C][/ROW]
[ROW][C]30[/C][C]0.040014[/C][C]0.3395[/C][C]0.3676[/C][/ROW]
[ROW][C]31[/C][C]-0.041413[/C][C]-0.3514[/C][C]0.363155[/C][/ROW]
[ROW][C]32[/C][C]0.093907[/C][C]0.7968[/C][C]0.214085[/C][/ROW]
[ROW][C]33[/C][C]-0.002783[/C][C]-0.0236[/C][C]0.490612[/C][/ROW]
[ROW][C]34[/C][C]-0.066045[/C][C]-0.5604[/C][C]0.28847[/C][/ROW]
[ROW][C]35[/C][C]0.00817[/C][C]0.0693[/C][C]0.472462[/C][/ROW]
[ROW][C]36[/C][C]0.078208[/C][C]0.6636[/C][C]0.254527[/C][/ROW]
[ROW][C]37[/C][C]0.081749[/C][C]0.6937[/C][C]0.245063[/C][/ROW]
[ROW][C]38[/C][C]0.008489[/C][C]0.072[/C][C]0.471388[/C][/ROW]
[ROW][C]39[/C][C]-0.018614[/C][C]-0.1579[/C][C]0.437473[/C][/ROW]
[ROW][C]40[/C][C]-0.170943[/C][C]-1.4505[/C][C]0.075631[/C][/ROW]
[ROW][C]41[/C][C]0.003779[/C][C]0.0321[/C][C]0.487254[/C][/ROW]
[ROW][C]42[/C][C]0.05998[/C][C]0.509[/C][C]0.306172[/C][/ROW]
[ROW][C]43[/C][C]0.111569[/C][C]0.9467[/C][C]0.173481[/C][/ROW]
[ROW][C]44[/C][C]-0.027027[/C][C]-0.2293[/C][C]0.40963[/C][/ROW]
[ROW][C]45[/C][C]-0.028123[/C][C]-0.2386[/C][C]0.406034[/C][/ROW]
[ROW][C]46[/C][C]-0.038261[/C][C]-0.3247[/C][C]0.373193[/C][/ROW]
[ROW][C]47[/C][C]0.057881[/C][C]0.4911[/C][C]0.312412[/C][/ROW]
[ROW][C]48[/C][C]-0.106813[/C][C]-0.9063[/C][C]0.183891[/C][/ROW]
[ROW][C]49[/C][C]0.006964[/C][C]0.0591[/C][C]0.476523[/C][/ROW]
[ROW][C]50[/C][C]-0.031724[/C][C]-0.2692[/C][C]0.394277[/C][/ROW]
[ROW][C]51[/C][C]0.108297[/C][C]0.9189[/C][C]0.180601[/C][/ROW]
[ROW][C]52[/C][C]-0.066783[/C][C]-0.5667[/C][C]0.286349[/C][/ROW]
[ROW][C]53[/C][C]-0.107072[/C][C]-0.9085[/C][C]0.183313[/C][/ROW]
[ROW][C]54[/C][C]0.010903[/C][C]0.0925[/C][C]0.463273[/C][/ROW]
[ROW][C]55[/C][C]0.026809[/C][C]0.2275[/C][C]0.410346[/C][/ROW]
[ROW][C]56[/C][C]0.009244[/C][C]0.0784[/C][C]0.468849[/C][/ROW]
[ROW][C]57[/C][C]0.013816[/C][C]0.1172[/C][C]0.4535[/C][/ROW]
[ROW][C]58[/C][C]0.003954[/C][C]0.0335[/C][C]0.486665[/C][/ROW]
[ROW][C]59[/C][C]0.005958[/C][C]0.0506[/C][C]0.479911[/C][/ROW]
[ROW][C]60[/C][C]-0.036771[/C][C]-0.312[/C][C]0.377966[/C][/ROW]
[/TABLE]
Source: https://freestatistics.org/blog/index.php?pk=164340&T=2

Globally Unique Identifier (entire table): ba.freestatistics.org/blog/index.php?pk=164340&T=2

As an alternative you can also use a QR Code:  

The GUIDs for individual cells are displayed in the table below:

Partial Autocorrelation Function
Time lag kPACF(k)T-STATP-value
10.9281487.87560
2-0.459275-3.89710.000108
3-0.218182-1.85130.034111
4-0.015731-0.13350.447093
5-0.049066-0.41630.339202
60.0327910.27820.390812
70.1081960.91810.180822
8-0.156819-1.33070.093751
9-0.204564-1.73580.04344
100.1437461.21970.113274
110.0368540.31270.3777
12-0.146957-1.2470.108225
13-0.058093-0.49290.311779
140.0840890.71350.238916
15-0.095428-0.80970.21038
16-0.019667-0.16690.433968
170.0883370.74960.227981
18-0.111606-0.9470.173401
19-0.055271-0.4690.320248
20-0.019585-0.16620.434239
210.0002780.00240.499063
22-0.10578-0.89760.186203
230.0321940.27320.39275
24-0.184322-1.5640.061098
250.072450.61480.270327
26-0.164242-1.39360.083857
270.1873021.58930.058186
280.1262691.07140.143778
290.0176450.14970.4407
300.0400140.33950.3676
31-0.041413-0.35140.363155
320.0939070.79680.214085
33-0.002783-0.02360.490612
34-0.066045-0.56040.28847
350.008170.06930.472462
360.0782080.66360.254527
370.0817490.69370.245063
380.0084890.0720.471388
39-0.018614-0.15790.437473
40-0.170943-1.45050.075631
410.0037790.03210.487254
420.059980.5090.306172
430.1115690.94670.173481
44-0.027027-0.22930.40963
45-0.028123-0.23860.406034
46-0.038261-0.32470.373193
470.0578810.49110.312412
48-0.106813-0.90630.183891
490.0069640.05910.476523
50-0.031724-0.26920.394277
510.1082970.91890.180601
52-0.066783-0.56670.286349
53-0.107072-0.90850.183313
540.0109030.09250.463273
550.0268090.22750.410346
560.0092440.07840.468849
570.0138160.11720.4535
580.0039540.03350.486665
590.0059580.05060.479911
60-0.036771-0.3120.377966


Parameters (Session):
par1 = 10 ; par2 = 1 ; par3 = 0 ; par4 = 0 ; par5 = 12 ; par6 = White Noise ; par7 = 0.95 ;
Parameters (R input):
par1 = 60 ; par2 = 1 ; par3 = 0 ; par4 = 0 ; par5 = 12 ; par6 = White Noise ; par7 = 0.95 ; par8 = ;
R code (references can be found in the software module):
if (par1 == 'Default') {
par1 = 10*log10(length(x))
} else {
par1 <- as.numeric(par1)
}
par2 <- as.numeric(par2)
par3 <- as.numeric(par3)
par4 <- as.numeric(par4)
par5 <- as.numeric(par5)
if (par6 == 'White Noise') par6 <- 'white' else par6 <- 'ma'
par7 <- as.numeric(par7)
if (par8 != '') par8 <- as.numeric(par8)
ox <- x
if (par8 == '') {
if (par2 == 0) {
x <- log(x)
} else {
x <- (x ^ par2 - 1) / par2
}
} else {
x <- log(x,base=par8)
}
if (par3 > 0) x <- diff(x,lag=1,difference=par3)
if (par4 > 0) x <- diff(x,lag=par5,difference=par4)
bitmap(file='picts.png')
op <- par(mfrow=c(2,1))
plot(ox,type='l',main='Original Time Series',xlab='time',ylab='value')
if (par8=='') {
mytitle <- paste('Working Time Series (lambda=',par2,', d=',par3,', D=',par4,')',sep='')
mysub <- paste('(lambda=',par2,', d=',par3,', D=',par4,', CI=', par7, ', CI type=',par6,')',sep='')
} else {
mytitle <- paste('Working Time Series (base=',par8,', d=',par3,', D=',par4,')',sep='')
mysub <- paste('(base=',par8,', d=',par3,', D=',par4,', CI=', par7, ', CI type=',par6,')',sep='')
}
plot(x,type='l', main=mytitle,xlab='time',ylab='value')
par(op)
dev.off()
bitmap(file='pic1.png')
racf <- acf(x, par1, main='Autocorrelation', xlab='time lag', ylab='ACF', ci.type=par6, ci=par7, sub=mysub)
dev.off()
bitmap(file='pic2.png')
rpacf <- pacf(x,par1,main='Partial Autocorrelation',xlab='lags',ylab='PACF',sub=mysub)
dev.off()
(myacf <- c(racf$acf))
(mypacf <- c(rpacf$acf))
lengthx <- length(x)
sqrtn <- sqrt(lengthx)
load(file='createtable')
a<-table.start()
a<-table.row.start(a)
a<-table.element(a,'Autocorrelation Function',4,TRUE)
a<-table.row.end(a)
a<-table.row.start(a)
a<-table.element(a,'Time lag k',header=TRUE)
a<-table.element(a,hyperlink('basics.htm','ACF(k)','click here for more information about the Autocorrelation Function'),header=TRUE)
a<-table.element(a,'T-STAT',header=TRUE)
a<-table.element(a,'P-value',header=TRUE)
a<-table.row.end(a)
for (i in 2:(par1+1)) {
a<-table.row.start(a)
a<-table.element(a,i-1,header=TRUE)
a<-table.element(a,round(myacf[i],6))
mytstat <- myacf[i]*sqrtn
a<-table.element(a,round(mytstat,4))
a<-table.element(a,round(1-pt(abs(mytstat),lengthx),6))
a<-table.row.end(a)
}
a<-table.end(a)
table.save(a,file='mytable.tab')
a<-table.start()
a<-table.row.start(a)
a<-table.element(a,'Partial Autocorrelation Function',4,TRUE)
a<-table.row.end(a)
a<-table.row.start(a)
a<-table.element(a,'Time lag k',header=TRUE)
a<-table.element(a,hyperlink('basics.htm','PACF(k)','click here for more information about the Partial Autocorrelation Function'),header=TRUE)
a<-table.element(a,'T-STAT',header=TRUE)
a<-table.element(a,'P-value',header=TRUE)
a<-table.row.end(a)
for (i in 1:par1) {
a<-table.row.start(a)
a<-table.element(a,i,header=TRUE)
a<-table.element(a,round(mypacf[i],6))
mytstat <- mypacf[i]*sqrtn
a<-table.element(a,round(mytstat,4))
a<-table.element(a,round(1-pt(abs(mytstat),lengthx),6))
a<-table.row.end(a)
}
a<-table.end(a)
table.save(a,file='mytable1.tab')